We have some great sponsors for the Weather Talk Blog. Please let our sponsors know that you appreciate their support for the Weather Talk Blog.
Milner and Orr Funeral Home and Cremation Services located in Paducah, Kentucky and three other western Kentucky towns – at Milner and Orr they believe in families helping families. You can find Milner and Orr on Facebook, as well.
![]()
.

Wortham Dental Care located in Paducah, Kentucky. The gentle dentist. Mercury free dentistry. They also do safe Mercury removal. You can find Wortham Dental Care on Facebook, as well
.

Trover’s Equipment and Lawn Care – Family owned and operated! They are a dealer for Snapper, Simplicity, Snapper Pro, Bad Boy Mowers, and Intimidator Utility Vehicles. They are a Stihl and Dolmar power products dealer. They also are a dealer for Briggs & Stratton, Kohler gas & diesel engines, and Kawasaki engines. They service and repair just about any brand. You can find them on Facebook, as well
.

Visit their web-site here. Or, you can also visit their Facebook page.
.

Endrizzi’s Storm Shelters – For more information click here. Endrizzi Contracting and Landscaping can be found on Facebook, as well – click here
.
Are you looking for a full service insurance agency that writes homes, businesses, and vehicles in Illinois, Kentucky, and Tennessee. Call Gary’s office at 270.442.8234 for rates and plans to protect what matters to you!

Gary Eckelkamp’s web-site click the above banner or click here
.

This forecast update covers far southern Illinois, far southeast Missouri, and far western Kentucky. See the coverage map on the right side of the blog.
Remember that weather evolves. Check back frequently for updates, especially during active weather.
The forecast numbers below may vary a bit across the region. These are the averages.
Monday night – Partly cloudy and mild. Just a small chance for a scattered shower or storm.
Temperatures: Lows in the upper 60’s to around 70 degrees.
Winds: South/southeast winds at 5-10 mph
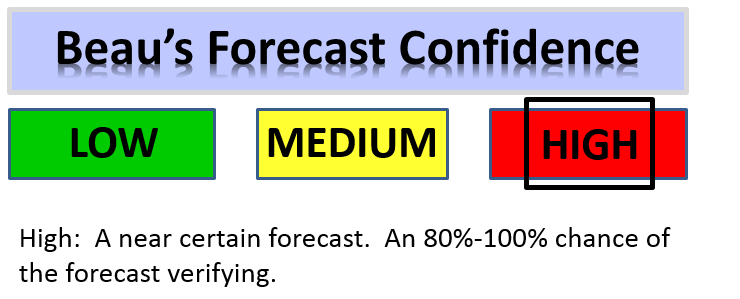
My confidence in this part of the forecast verifying is high
Should I cancel my outdoor plans? No
Is severe weather expected? No
What is the chance for precipitation? <10%
What impact is expected? Not expecting any widespread concerns.
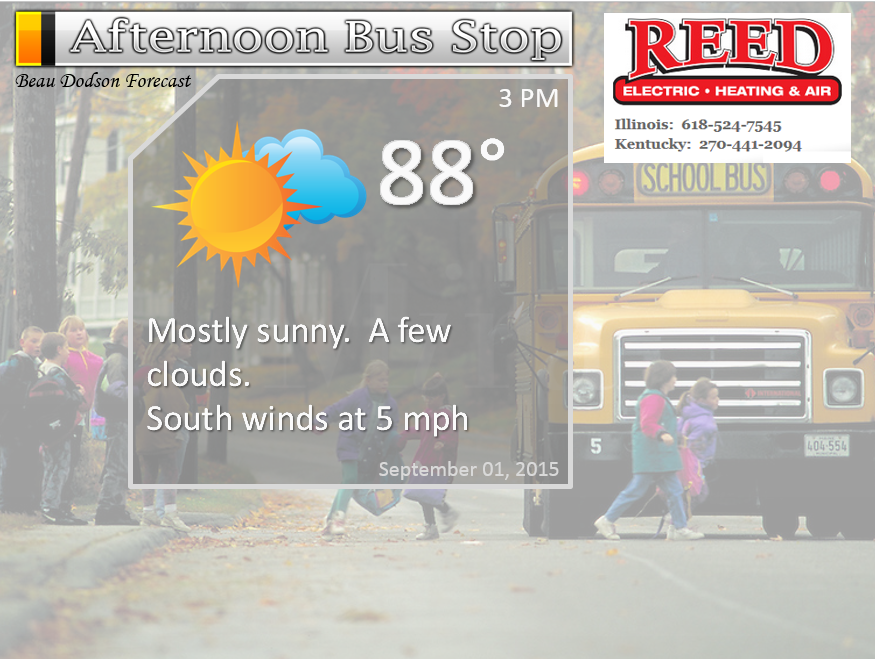
Tuesday – Partly sunny and warm. Just a small chance for a scattered shower or storm.
Temperatures: Highs in the upper 80’s to lower 90’s
Winds: South/southeast winds at 5-10 mph
My confidence in this part of the forecast verifying is high
Should I cancel my outdoor plans? No
Is severe weather expected? No
What is the chance for precipitation? <20% at any given spot
What impact is expected? Not expecting any widespread concerns.
Tuesday night – Partly cloudy and mild.
Temperatures: Lows in the upper 60’s to around 70 degrees.
Winds: South/southwest winds at 5-10 mph
My confidence in this part of the forecast verifying is high
Should I cancel my outdoor plans? No
Is severe weather expected? No
What is the chance for precipitation? <10%
What impact is expected? Not expecting any widespread concerns.
Wednesday – Partly sunny and warm.
Temperatures: Highs in the upper 80’s to lower 90’s
Winds: Southwest winds at 5-10 mph
My confidence in this part of the forecast verifying is high
Should I cancel my outdoor plans? No
Is severe weather expected? No
What is the chance for precipitation? <10%
What impact is expected? Not expecting any widespread concerns.
Wednesday night – Partly cloudy and mild.
Temperatures: Lows in the upper 60’s to around 70 degrees.
Winds: Southwest winds at 5-10 mph
My confidence in this part of the forecast verifying is high
Should I cancel my outdoor plans? No
Is severe weather expected? No
What is the chance for precipitation? <10%
What impact is expected? Not expecting any widespread concerns.
Thursday – Partly sunny and warm. Much of the same.
Temperatures: Highs in the upper 80’s to lower 90’s
Winds: South winds at 5-10 mph
My confidence in this part of the forecast verifying is high
Should I cancel my outdoor plans? No
Is severe weather expected? No
What is the chance for precipitation? <10%
What impact is expected? Not expecting any widespread concerns.
Thursday night – Partly cloudy and mild.
Temperatures: Lows in the upper 60’s to around 70 degrees.
Winds: South winds at 5-10 mph
My confidence in this part of the forecast verifying is high
Should I cancel my outdoor plans? No
Is severe weather expected? No
What is the chance for precipitation? 10%
What impact is expected? Not expecting any widespread concerns.
Friday – Partly sunny and warm. Much of the same.
Temperatures: Highs in the upper 80’s to lower 90’s
Winds: South winds at 5-10 mph
My confidence in this part of the forecast verifying is high
Should I cancel my outdoor plans? No
Is severe weather expected? No
What is the chance for precipitation? 10%-20%
What impact is expected? Not expecting any widespread concerns.
Friday night – Partly cloudy and mild.
Temperatures: Lows in the upper 60’s to around 70 degrees.
Winds: South winds at 5-10 mph
My confidence in this part of the forecast verifying is high
Should I cancel my outdoor plans? No
Is severe weather expected? No
What is the chance for precipitation? 10%
What impact is expected? Not expecting any widespread concerns.
Saturday – Partly sunny and warm. Much of the same.
Temperatures: Highs in the upper 80’s to lower 90’s
Winds: South winds at 5-10 mph
My confidence in this part of the forecast verifying is high
Should I cancel my outdoor plans? No
Is severe weather expected? No
What is the chance for precipitation? 10%-20%
What impact is expected? Not expecting any widespread concerns.
Saturday night – Partly cloudy and mild.
Temperatures: Lows in the upper 60’s to around 70 degrees.
Winds: South winds at 5-10 mph
My confidence in this part of the forecast verifying is high
Should I cancel my outdoor plans? No
Is severe weather expected? No
What is the chance for precipitation? 10%
What impact is expected? Not expecting any widespread concerns.
Sunday and Monday – Partly sunny on Sunday and mostly cloudy on Monday. A cold front is forecast to approach our region on Monday and Tuesday. This might enhance precipitation chances. Still some question marks on the timing of the cold front. I will have to fine tune the forecast as we move forward.
The front may hold off until after Monday. That would be good news for the holiday weekend.

The School Bus Stop Forecast is sponsored by Reed Electric, Heating & Air in Metropolis, IL offers full electrical, heating, and air conditioning services, as well as automatic transfer generators. Our licensed and insured service technicians serve Southern Illinois and Western KY with 24 hour service. Free estimates available for all new installations!
Click their ad below to visit their web-site or click here reedelec.com
![]()
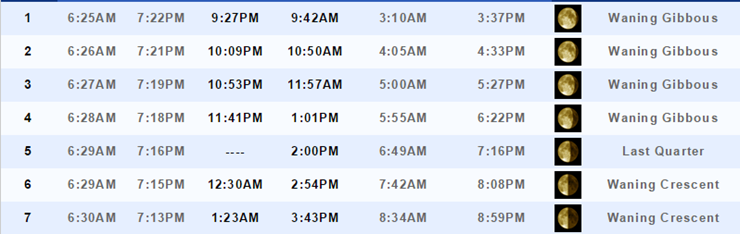
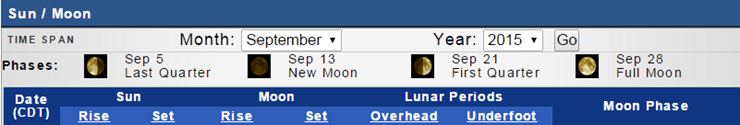
Sunrise and Sunset Times – Click Here
Don’t forget to check out the Southern Illinois Weather Observatory web-site for weather maps, tower cams, scanner feeds, radars, and much more! Click here
An explanation of what is happening in the atmosphere over the coming days…
Highlights
1. Meteorological fall arrives. What does that mean?
2. Warm/hot weather this week. Above normal temperatures
3. When might the pattern shift
4. Let’s review my August forecast
5. A series of cold fronts possible the 2nd and 3rd week of the month? Might put a kink in my above normal temperature forecast.
Meteorologists occasionally like to be different (perhaps a little geeky or nerdy). But, our methods of madness normally have a reason! We like to define seasons just a little bit different than everyone else. It is actually a simpler way. Spring is considered March through May. Summer is considered June through August. Fall is considered September through November. And, finally winter is defined by December through February.
Meteorological fall has 91 days. September through November.
Grouping the twelve calendar months into four three-month periods based on similar temperatures is the goal. Sometimes that works out and sometimes it does not. For example, the first week of September will feature well above normal temperatures. The last couple of weeks were more like autumn than this week.
Astronomical seasons is what you are likely more used to hearing about. They are based on the position of the Earth in relation to the sun. Thus the astronomical part.
It won’t be long before the leaves will start changing colors and cooler temperatures will arrive. But, not yet!
This coming week will feature warm to hot temperatures. I like to reserve the word hot for 90 degrees and above. We should see that this week. Humidity levels will be fairly high. Dew points will range from 65 to 72 degrees. That means it will feel humid. Not fall like by any means.
I know some of you could use a little bit of rain. But, that isn’t likely to happen this week. Dry weather appears to be the forecast through at least Friday.
I am watching a stronger storm system for next Monday or Tuesday. Long way off and it is a holiday weekend. I will be keep a close eye on the charts.
A cold front is forecast to push into our region from the northwest towards the beginning of next week. If that does happen then we might have some showers and thunderstorms. Again, I will keep a close eye on the trends and update accordingly.
It might hold off until Tuesday, which would be nice for the holiday weekend.
A couple of weather maps
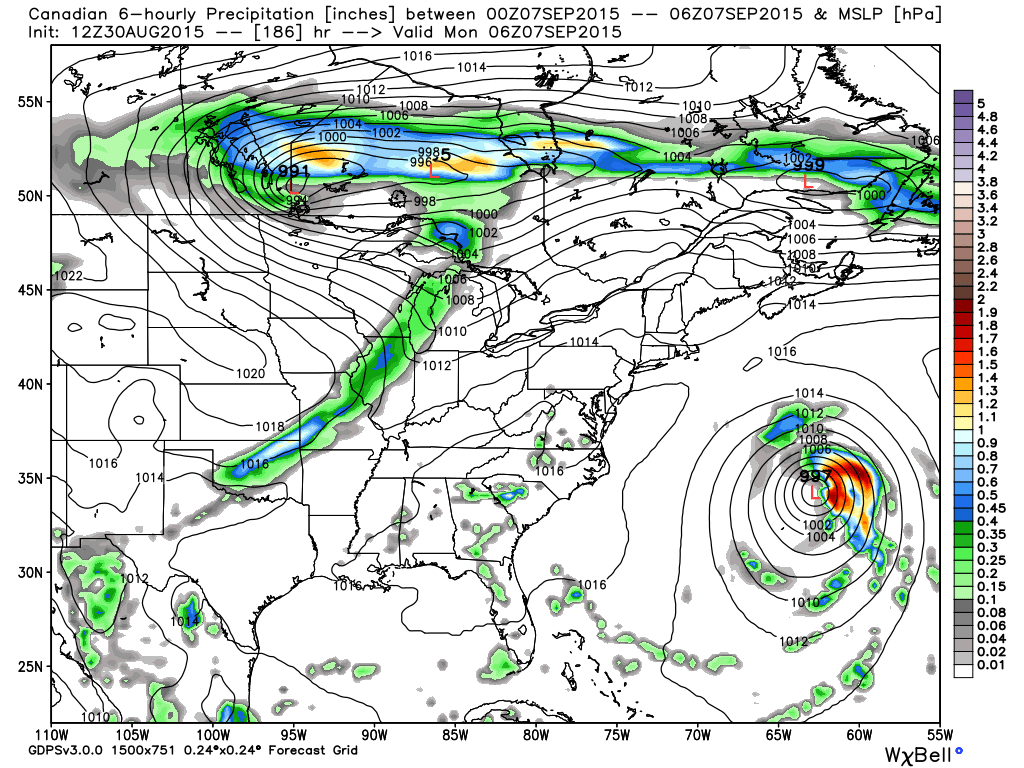
Here is the Canadian model for next Sunday night and Monday. Is that a cold front moving into our region from the west? The green and blue represent showers and thunderstorms. Low confidence. I will keep an eye on it. weatherbell.com image
Let’s look at some ensembles. What are ensembles? Well, let me try and explain. Let’s say you are lost at sea. You are on a deserted island. You have one sail boat. You have a chart that shows you the ocean currents. You look at one chart that shows you what should be the fastest way home. However, you want to explore other routes. You grab your pen and paper and start plotting all of the courses. You plot one according to sunny initial conditions with light winds. You plot a second course with cloudy sky conditions and no wind at all. You plot another course with initial conditions as stormy with 20 mph southerly winds. You keep doing this over and over again. Let’s say you do this 50 times. Each time you tweak the initial conditions a little differently. Once you have finished plotting all the possible routes home you look to see if there is a cluster of solutions that look the best. If there is a cluster then your odds favor that being the correct solution to sail home.
There are a set of models that forecasters use to forecast the weather. One model is the GFS. Ensembles are plots from the same model, but the model has been tweaked with slightly different initial conditions. We are trying to come up with a spread of possible end result scenarios. In other words, it is the same computer model but slightly different initial conditions are plugged into it over and over again. Forecasters can then look at the spread. If the bulk or majority of ensemble members agree then the likelihood for that scenario verifying increases. Confidence increases in the eventual outcome.
If ensemble members disagree and a large range of scenarios pop out then the uncertainty of the eventual outcome increases. A forecaster wants to see the ensembles agree with the main model output. The deterministic model output is another name for the main run of the model data. Most forecasters look at the deterministic output on a daily basis. If something big is about to happen then we start looking at ensembles, as well.
A good practice is to look at both on a daily basis. I hope that makes some sense?
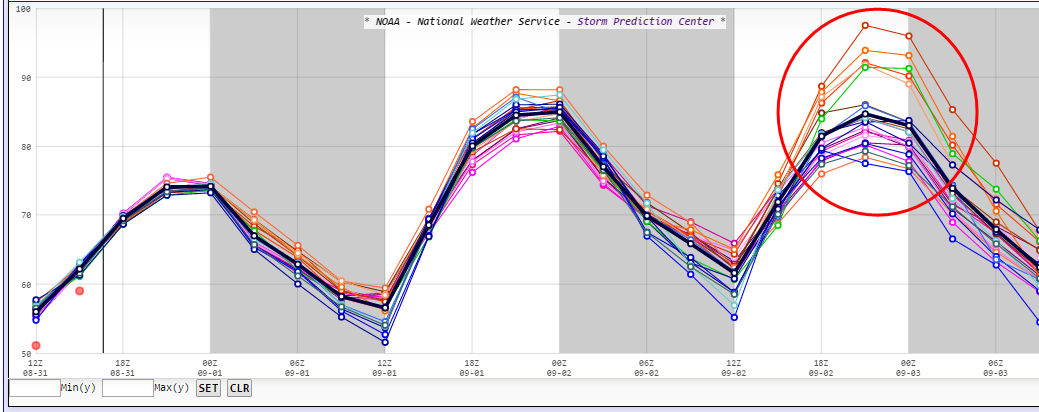
Here is a spaghetti plot (or plume) showing temperatures. This is the SREF model. Notice how closely clustered the lines are at the beginning? That means there is high confidence that the temperature forecast shown will be correct. But, look at the red circle. I circled that to show you that towards the end of the computer models run we start to see the lines move farther apart. That is because the data does not agree on what the temperature will be. That means there is some uncertainty on the temperature forecast during that time period.
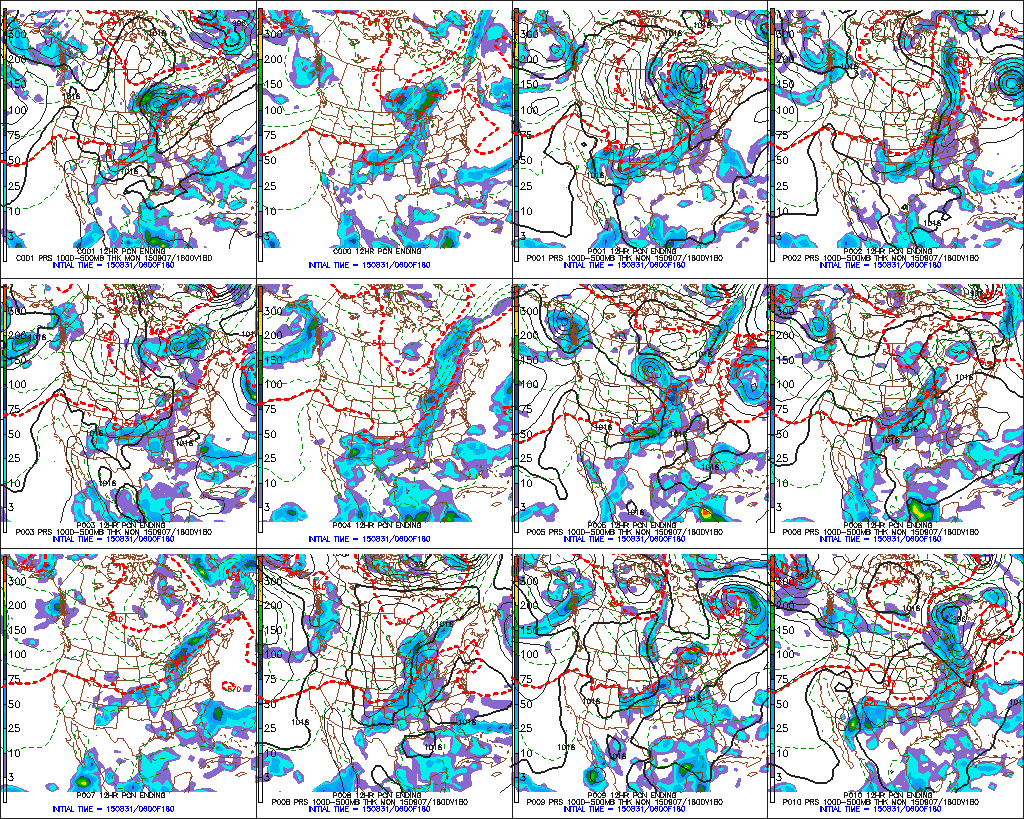
Let’s look the GFS ensembles for next Monday/Tuesday. Will it rain or won’t it rain? The blue and green represent rain. Each panel is the same model but tweaked a little bit differently. There appears to be some general consensus that there will be a cold front in the Central United States. But, there is also some disagreement on exactly where. Some of the data indicates it will be to our west. A lot of the data indicates it will be right over us. If it is over us then shower and storm chances will increase around Sunday night into Monday night. Again, still a long way off.
You can see on this 500 mb wind map (winds at 18,000′) for next Monday a dip to our north. That is the potential trough for early next week. A dip in the jet stream is a trough and typically represents unsettled and cooler weather. Map is from wright-weather.com
Colors represent wind speed.
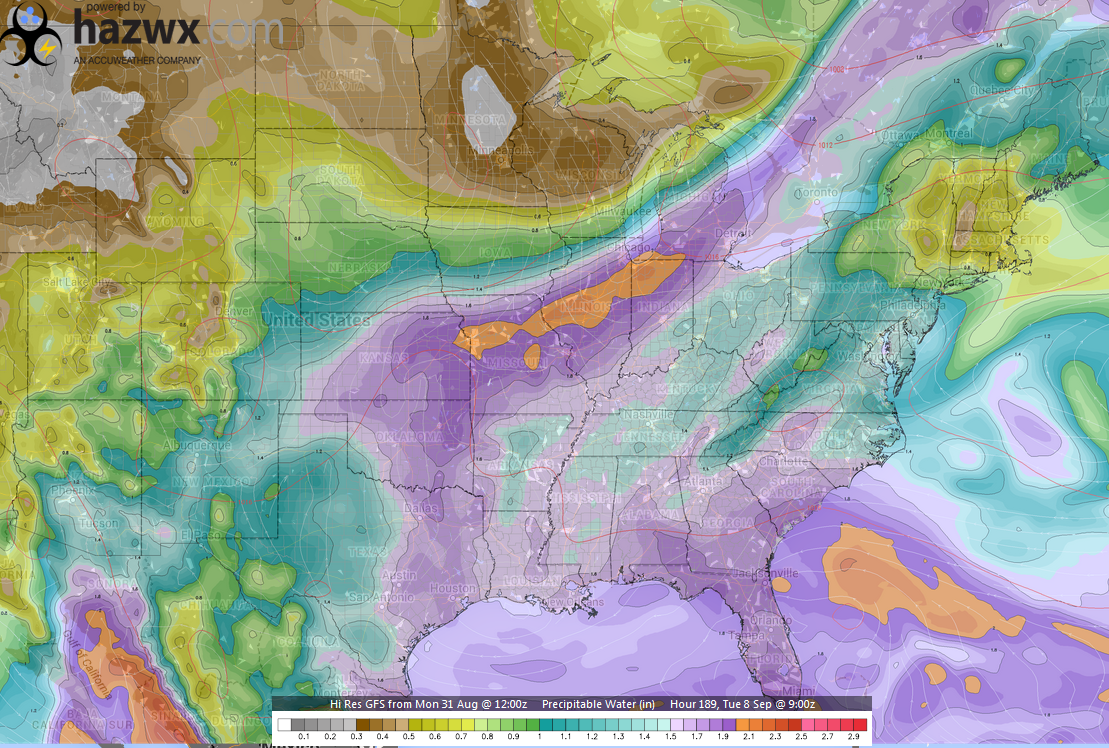
PWAT values for early next week are quite high ahead of the cold front. PWAT values pool ahead of cold fronts. You can see that happening here over the Missouri and Ohio Valleys. See the brownish colors to the north? Those are lower PWAT values behind the cold front.
PWAT values is one way meteorologists measure moisture content in the atmosphere. The higher the number the greater the risk for heavy rain.
The purple to orange colors represent values of 1.7 to 2.1″. That is a lot of moisture in the atmosphere ahead of the cold front.
The EC model argues against a cold front next Monday and Tuesday. Models are not in agreement.
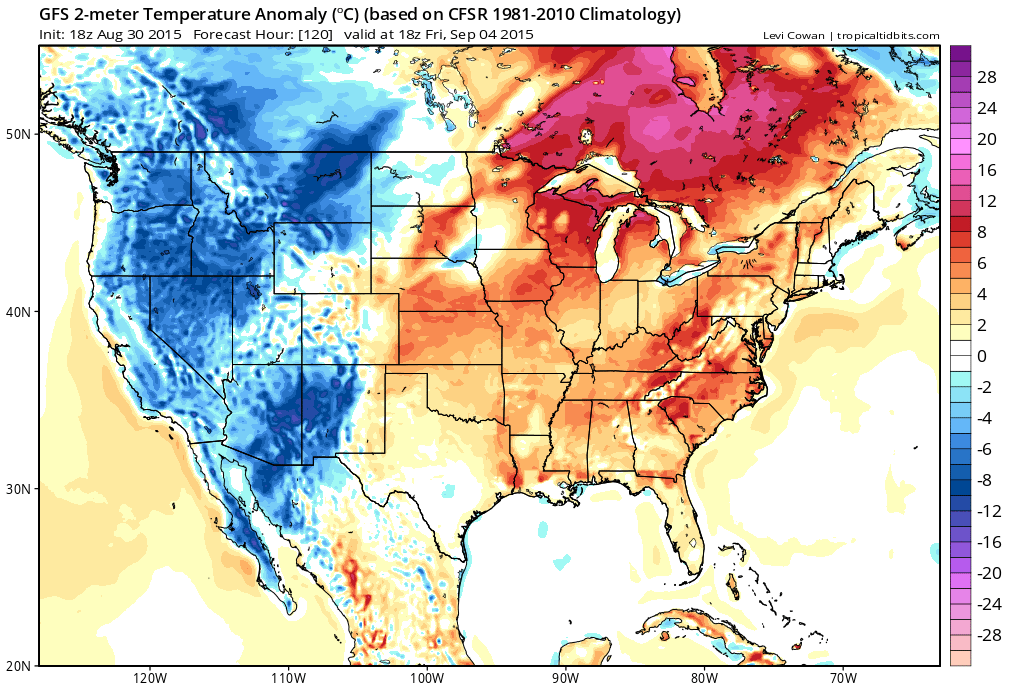
Let’s look at the temperature anomaly forecast. Let’s compare this week to next week.
This week has a lot of warm colors. That means above normal temperatures. Normal high temperatures for this time of the year are around 85 degrees. Normal low temperatures are around 62 degrees. We will run anywhere from 4 to 8 degrees above normal for high temperatures this week. Summer is not finished.
Images are from tropical tidbits.com
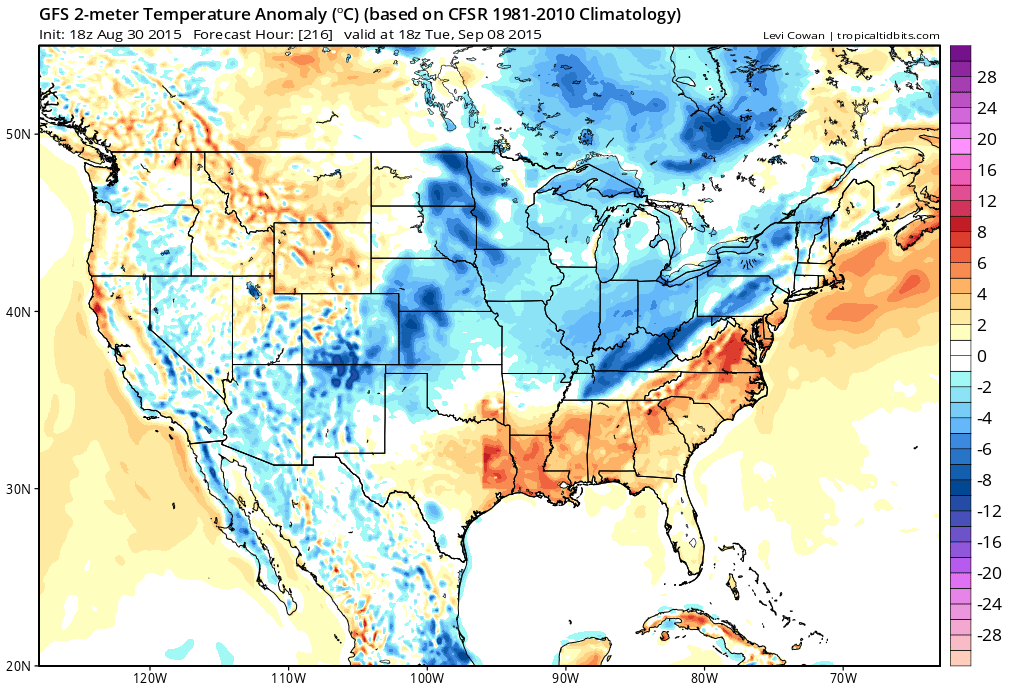
But, let’s compare to next Tuesday. If this chart is right then below normal temperatures may briefly return early next week. Low confidence because it is still in the long range part of the forecast.
I suspect this would mean a cold front will have moved through the region. The blue colors represent below normal temperatures. Normal high temperatures for this time of the year are around 85 degrees. Normal low temperatures are around 62 degrees.
AUGUST REVIEW
My August forecast was for the majority of days to deliver at or below normal temperatures. My precipitation forecast was for normal to above normal totals.
Without a doubt the temperature forecast more than verified. Temperatures were mostly below normal. Impressive numbers for an extended period of time. Coolish for much of August. I think many of you enjoyed the August weather pattern.
The precipitation across our region was mixed. Some spots had well above normal rainfall. Some of you had normal rainfall. And, quite a few spots were drier than normal.
Here are some charts showing you the August numbers
Here was the temperature anomaly for August. Quiet impressive anomalies.
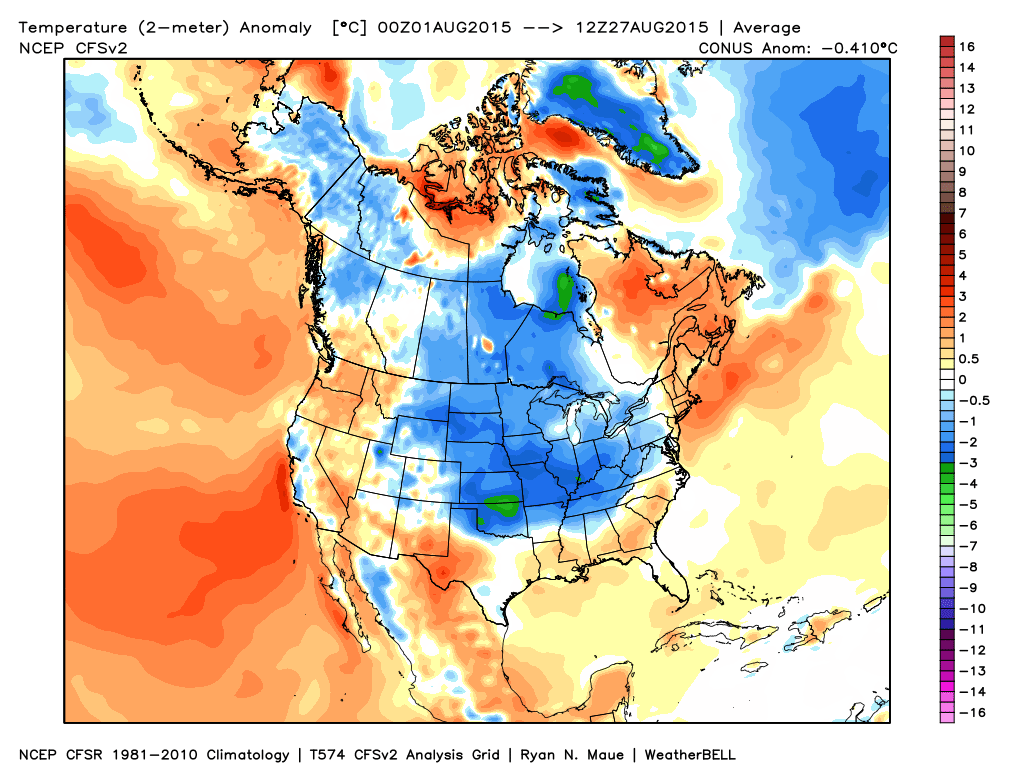
Precipitation was a bit mixed. Some places had a lot more rain than others. That is not uncommon during the summer months. Slow moving thunderstorm complexes can drop a lot of rain on some counties while neighboring areas miss out.
These maps are from the High Plains Regional Climate Center.
This first map shows you how many inches of rain fell during August. Much of the area ended up with 1-2 inches of rain.
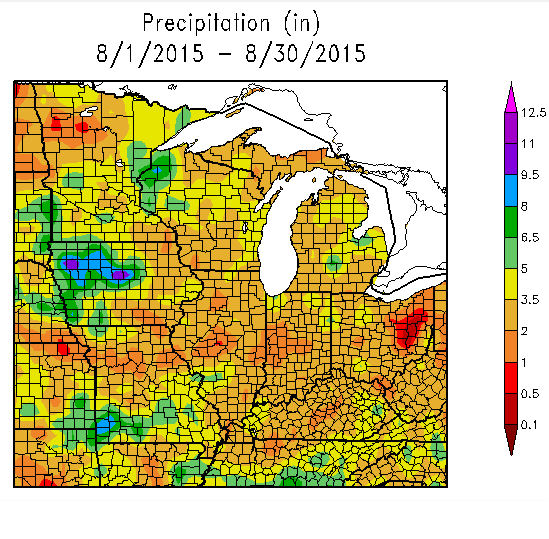
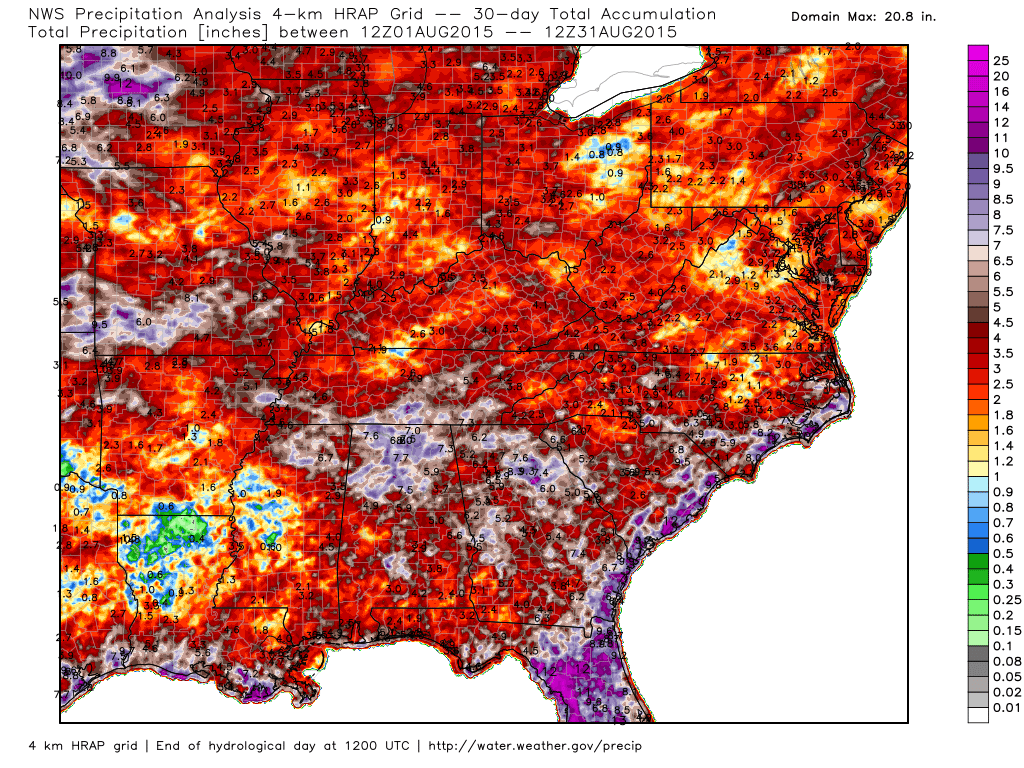
Here is a map from weatherbell.com This shows how much rain fell over the past month. Hard to read. Scale is on the right. If you are good at geography then you should be able to find our region. Heaviest rains in our region were over southern Missouri. Click to enlarge
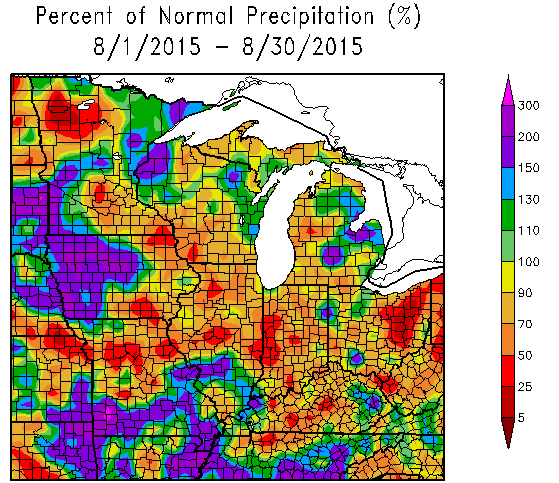
This next map shows you the percent of normal rainfall. Some places had more than 150% of normal rainfall. Other areas had 50%-70% of normal rainfall. Quite a wide range across our region.
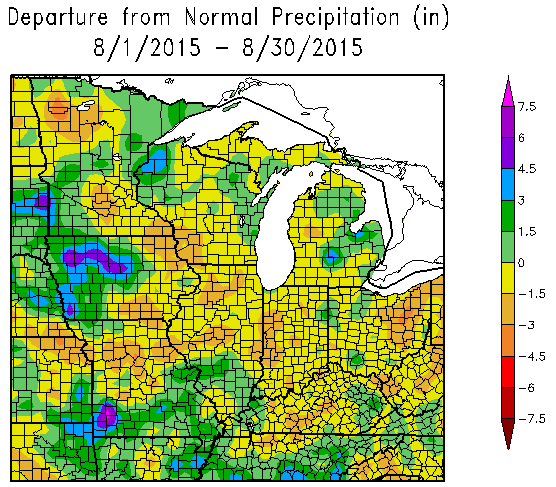
And, finally this is the departure from normal rainfall in inches. Parts of our region were 1 to 1.5″ below normal. Other areas were 1.5-2″+ above normal. Again, a wide range of rainfall totals over the region.
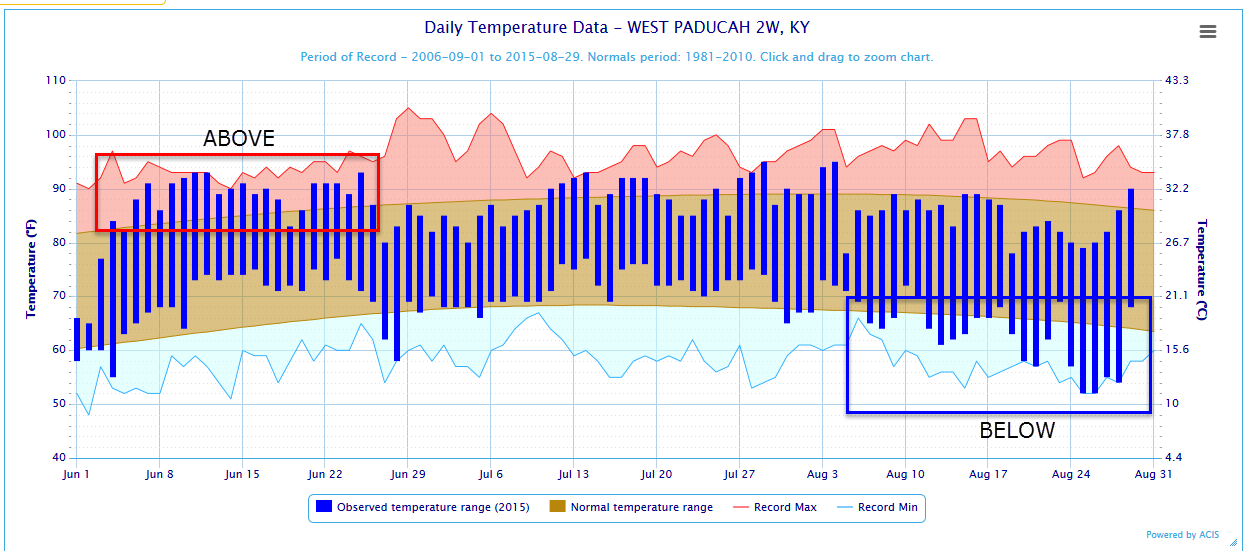
Let’s look back at the summer (June through August). Check out the flip in temperatures. The chart below shows you the high and low temperatures for June through August. The solid blue bars are the high and low temperatures. In June we had numerous days above normal (red rectangle). Then look at August (right side of the chart). Much of August was below normal in the temperature department (blue rectangle box). The Paducah, KY NWS only hit 95 degrees twice during the summer months.
Click image for a larger view
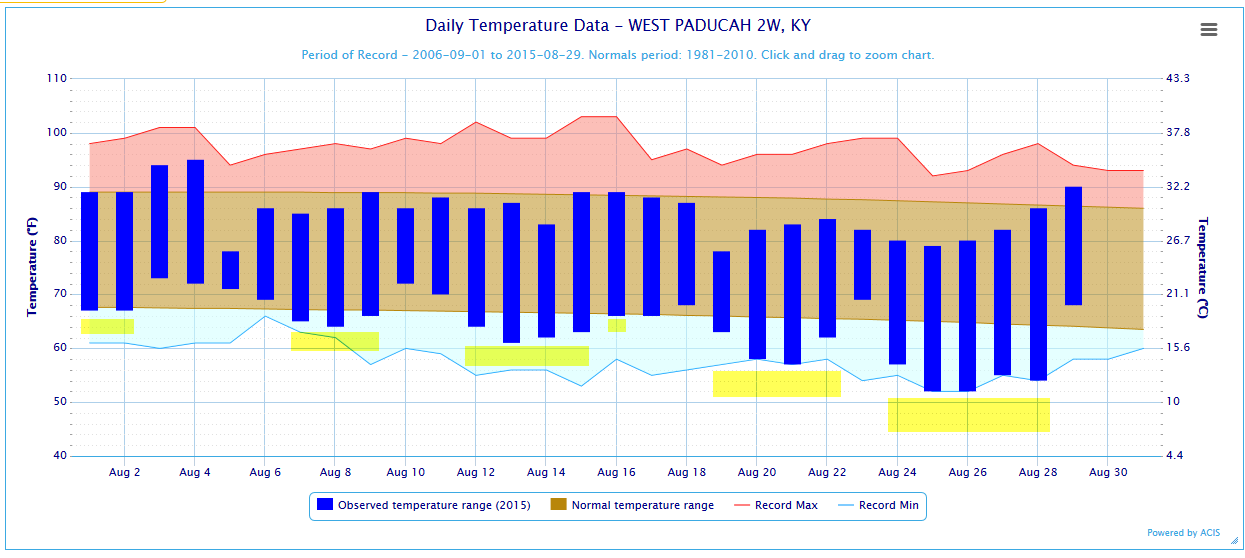
Zooming in on August. All the yellow areas represent below normal temperature days. This is for the Paducah, Kentucky area.
The blue bars are the high and low temperatures. The red line represents the record high for that day. The light blue line represents the record low for that day. The brownish area represents what normal values should be.
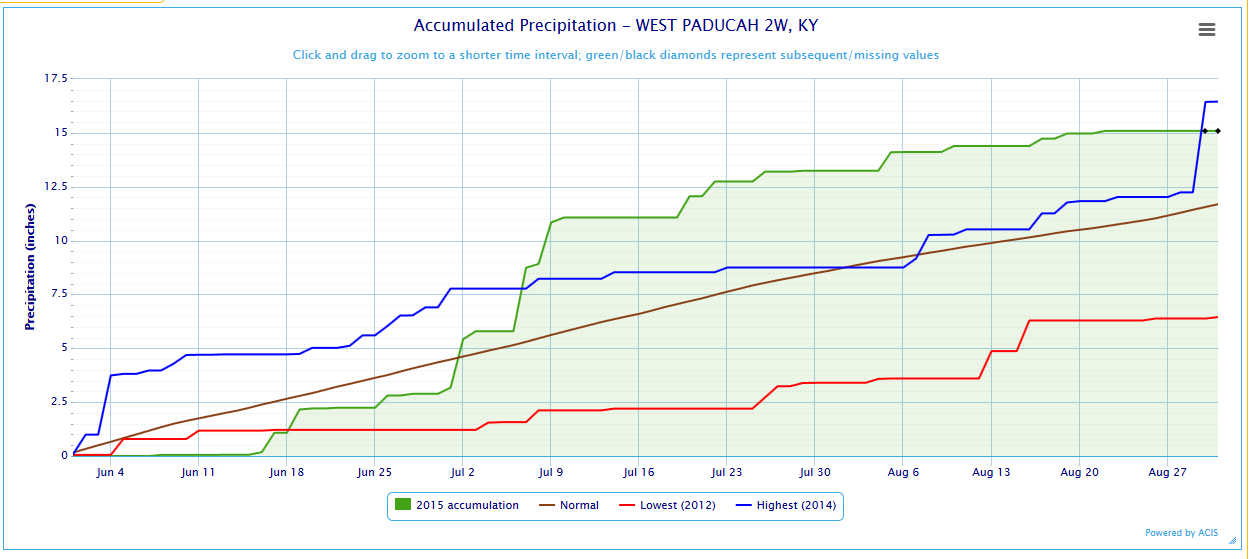
And, it was a very wet summer. Check out these numbers. The brown line represents normal rainfall. The green line is this years rainfall. Well well well above normal. This chart shows you June through August.
My September forecast is for more days to be at or above normal in the temperature department and drier than normal in the precipitation department. We will see how it goes. There are some cracks starting to show up in the data for the second and third week of the month. Meaning, colder than normal temperatures. If that happens then it could bust my September forecast thinking.
Remember that long range forecasting is usually low confidence forecasting.
My October forecast is for below normal temperatures. Not sure on precipitation just yet.
All signs point towards a colder than normal winter.
Radars
WEATHER RADAR PAGE – Click here —
Don’t forget to support our sponsors!
How much precipitation should we expect over the next few days?
No major widespread rainfall events anticipated through Thursday.

Can we expect severe thunderstorms over the next 24 to 48 hours? Remember that a severe thunderstorm is defined as a thunderstorm that produces 58 mph winds or higher, quarter size hail or larger, and/or a tornado.
Thunderstorm threat level will be ONE for Sunday afternoon and night. Near ZERO for Monday.
.
Tuesday: Severe weather is not anticipated
Wednesday: Severe weather is not anticipated
Thursday: Severe weather is not anticipated
Friday: Severe weather is not anticipated
Saturday: Severe weather is not anticipated
Sunday: Severe weather is not anticipated

No major concerns for the coming days. Calm weather. Let’s enjoy this pattern while it lasts.

I also set up a storm tracking page with additional links (use during active weather for quick reference)
Storm Tracking Tool Page
Here are the current river stage forecasts. You can click your state and then the dot for your location. It will bring up the full forecast and hydrograph.
Click Here For River Stage Forecasts…
Here are some current forecast hydrographs. These will be updated each day with new information.
Smithland Lock and Dam
Paducah, Kentucky Forecast Stage
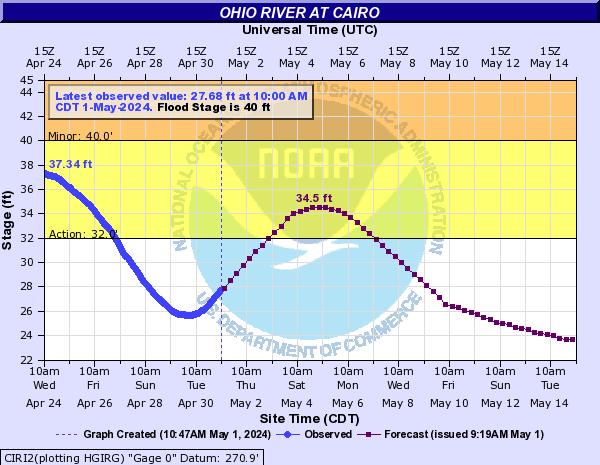
Cairo, Illinois
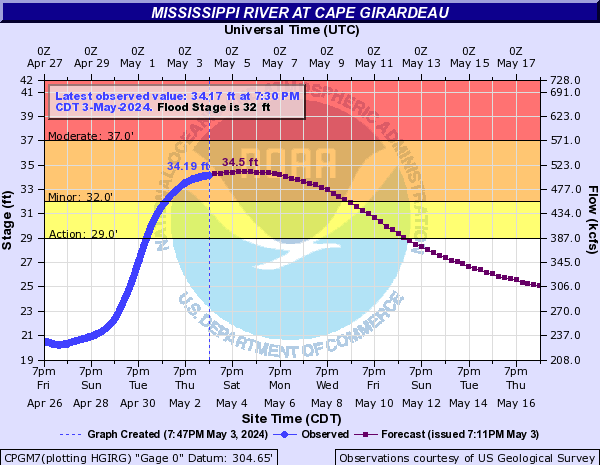
Cape Girardeau, Missouri
Current Temperatures Around The Local Area


We have regional radars and local city radars – if a radar does not seem to be updating then try another one. Occasional browsers need their cache cleared. You may also try restarting your browser. That usually fixes the problem. Occasionally we do have a radar go down. That is why I have duplicates. Thus, if one fails then try another one.
If you have any problems then please send me an email beaudodson@usawx.com
WEATHER RADAR PAGE – Click here —
We also have a new national interactive radar – you can view that radar by clicking here.
Local interactive city radars include St Louis, Mt Vernon, Evansville, Poplar Bluff, Cape Girardeau, Marion, Paducah, Hopkinsville, Memphis, Nashville, Dyersburg, and all of eastern Kentucky – these are interactive radars. Local city radars – click here
NOTE: Occasionally you will see ground clutter on the radar (these are false echoes). Normally they show up close to the radar sites – including Paducah.

Regional Radar – Click on radar to take you our full radar page.


Regional Radar
Live Lightning Data – zoom and pan: Click here
Live Lightning Data with sound (click the sound button on the left side of the page): Click here
I also set up a storm tracking page with additional links (use during active weather for quick reference)
Storm Tracking Tool Page
![]()
Current WARNINGS (a warning means take action now). Click on your county to drill down to the latest warning information. Keep in mind that there can be a 2-3 minute delay in the updated warning information.
I strongly encourage you to use a NOAA Weather Radio or warning cell phone app for the most up to date warning information. Nothing is faster than a NOAA weather radio.


Color shaded counties are under some type of watch, warning, advisory, or special weather statement. Click your county to view the latest information.

Missouri Warnings

Illinois Warnings

Kentucky Warnings
Here is the official 6-10 day and 8-14 day temperature and precipitation outlook. Check the date stamp at the top of each image (so you understand the time frame).
The forecast maps below are issued by the Weather Prediction Center (NOAA).


The latest 8-14 day temperature and precipitation outlook. Note the dates are at the top of the image. These maps DO NOT tell you how high or low temperatures or precipitation will be. They simply give you the probability as to whether temperatures or precipitation will be above or below normal.


Who do you trust for your weather information and who holds them accountable?
I have studied weather in our region since the late 1970’s. I have 37 years of experience in observing our regions weather patterns. My degree is in Broadcast Meteorology from Mississippi State University and an Associate of Science (AS). I am currently working on my Bachelor’s Degree in Geoscience. Just need to finish two Spanish classes!
I am a member of the American Meteorological Society. I am a NOAA Weather-Ready Nation Ambassador. And, I am the Meteorologist for McCracken County Emergency Management.
I own and operate the Southern Illinois Weather Observatory.
There is a lot of noise on the internet. A lot of weather maps are posted without explanation. Over time you should learn who to trust for your weather information.
My forecast philosophy is simple and straight forward.
- Communicate in simple terms
- To be as accurate as possible within a reasonable time frame before an event
- Interact with you on Twitter, Facebook, and the blog
- Minimize the “hype” that you might see on television or through other weather sources
- Push you towards utilizing wall-to-wall LOCAL TV coverage during severe weather events
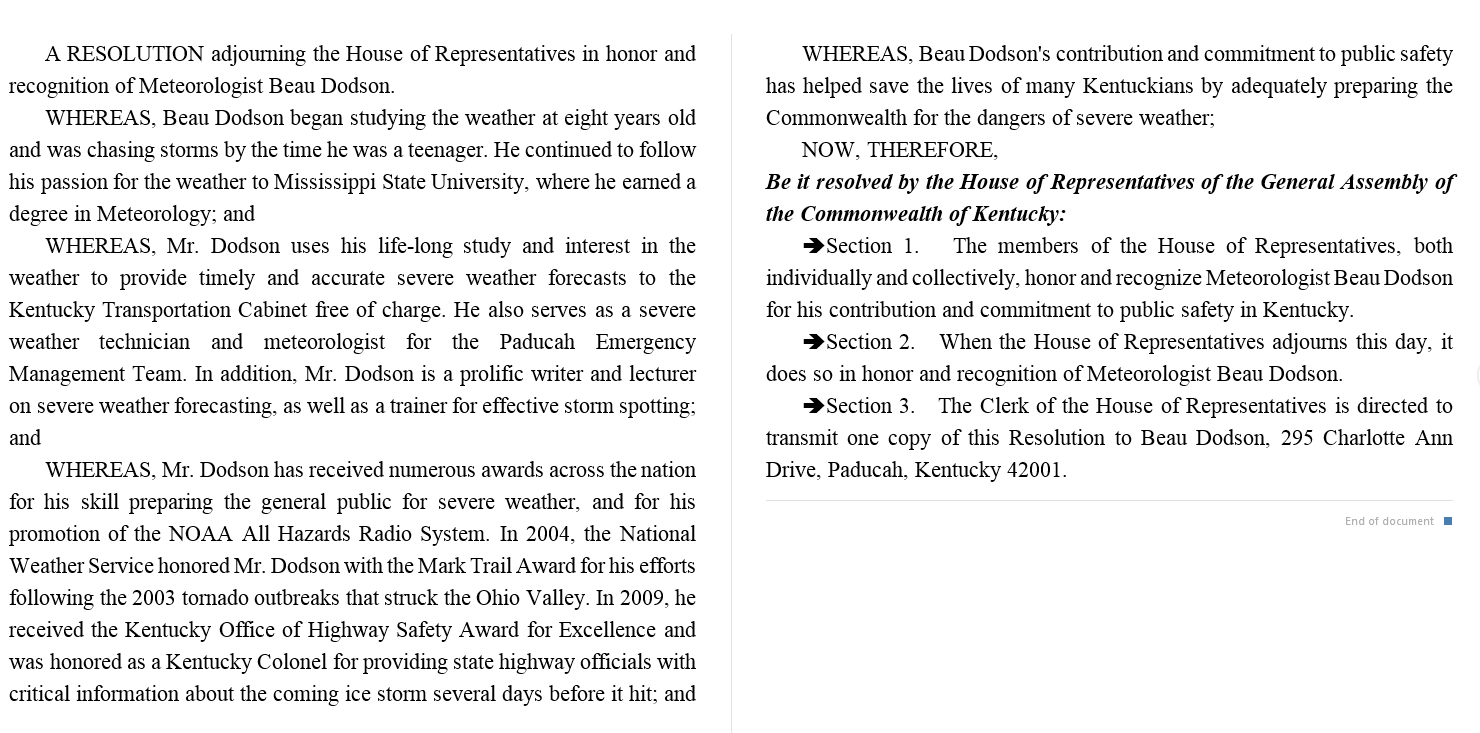
I am a recipient of the Mark Trail Award, WPSD Six Who Make A Difference Award, Kentucky Colonel, and the Caesar J. Fiamma” Award from the American Red Cross. In 2009 I was presented with the Kentucky Office of Highway Safety Award. I was recognized by the Kentucky House of Representatives for my service to the State of Kentucky leading up to several winter storms and severe weather outbreaks.
If you click on the image below you can read the Kentucky House of Representatives Resolution.
I am also President of the Shadow Angel Foundation which serves portions of western Kentucky and southern Illinois.
Many of my graphics are from www.weatherbell.com – a great resource for weather data, model data, and more

You can sign up for my AWARE email by clicking here I typically send out AWARE emails before severe weather, winter storms, or other active weather situations. I do not email watches or warnings. The emails are a basic “heads up” concerning incoming weather conditions.