.

Click one of the links below to take you directly to each section.
If a link is broken then please let me know. Beaudodson@usawx.com
-
- Go to storm tracking tools. Radars, lightning, & satellite
- Go to today’s forecast
- Go to the city-view graphic-casts
- Go to the severe weather outlook
- Go to the weather forecast discussion
- Go to the model future-cast radars
- Go to videos
- Go to weeks one, two, three, and four temperature & precipitation graphics
- Go to the autumn outlook.
- Go to the winter outlook,
- Go to Weatherbrains
- View our community charity work. Your subscription dollars help support these causes.
- County maps. I made a page with county maps. Some of you requested this.
Do you have questions or suggestions? If so, please email me. Beaudodson@usawx.com
.
Quick Glance
.
.
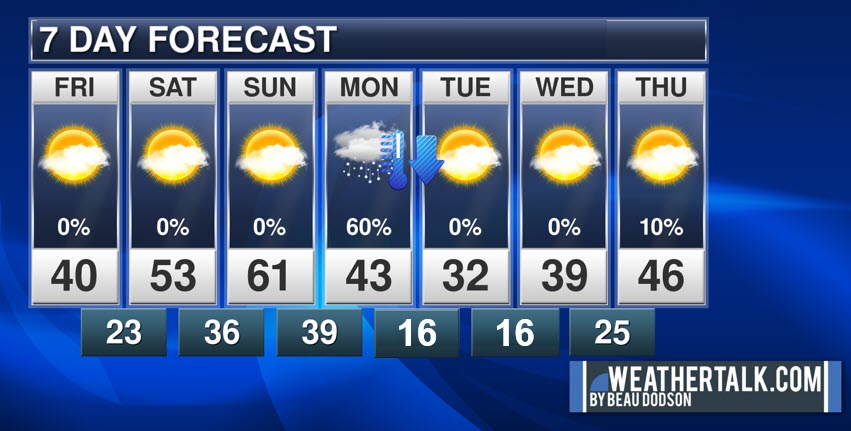
Your seven-day outlook.
.
Not receiving app/text messages?
Make sure you have the correct app/text options turned on. Find those under the personal notification settings tab at www.weathertalk.com. Red is off. Green is on.
.
Subscribers, PLEASE USE THE APP. ATT and Verizon are not reliable during severe weather. They are delaying text messages.
.
The app is under Beau Dodson Weather in the app store.

Apple users click here

Android users click here
.

Friday through Sunday
- Is lightning in the forecast? No.
- Are severe thunderstorms in the forecast? No.
* The NWS officially defines severe weather as 58 mph wind or great, 1″ hail or larger, and/or tornadoes - Is flash flooding in the forecast? No.
- Is ACCUMULATING snow or ice in the forecast? No.
- Will wind chill values drop below 10 degrees? No.
.
Monday through Thursday
- Is lightning in the forecast? No.
- Are severe thunderstorms in the forecast? No:
* The NWS officially defines severe weather as 58 mph wind or great, 1″ hail or larger, and/or tornadoes - Is flash flooding in the forecast? No.
- Is ACCUMULATING snow or ice in the forecast? Monitor. I am watching late Sunday night into Monday for snow. At this time accumulation appears to be light. Accumulations of 0″ to 1″.
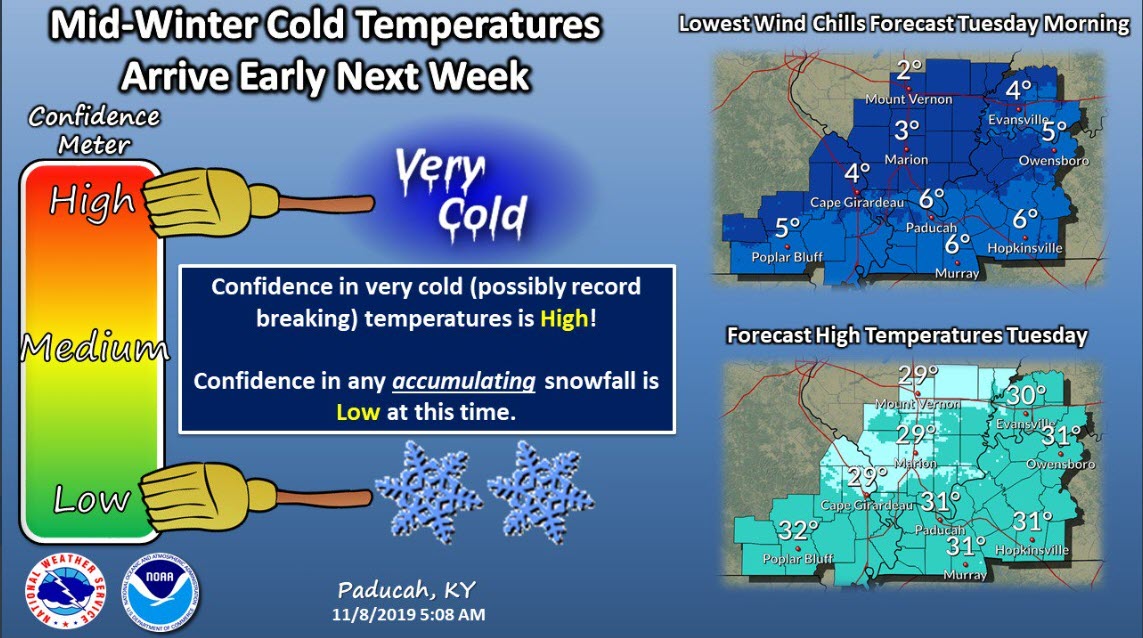
- Will wind chill values drop below 10 degrees? Yes. Late Monday night into Tuesday morning wind chills could briefly drop below ten degrees. Widespread teens likely.
.,
Click here if you would like to return to the top of the page.
.
.
Click here if you would like to return to the top of the page.
.

.
County Maps: Click Here
Have there been any significant changes in the forecast over the last 24 hours?
Small temperature adjustments.
I lowered temperatures Monday through Wednesday.
I lowered rain chances Sunday night.
I increased rain and snow chances on Monday.
I added my accumulation forecast.
.
What changes might occur in the forecast?
Monday’s forecast. Snow totals may need adjusting.
Click here if you would like to return to the top of the page.
.

** The new app is finished. Make sure you have the new one. If not, go to WeatherTalk in the app store. Download the new app. Notice the icon is no longer orange. It is a grey/dark color **
.
** NOTE **
I am traveling to Europe this week and next week. I will keep the daily blog, videos, severe weather updates, app messages, and everything else updated. There may be some differences in what time everything is posted.
.
The growing season is over. Thus, we do not need frost or freeze alerts until spring.
** Updated graphics **

.
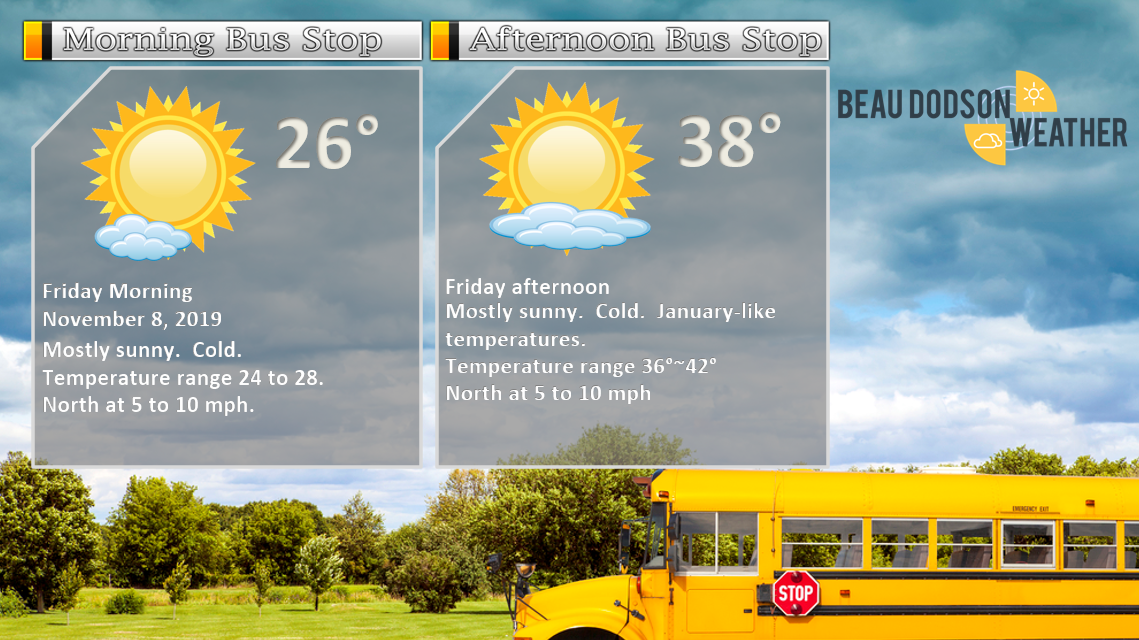
November 8, 2019
Friday’s Forecast: Becoming sunny. Cold. Well below normal temperatures. January-like temperatures.
What is the chance of precipitation? MO ~ 0% IL ~ 0% KY ~ 0% TN ~ 0%
How confident am I that this forecast will verify: High (70% confidence in the forecast)
Temperature range: MO Bootheel 40° to 44° SE MO 36° to 42° South IL 36° to 42° Northwest KY (near Indiana border) 38° to 44° West KY 38° to 44° NW TN 42° to 44°
Wind direction and speed: North and northeast at 6 to 12 mph with higher gusts.
Wind chill or heat index (feels like) temperature forecast: 26° to 36°
Coverage of precipitation: None
What impacts are anticipated from the weather? Monitor early AM hours for black ice.
What action is required: Slow your vehicle if black ice develops Thursday night/Friday morning. Low chance.
Should I cancel my outdoor plans? No
UV Index: 4 Moderate
Sunrise: 6:27 AM
.
Friday night Forecast: Partly cloudy with a slight chance of snow flurries.
What is the chance of precipitation? MO ~ 10% IL ~ 20% KY ~ 10% TN ~ 10%
How confident am I that this forecast will verify: High (80% confidence in the forecast)
Temperature range: MO Bootheel 23° to 26° SE MO 23° to 26° South IL 23° to 26° Northwest KY (near Indiana border) 23° to 26° West KY 23° to 26° NW TN 24° to 28°
Wind direction and speed: Variable wind at 4 to 8 mph
Wind chill or heat index (feels like) temperature forecast: 34° to 42°
Coverage of precipitation: None to isolated
What impacts are anticipated from the weather? None
What action is required: None
Should I cancel my outdoor plans? No
Sunset: 4:50 PM
Moonrise: 3:19 PM
The phase of the moon: Waxing Gibbous
Moonset: 2:31 AM
.
November 9, 2019
Saturday’s Forecast: Mostly sunny. Some passing clouds.
What is the chance of precipitation? MO ~ 0% IL ~ 0% KY ~ 0% TN ~ 0%
How confident am I that this forecast will verify: High (80% confidence in the forecast)
Temperature range: MO Bootheel 52° to 54° SE MO 50° to 54° South IL 48° to 52° Northwest KY (near Indiana border) 48° to 52° West KY 48° to 52° NW TN 50° to 52°
Wind direction and speed: Becoming southwest at 5 to 10 mph.
Wind chill or heat index (feels like) temperature forecast: 48° to 52°
Coverage of precipitation: None
What impacts are anticipated from the weather? None
What action is required: None
Should I cancel my outdoor plans? No
UV Index: 5 Moderate
Sunrise: 6:28 AM
.
Saturday night Forecast: A few clouds. Not as cold. Patchy fog.
What is the chance of precipitation? MO ~ 0% IL ~ 0% KY ~ 0% TN ~ 0%
How confident am I that this forecast will verify: Medium (60% confidence in the forecast)
Temperature range: MO Bootheel 34° to 38° SE MO 34° to 38° South IL 34° to 38° Northwest KY (near Indiana border) 34° to 38° West KY 34° to 38° NW TN 35° to 40°
Wind direction and speed: Southwest at 4 to 8 mph.
Wind chill or heat index (feels like) temperature forecast: 30° to 35°
Coverage of precipitation: None
What impacts are anticipated from the weather? None
What action is required: None
Should I cancel my outdoor plans? No
Sunset: 4:49 PM
Moonrise: 3:45 PM
The phase of the moon: Waxing Gibbous
Moonset: 3:28 AM
.
November 10, 2019
Sunday’s Forecast: Mostly sunny. Some high clouds moving in during the afternoon.
What is the chance of precipitation? MO ~ 0% IL ~ 0% KY ~ 0% TN ~ 0%
How confident am I that this forecast will verify: High (70% confidence in the forecast)
Temperature range: MO Bootheel 60° to 64° SE MO 58° to 62° South IL 58° to 62° Northwest KY (near Indiana border) 58° to 62° West KY 58° to 62° NW TN 58° to 62°
Wind direction and speed: Becoming southwest at 7 to 14 mph.
Wind chill or heat index (feels like) temperature forecast: 58° to 62°
Coverage of precipitation: Most likely none.
What impacts are anticipated from the weather? None
What action is required: None
Should I cancel my outdoor plans? No
UV Index: 4 Moderate
Sunrise: 6:29 AM
.
Sunday night Forecast: Increasing clouds overnight. A chance of a shower over southeast Missouri and southern Illinois. Lesser chances over Kentucky and Tennessee.
What is the chance of precipitation? MO ~ 30% IL ~ 30% KY ~ 20% TN ~ 20%
How confident am I that this forecast will verify: Medium (40% confidence in the forecast)
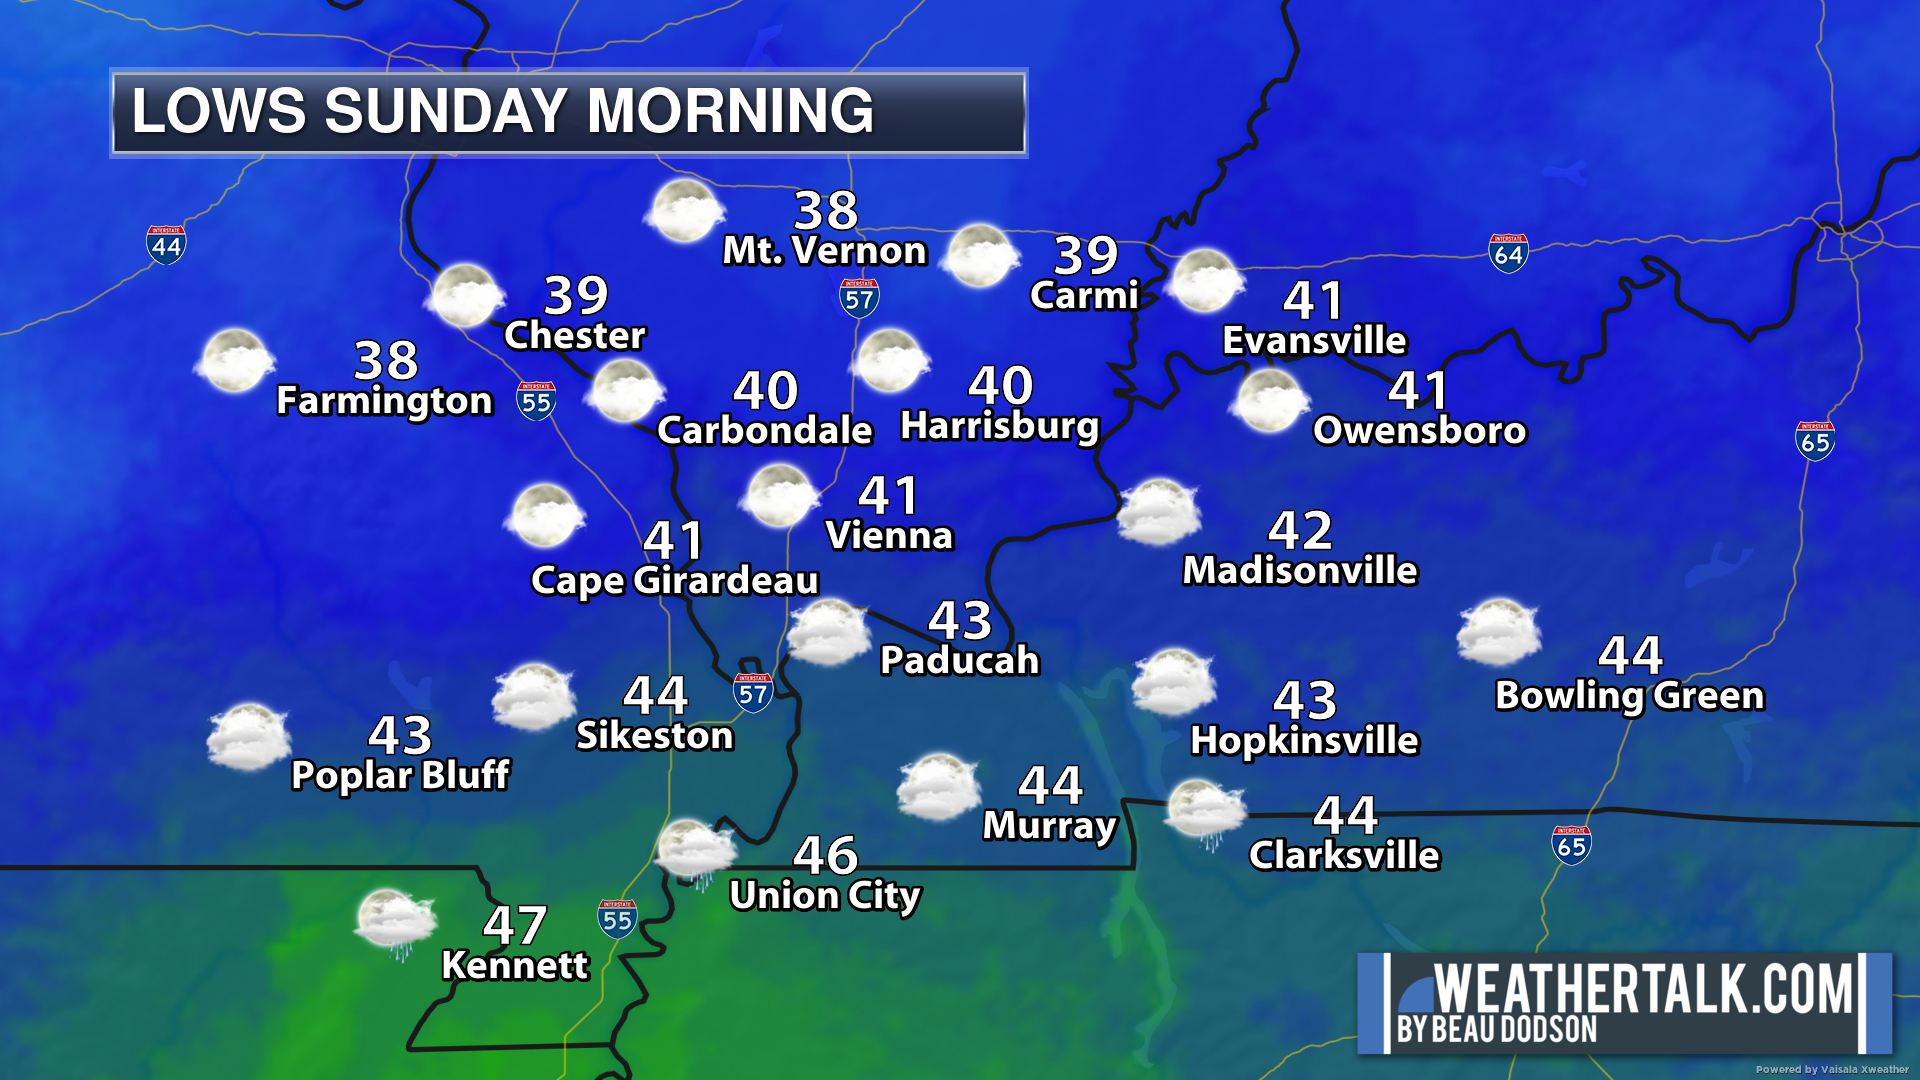
Temperature range: MO Bootheel 34° to 38° SE MO 34° to 38° South IL 34° to 36° Northwest KY (near Indiana border) 34° to 36° West KY 34° to 38° NW TN 36° to 38°
Wind direction and speed: South wind becoming north at 7 to 14 mph.
Wind chill or heat index (feels like) temperature forecast: 30° to 40°
Coverage of precipitation: Isolated
What impacts are anticipated from the weather? Isolated wet roadways.
What action is required: None.
Should I cancel my outdoor plans? No
Sunset: 4:48 PM
Moonrise: 4:12 PM
The phase of the moon: Waxing Gibbous
Moonset: 4:25 AM
.
November 11, 2019
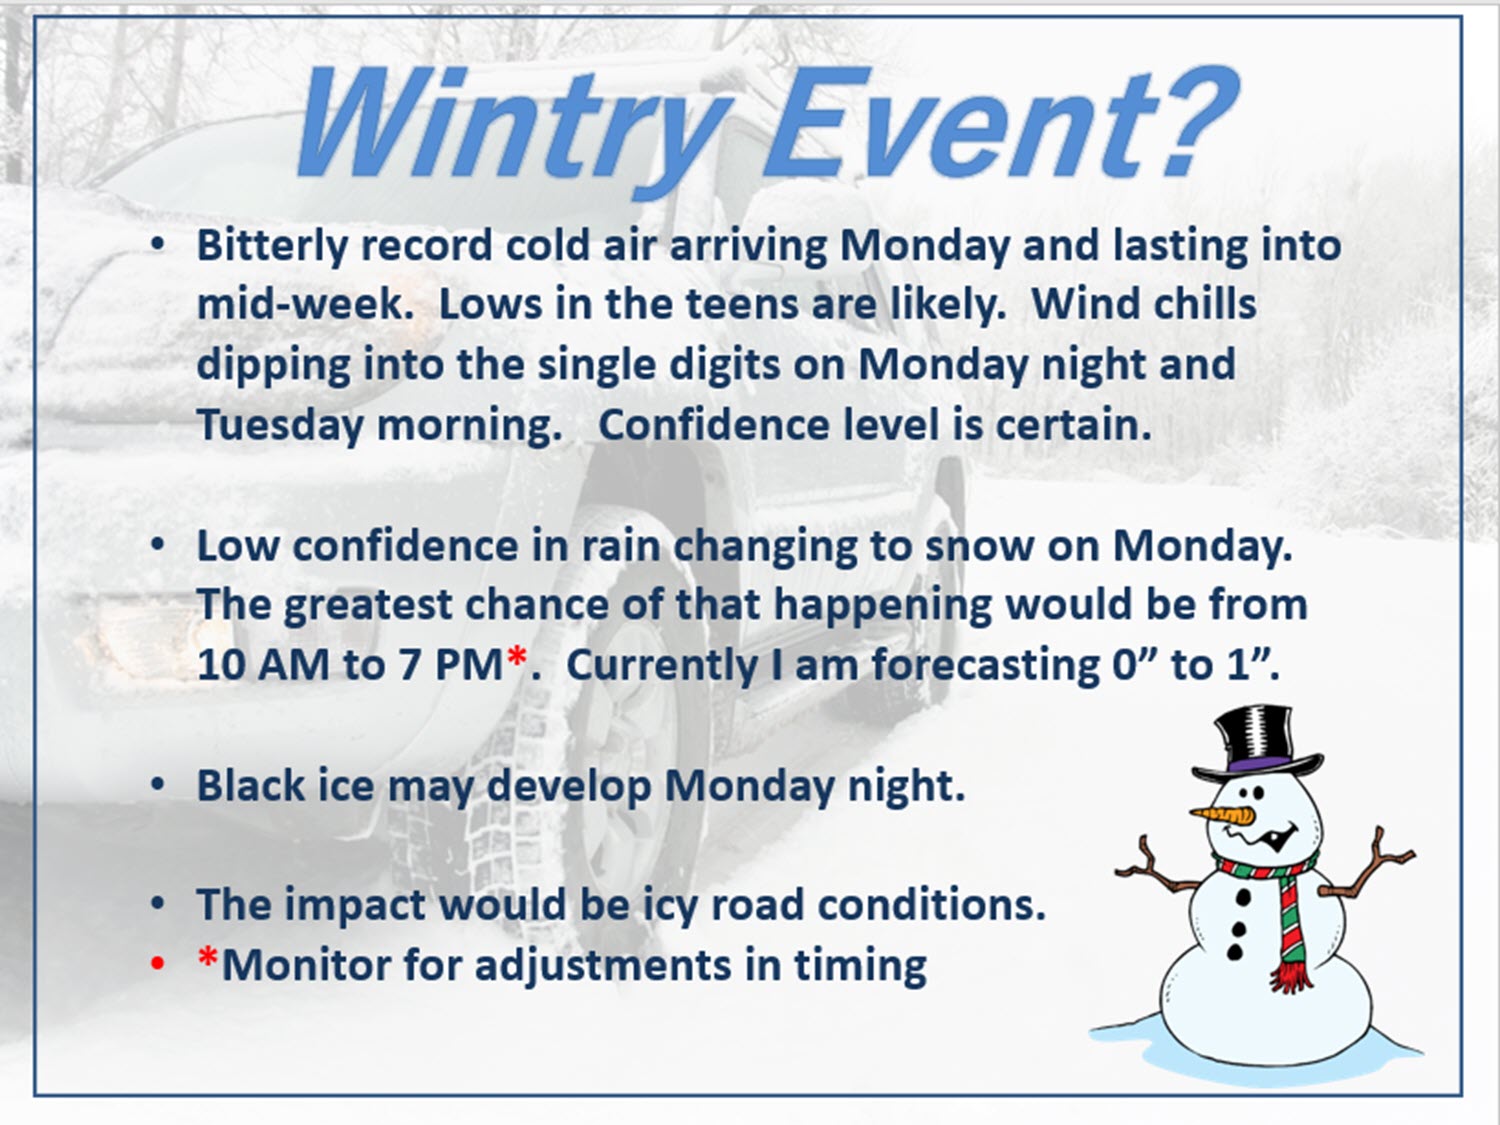
Monday’s Forecast: Mostly cloudy with rain and snow showers developing. Turning colder. Temperatures falling during the day. Windy. Snow accumulation Monday into Monday night of 0″ to 1″.
What is the chance of precipitation? MO ~ 50% to 60% IL ~ 50% to 60% KY ~ 60% TN ~ 60%
How confident am I that this forecast will verify: High (70% confidence in the forecast)
Temperature range: MO Bootheel 36° to 40° SE MO 36° to 40° South IL 35° to 40° Northwest KY (near Indiana border) 36° to 40° West KY 36° to 40° NW TN 38° to 42°
Wind direction and speed: North 10 to 20 mph.
Wind chill or heat index (feels like) temperature forecast: 25° to 35°
Coverage of precipitation: Scattered to perhaps numerous.
What impacts are anticipated from the weather? Wet roadways.
What action is required: Slow your vehicle down on wet roadways.
Should I cancel my outdoor plans? Have a plan B.
UV Index: 2 Low.
Sunrise: 6:30 AM
.
Monday night Forecast: Cloudy early. A chance of snow in the evening. Colder. Bitterly cold wind chills could dip into the single digits late Monday night. Gusty winds.
What is the chance of precipitation? MO ~ 30% IL ~ 30% KY ~ 40% TN ~ 40%
How confident am I that this forecast will verify: Medium (60% confidence in the forecast)
Temperature range: MO Bootheel 16° to 20° SE MO 14° to 18° South IL 14° to 18° Northwest KY (near Indiana border) 15° to 20° West KY 15° to 20° NW TN 15° to 20°
Wind direction and speed: North 8 to 16 mph.
Wind chill or heat index (feels like) temperature forecast: 8° to 16°
Coverage of precipitation: Monitor. Scattered.
What impacts are anticipated from the weather? Lower visibility if fog forms. Slick roads if snow or black ice develops.
What action is required: Slow your vehicle in areas of fog and possibly snow. Black ice is possible.
Should I cancel my outdoor plans? Have a plan B.
Sunset: 4:48 PM
Moonrise: 4:41 PM
The phase of the moon: Waxing Gibbous
Moonset: 5:24 AM
.
Tuesday: Medium confidence. Clouds early in the day. Clearing. Sharply colder. High 25 to 30. Wind chill Tuesday morning of 5 to 15. Tuesday night: Mostly clear and cold. Low 15 to 20. Northwest wind 8 to 16 mph.
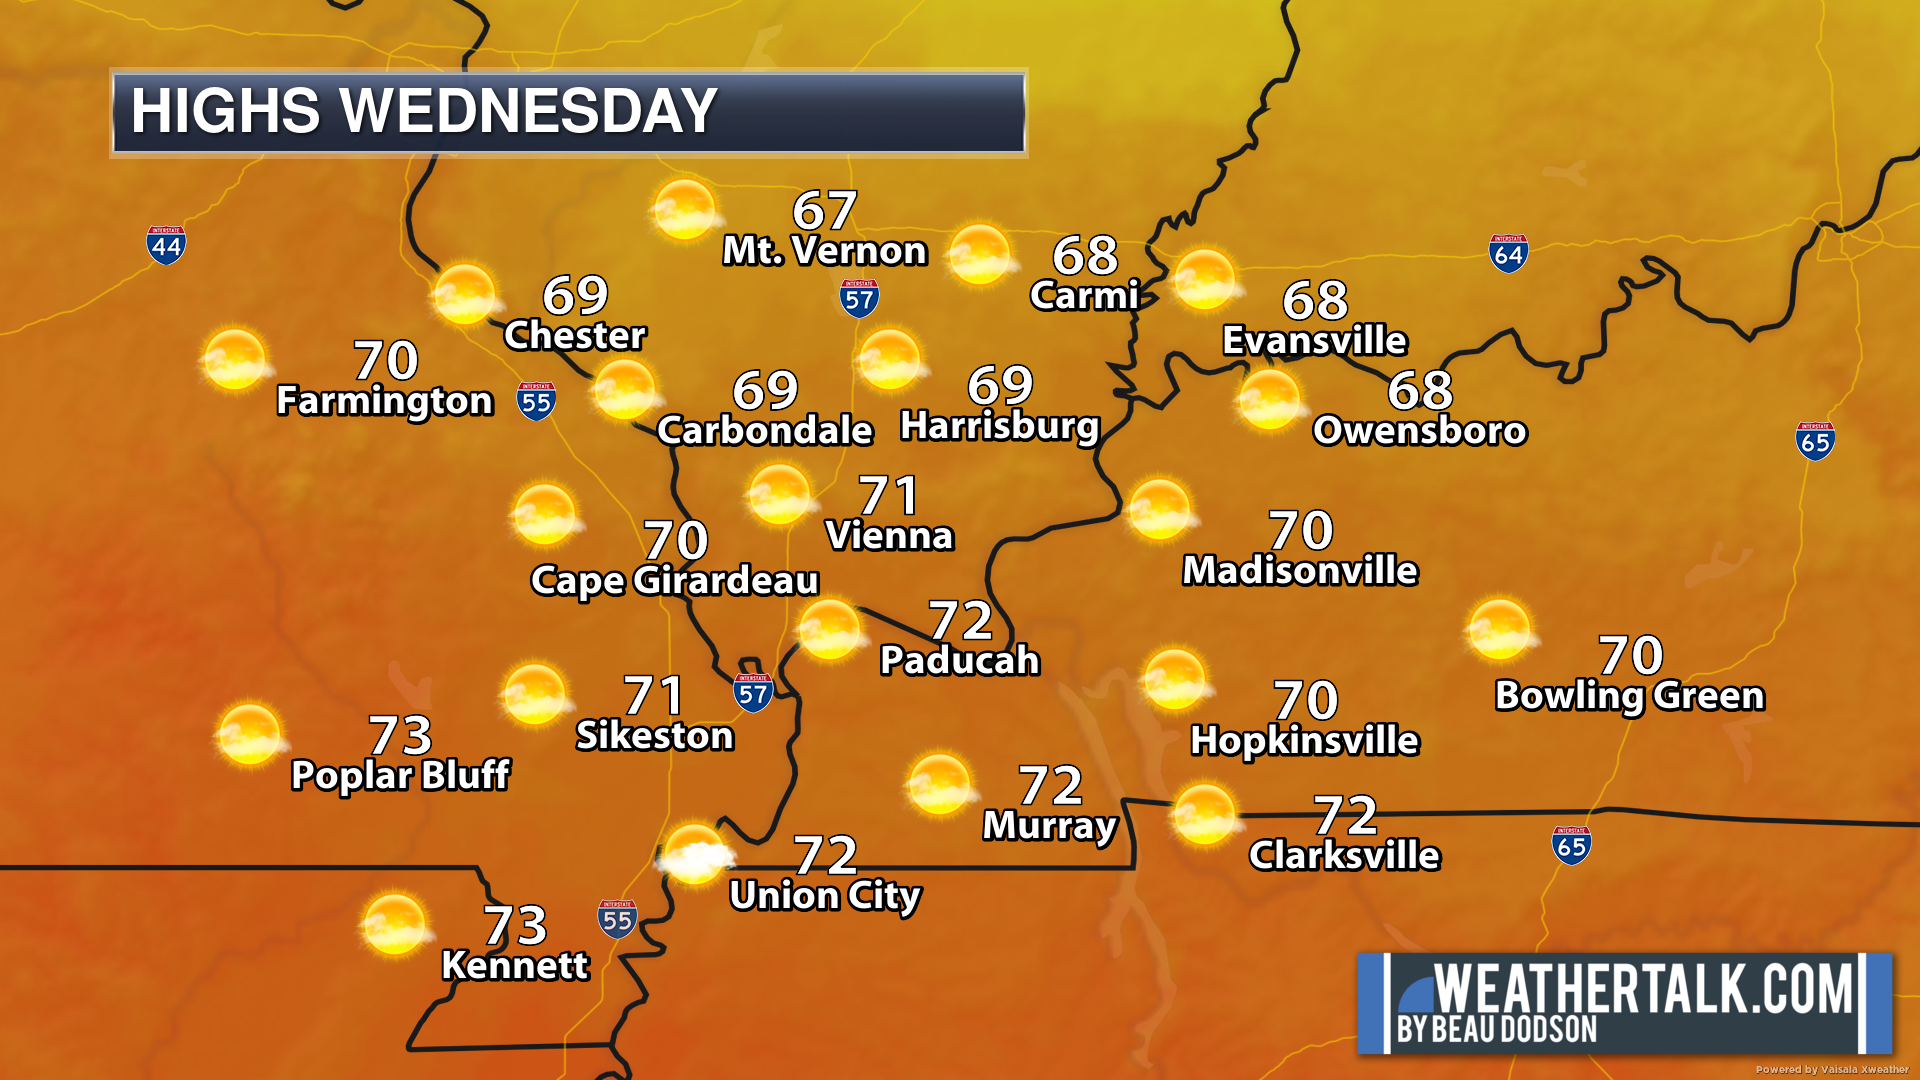
Wednesday: Low confidence. Partly cloudy. High 34 to 38. Wednesday night: Partly cloudy. Cold. Low 23 to 26. North wind 5 to 10 mph.
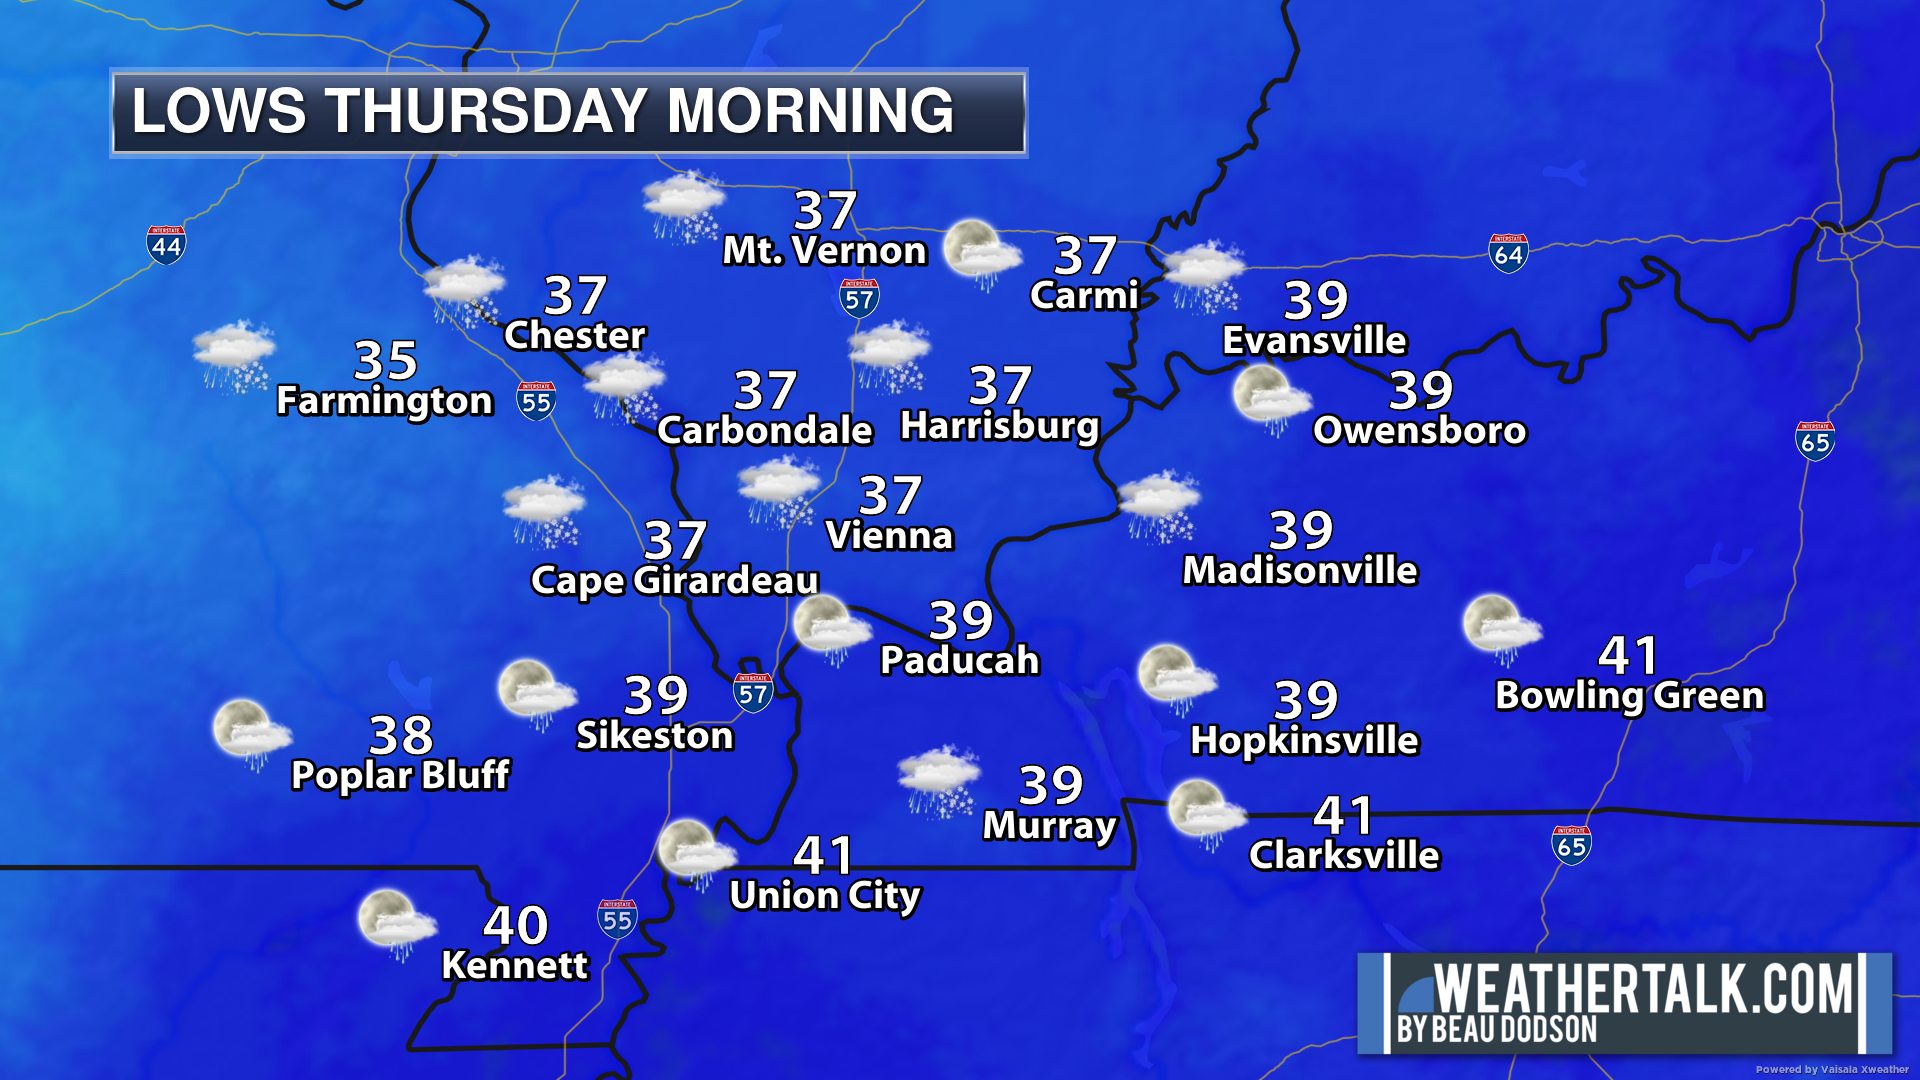
Thursday: Low confidence. Partly cloudy. A chance of rain or snow showers. High 43 to 46. Thursday night: Cloudy with a chance of rain or snow showers. Low 30 to 35. North wind 5 to 10 mph.
.
.
Learn more about the UV index readings. Click here.
Click to enlarge
.
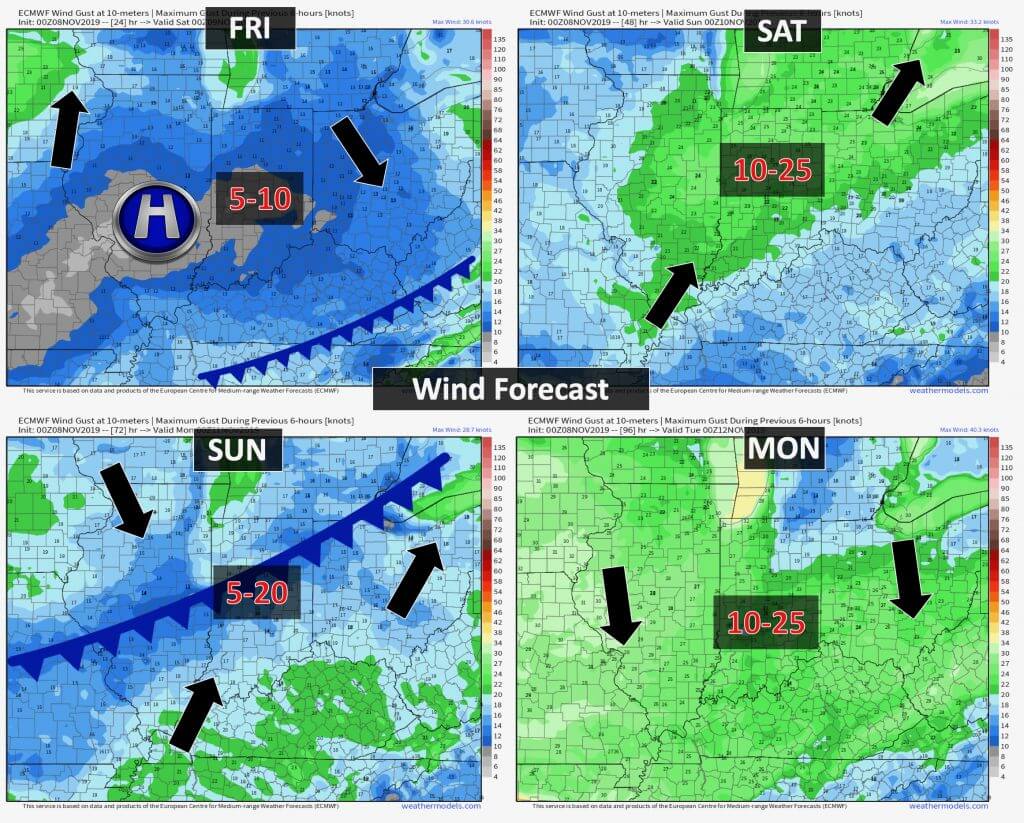
Wind forecast
Click the image to enlarge it.
.
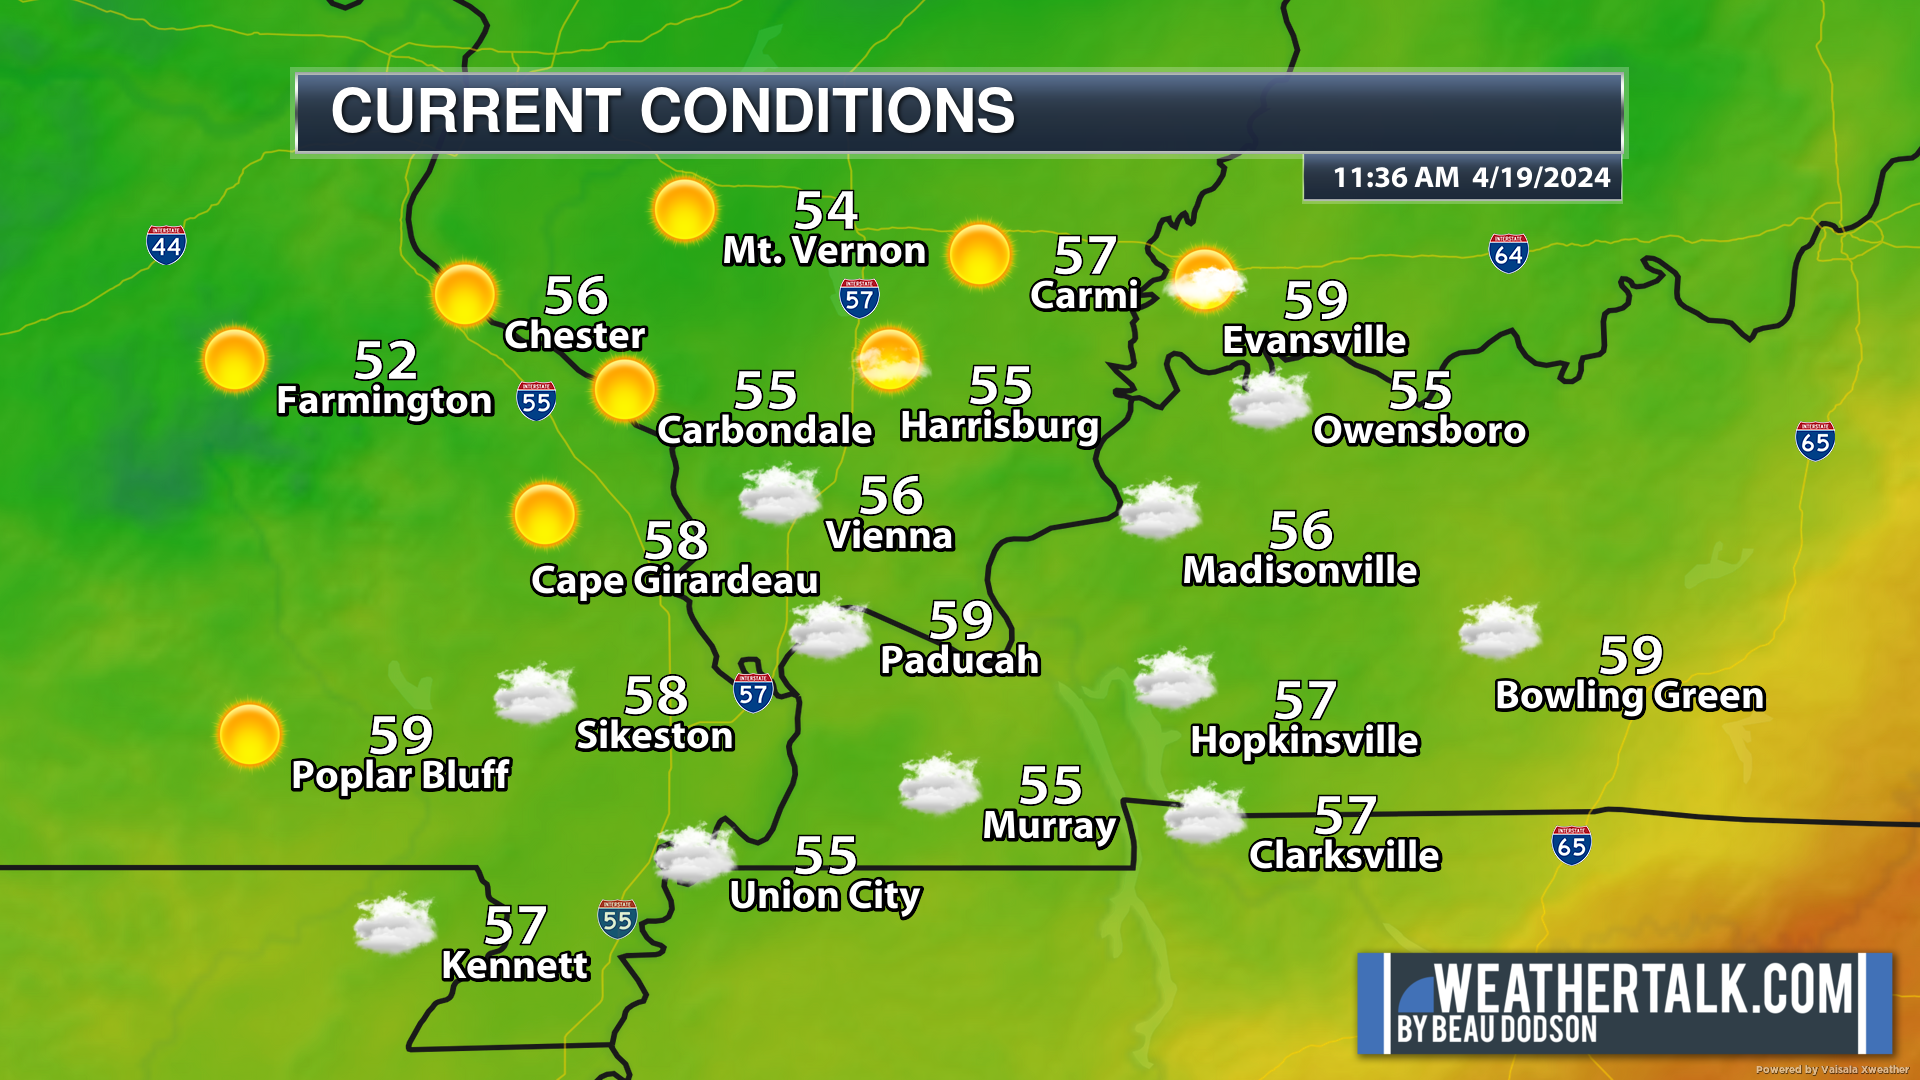
Current conditions.
.
School Bus Stop Forecast
Friday
.

.
- Dry today into Sunday afternoon..
- Cold Friday.
- Small warming trend on Sunday with upper 50s to lower 60s.
- Strong cold front late Sunday night into Monday. Perhaps some rain changing to snow.
- Cold temperatures on Monday night into Thursday. Low wind chills.
Agriculture Forecast
Spray forecast will return next spring.
I will introduce a winter graphic soon for temperatures and livestock.
.
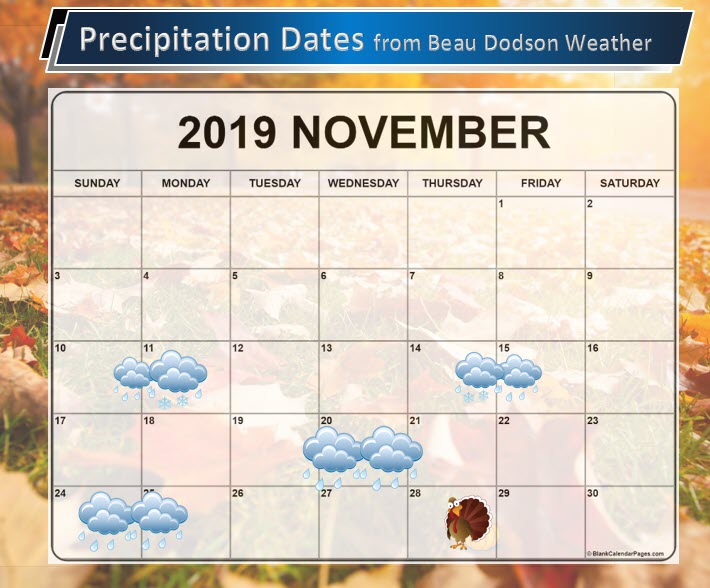
Precipitation Dates.
These are dates that could have precipitation. Monitor the trends in the forecast.
Anything past day seven is very low confidence. Do not make plans based on this forecast.
Smaller icons mean that confidence in precipitation occurring is low or it will be light.
Larger icons mean a higher chance of precipitation occurring.
.
![]()
![]()
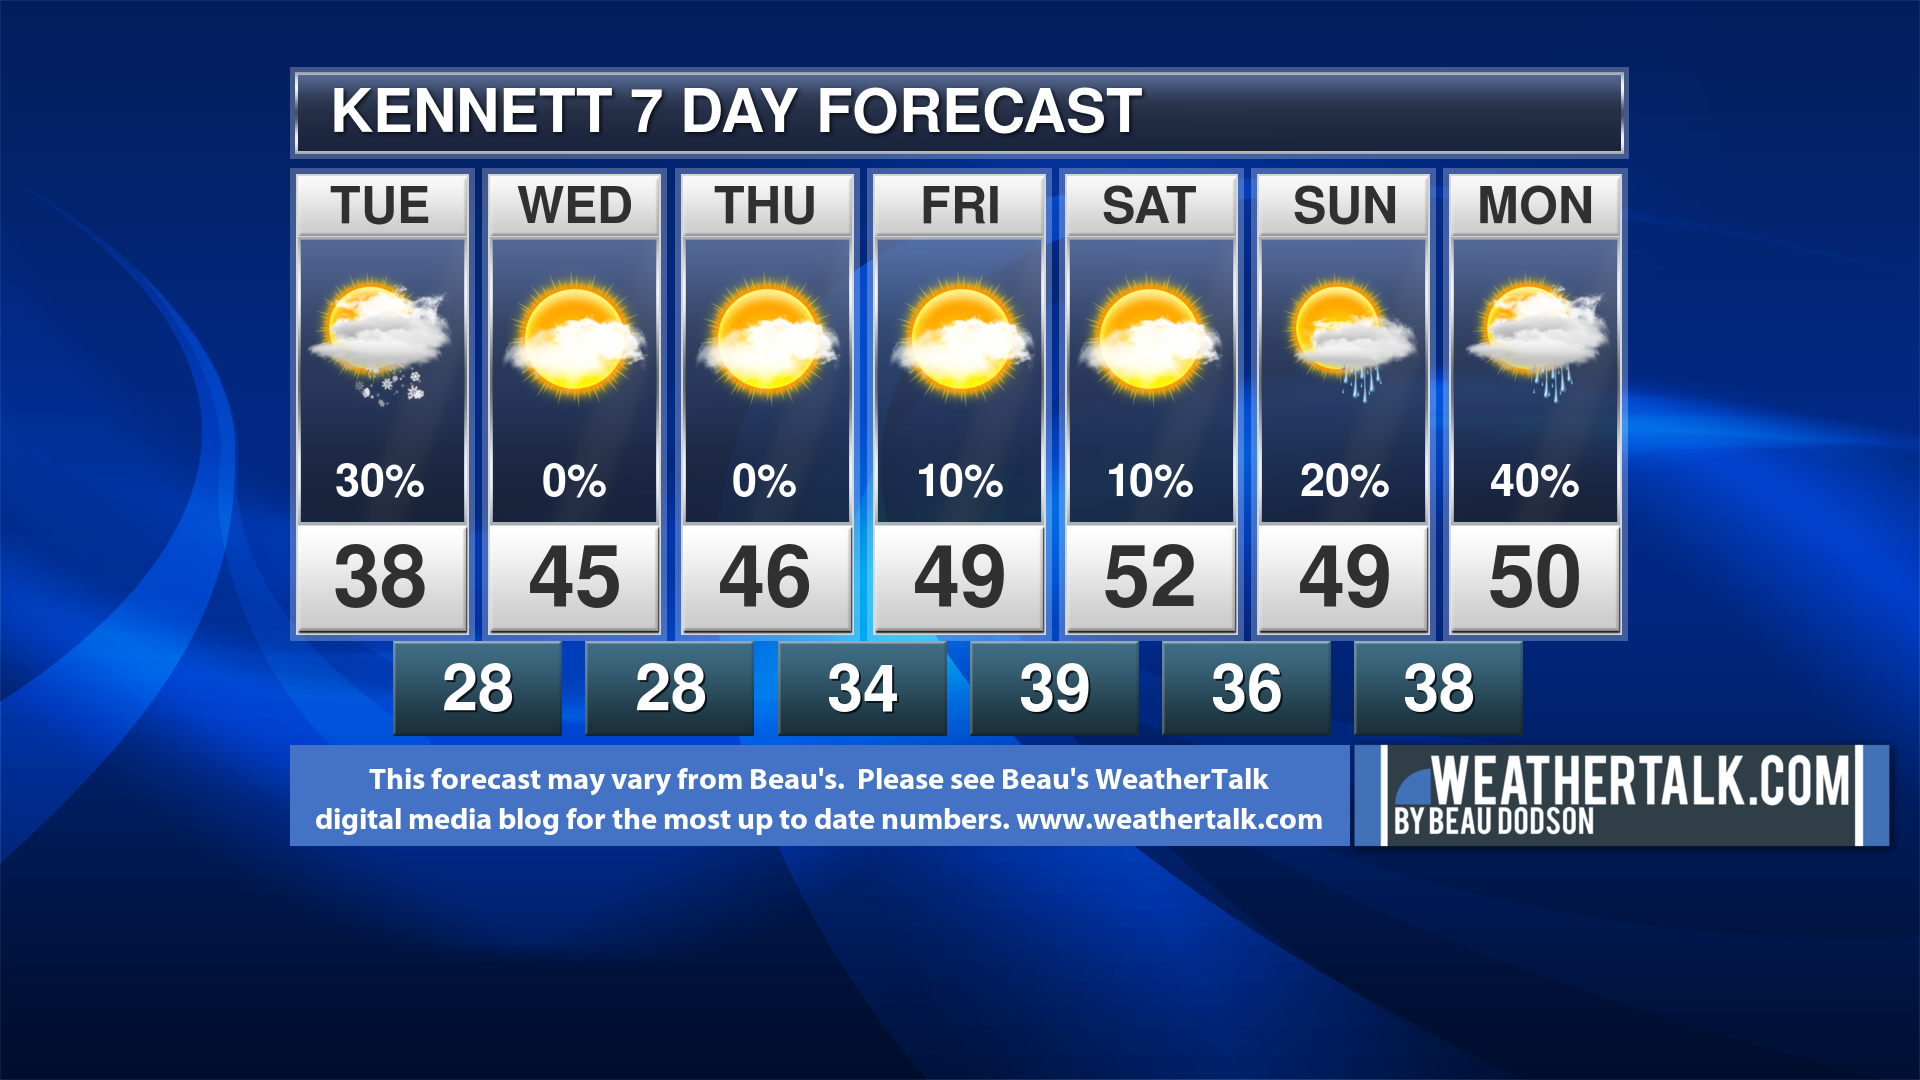
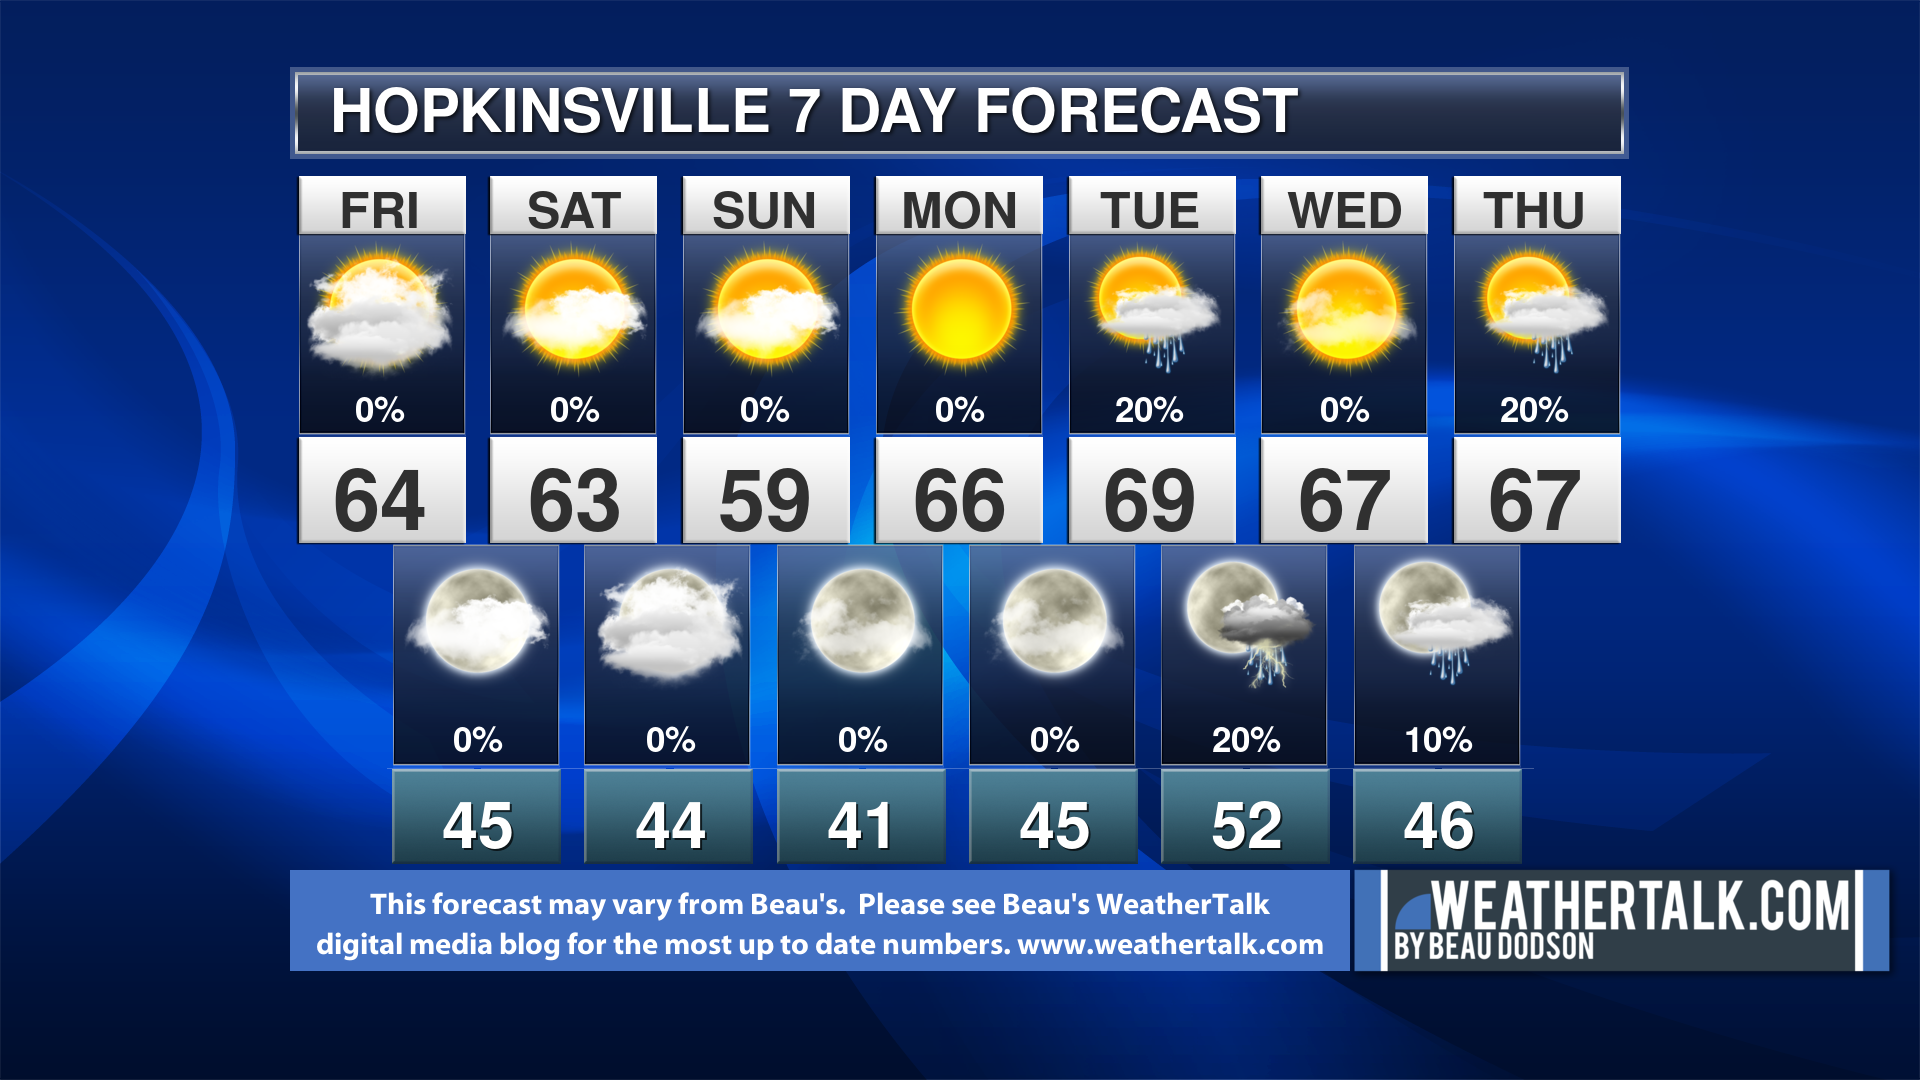
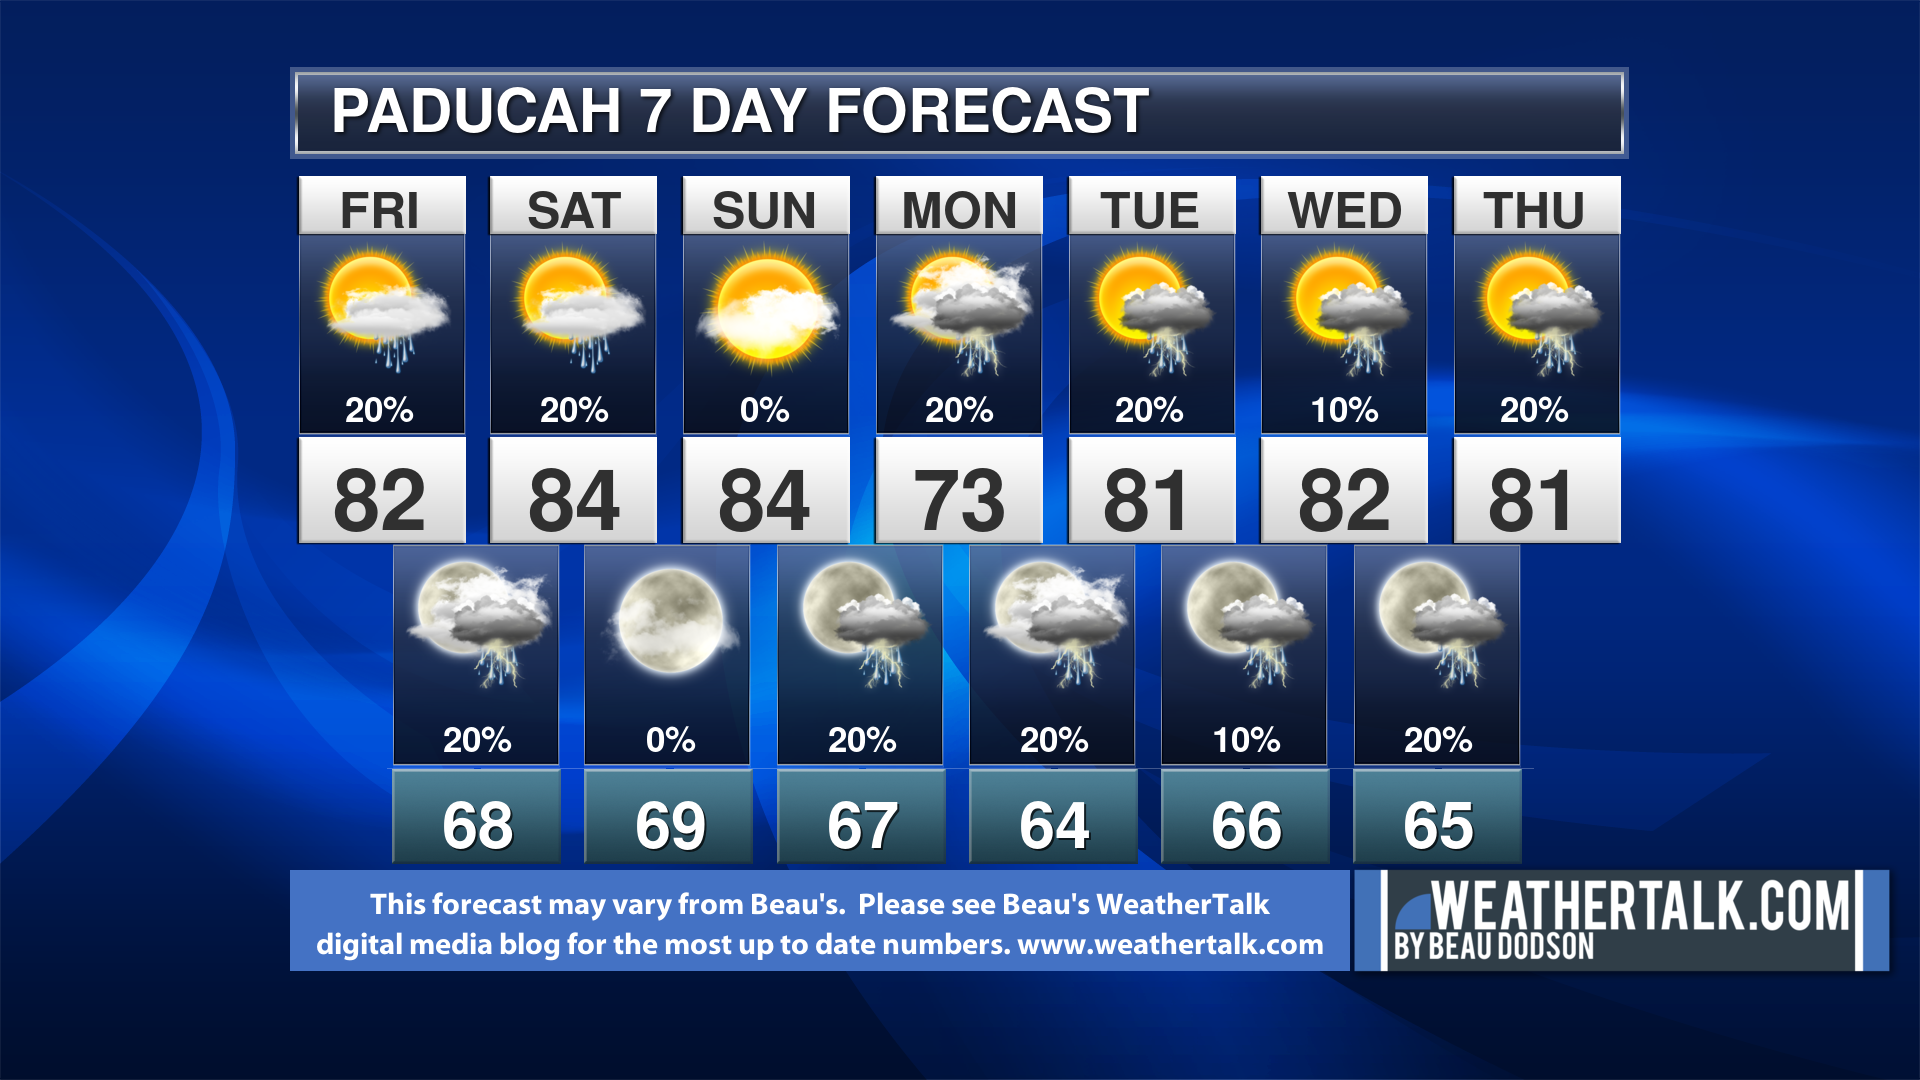
Graphic-cast
Click here if you would like to return to the top of the page.
** These graphic-forecasts may vary a bit from my forecast above **
CAUTION: I have these graphics set to auto-update on their own. Make sure you read my hand-typed forecast above.
During active weather check my handwritten forecast.
Missouri
** These graphic-forecasts may vary a bit from my forecast above **
CAUTION: I have these graphics set to auto-update on their own. Make sure you read my hand-typed forecast above.
During active weather check my handwritten forecast.

.
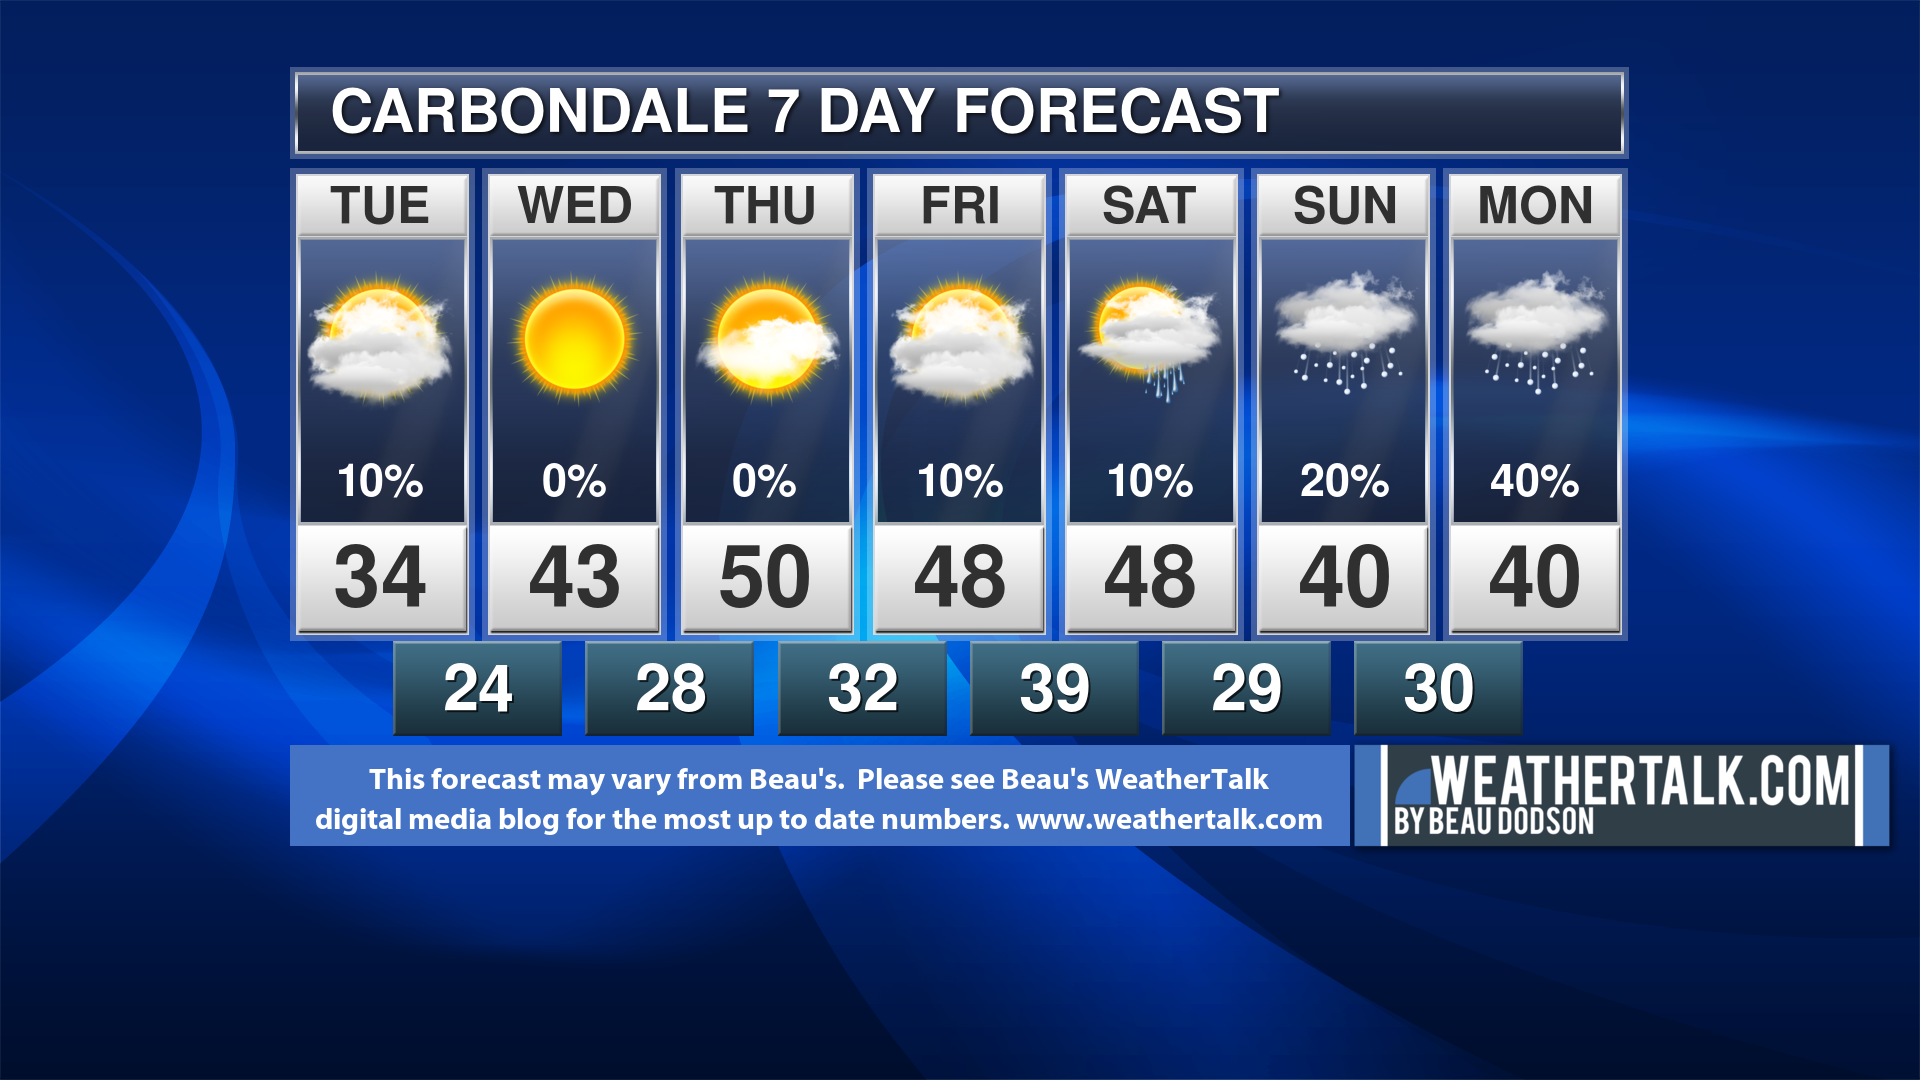
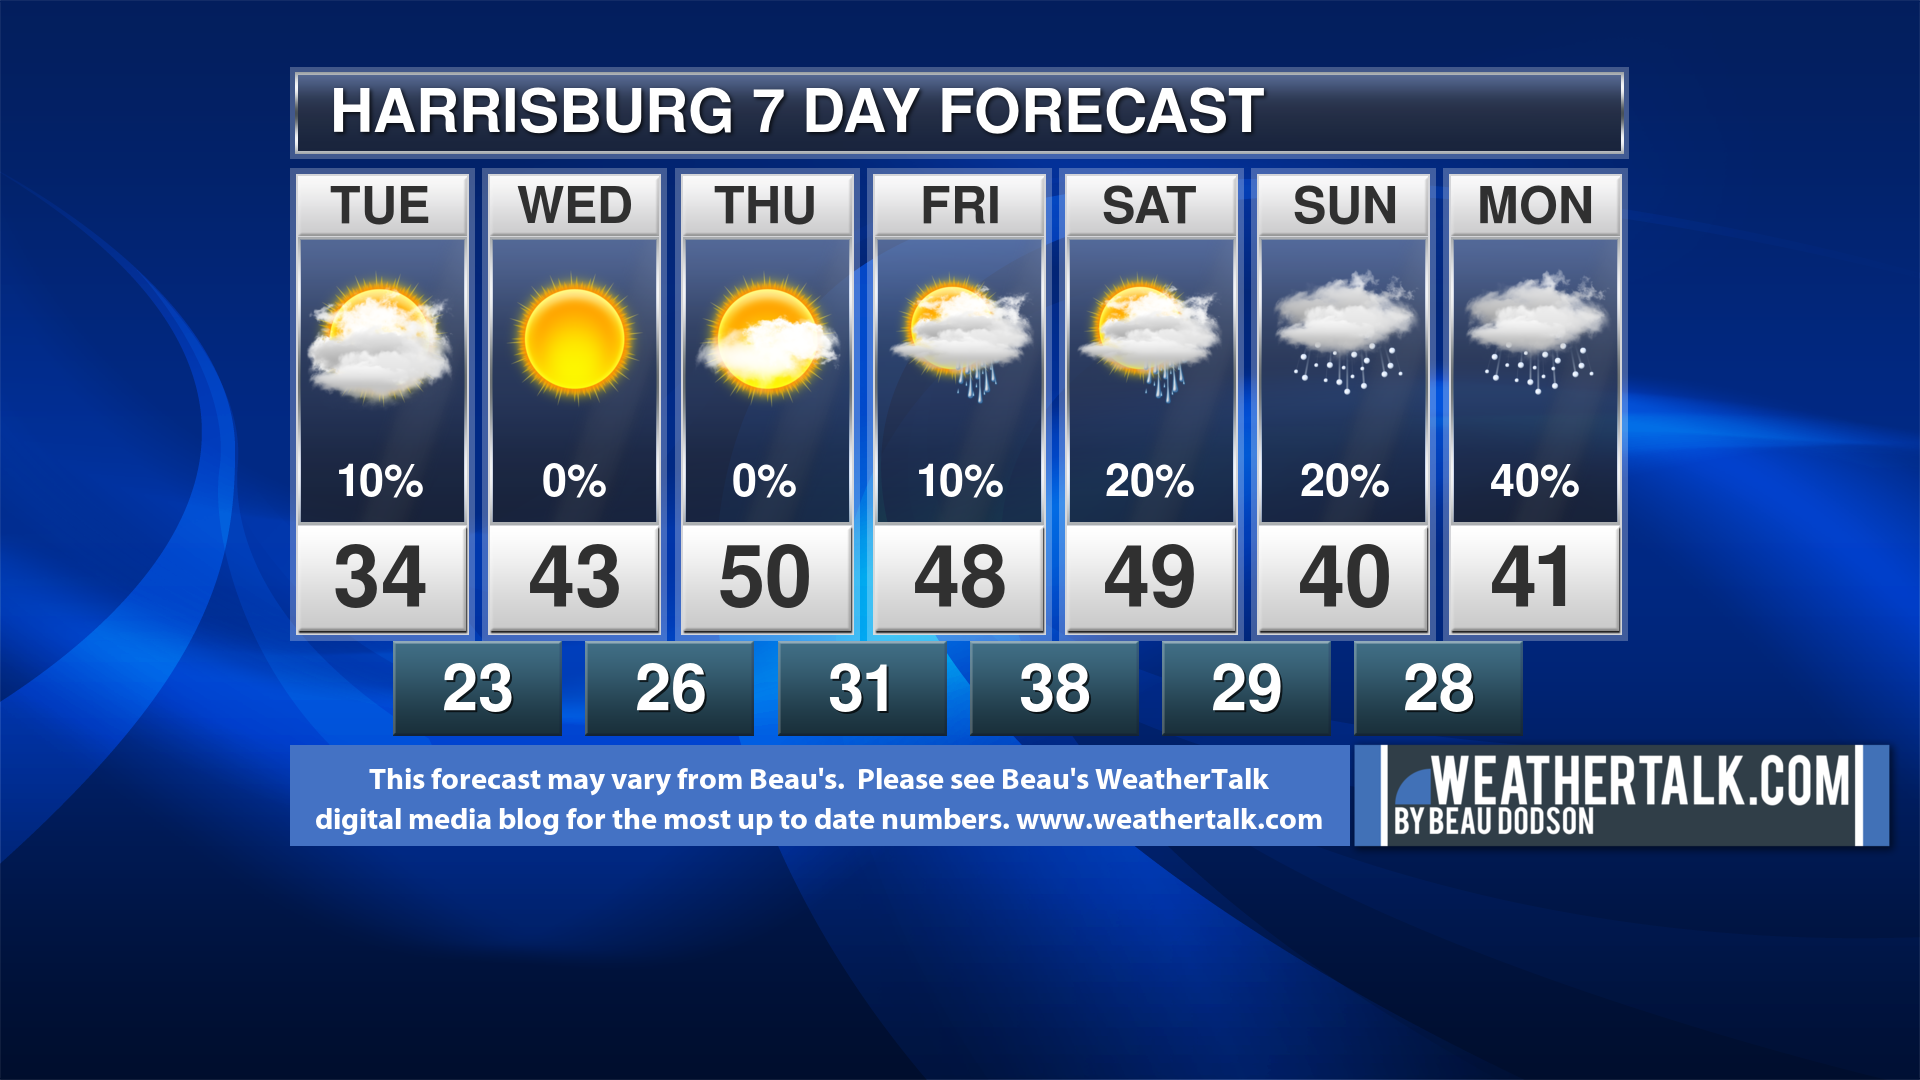
Illinois
** These graphic-forecasts may vary a bit from my forecast above **
CAUTION: I have these graphics set to auto-update on their own. Make sure you read my hand-typed forecast above.
During active weather check my handwritten forecast.

** These graphic-forecasts may vary a bit from my forecast above **
CAUTION: I have these graphics set to auto-update on their own. Make sure you read my hand-typed forecast above.
During active weather check my handwritten forecast.
** These graphic-forecasts may vary a bit from my forecast above **
CAUTION: I have these graphics set to auto-update on their own. Make sure you read my hand-typed forecast above.
During active weather check my handwritten forecast.
** These graphic-forecasts may vary a bit from my forecast above **
CAUTION: I have these graphics set to auto-update on their own. Make sure you read my hand-typed forecast above.
During active weather check my handwritten forecast.

.
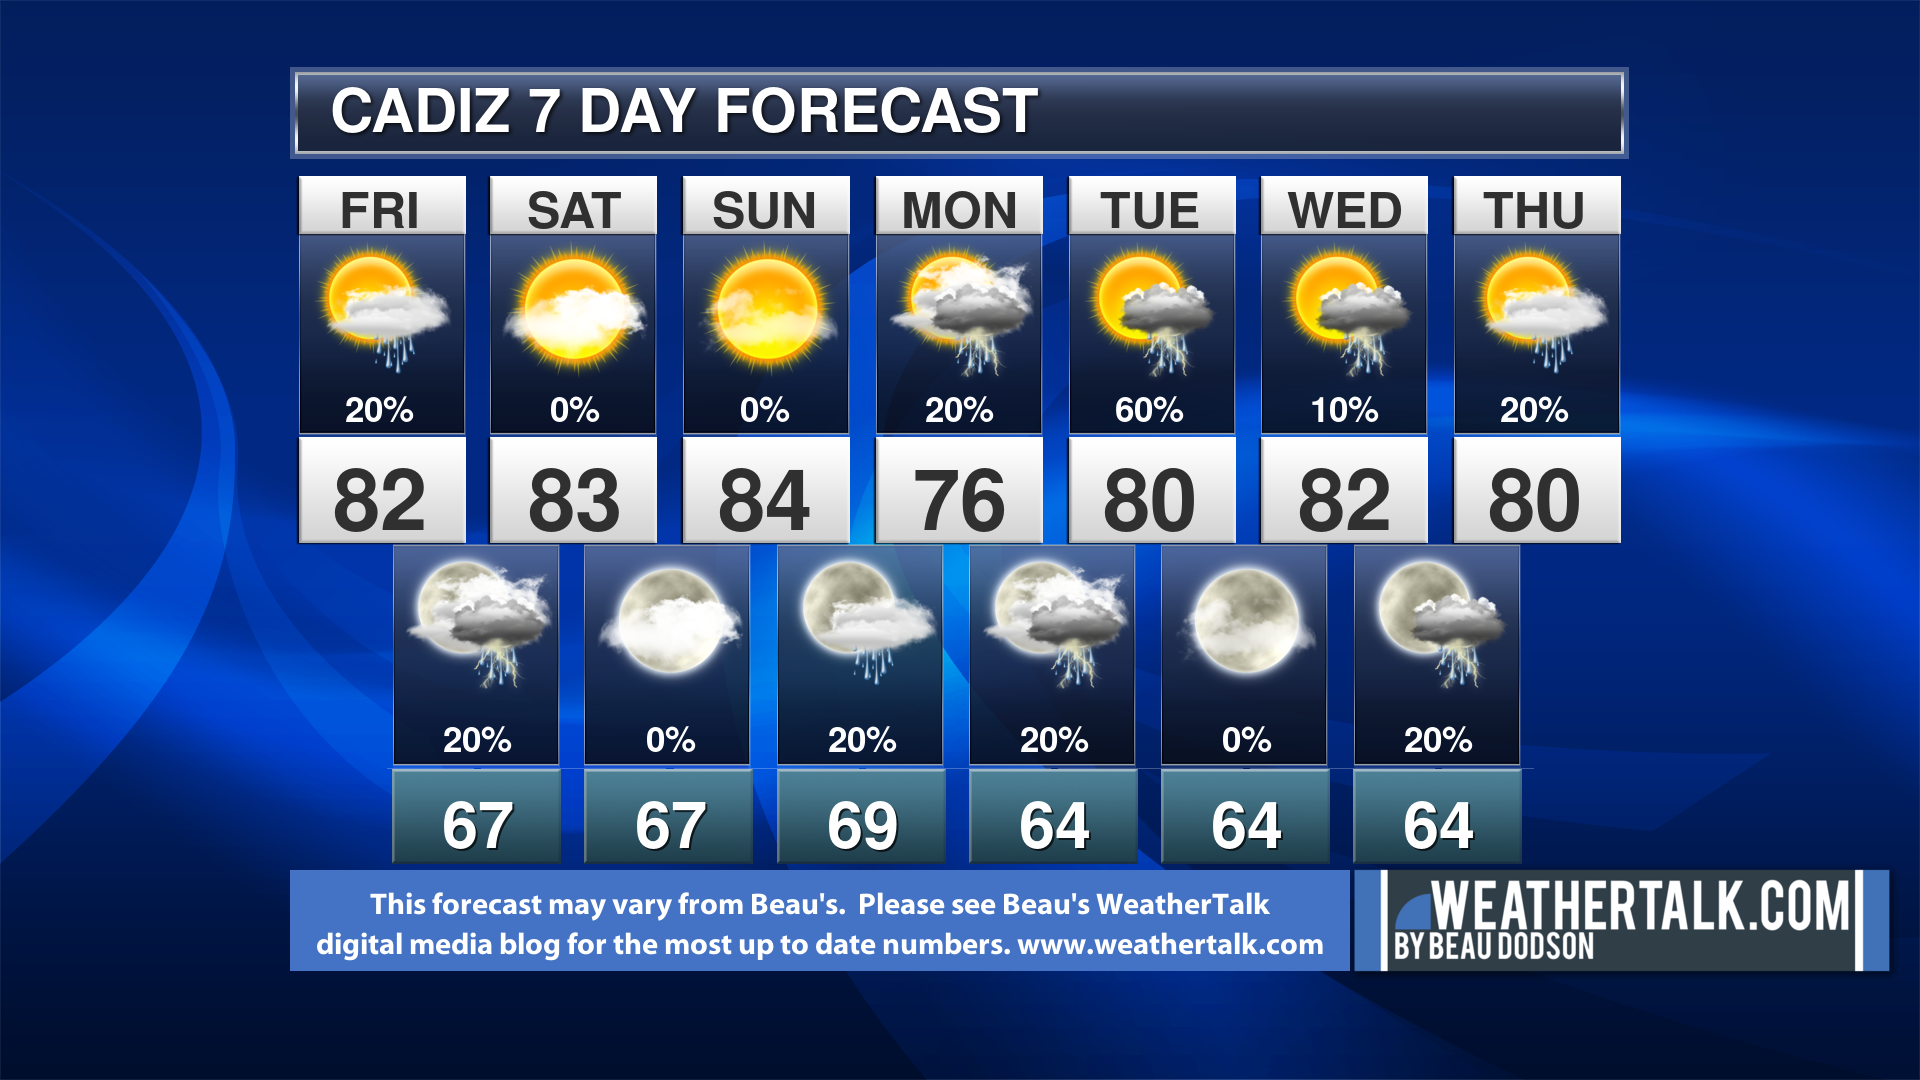
Kentucky
** These graphic-forecasts may vary a bit from my forecast above **
CAUTION: I have these graphics set to auto-update on their own. Make sure you read my hand-typed forecast above.
During active weather check my handwritten forecast.
** These graphic-forecasts may vary a bit from my forecast above **
CAUTION: I have these graphics set to auto-update on their own. Make sure you read my hand-typed forecast above.
During active weather check my handwritten forecast.
** These graphic-forecasts may vary a bit from my forecast above **
CAUTION: I have these graphics set to auto-update on their own. Make sure you read my hand-typed forecast above.
During active weather check my handwritten forecast.

** These graphic-forecasts may vary a bit from my forecast above **
CAUTION: I have these graphics set to auto-update on their own. Make sure you read my hand-typed forecast above.
During active weather check my handwritten forecast.

** These graphic-forecasts may vary a bit from my forecast above **
CAUTION: I have these graphics set to auto-update on their own. Make sure you read my hand-typed forecast above.
During active weather check my handwritten forecast.
.
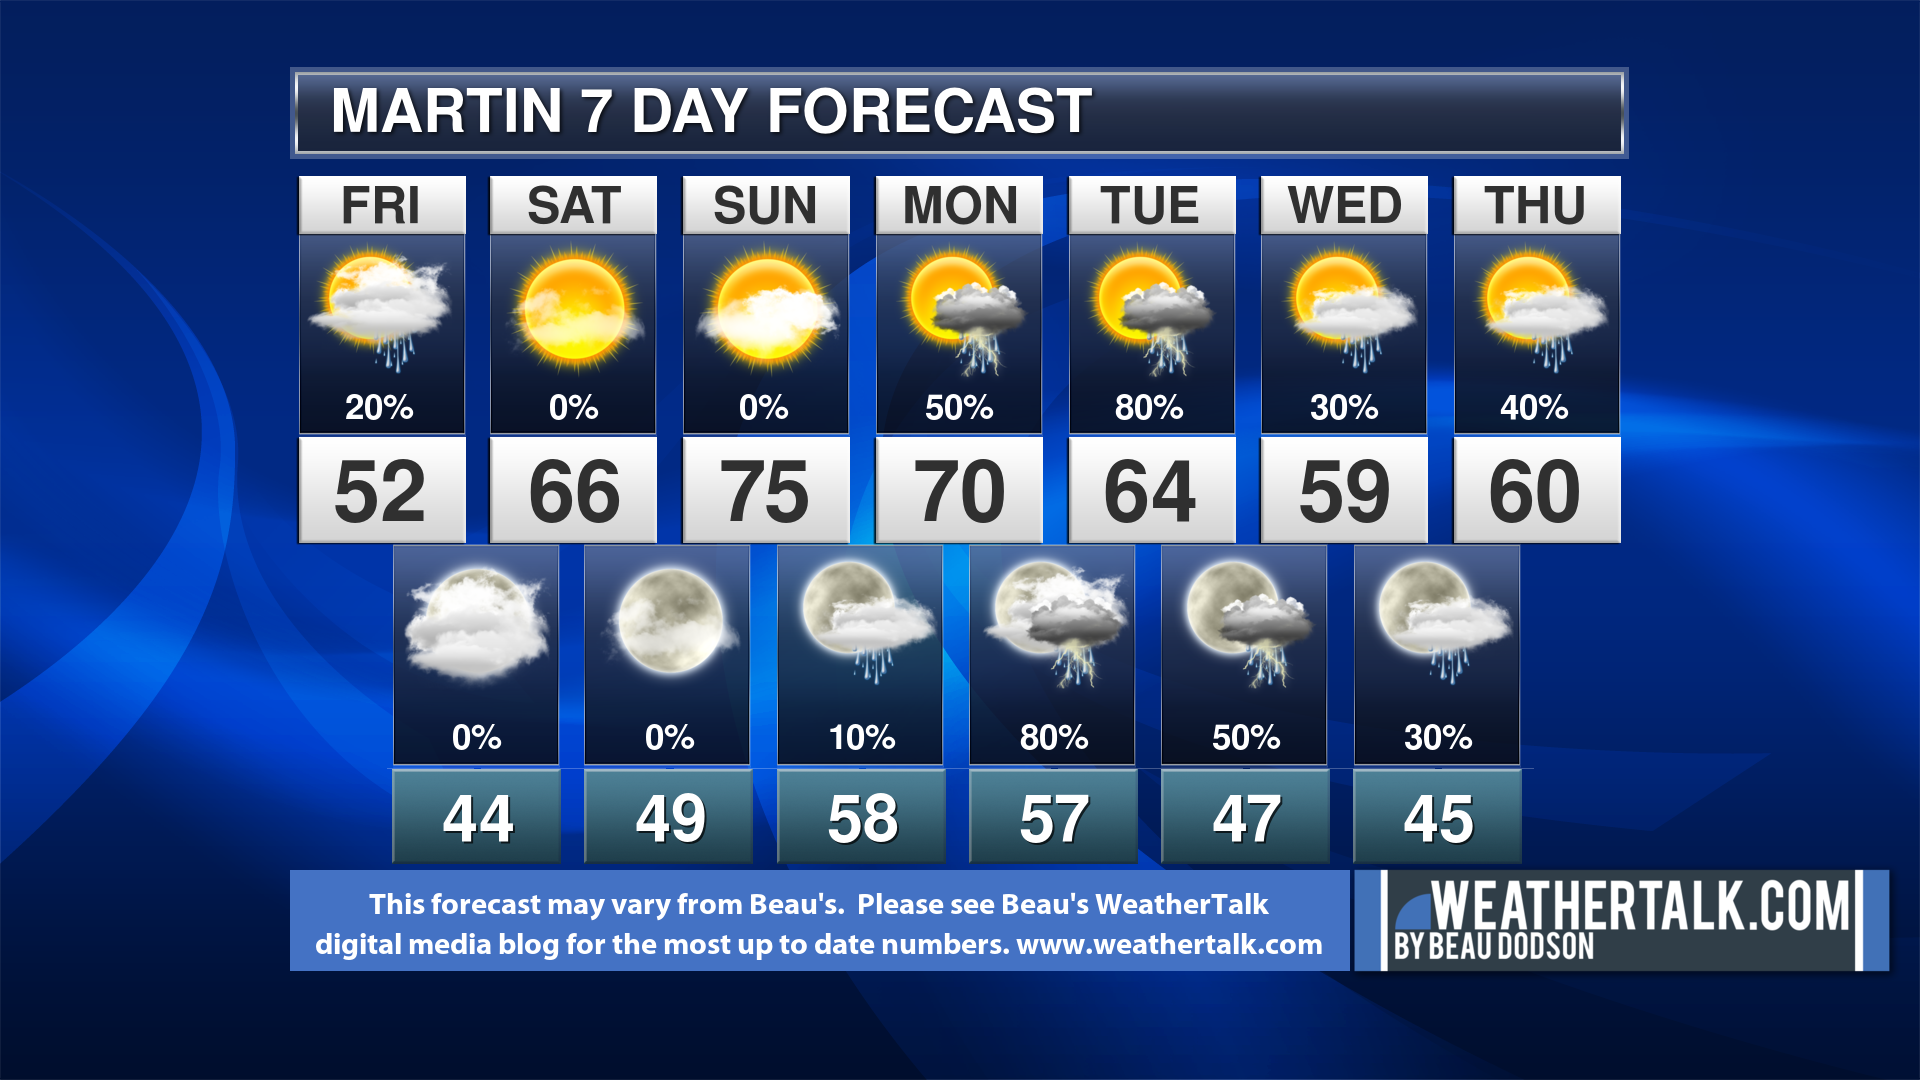
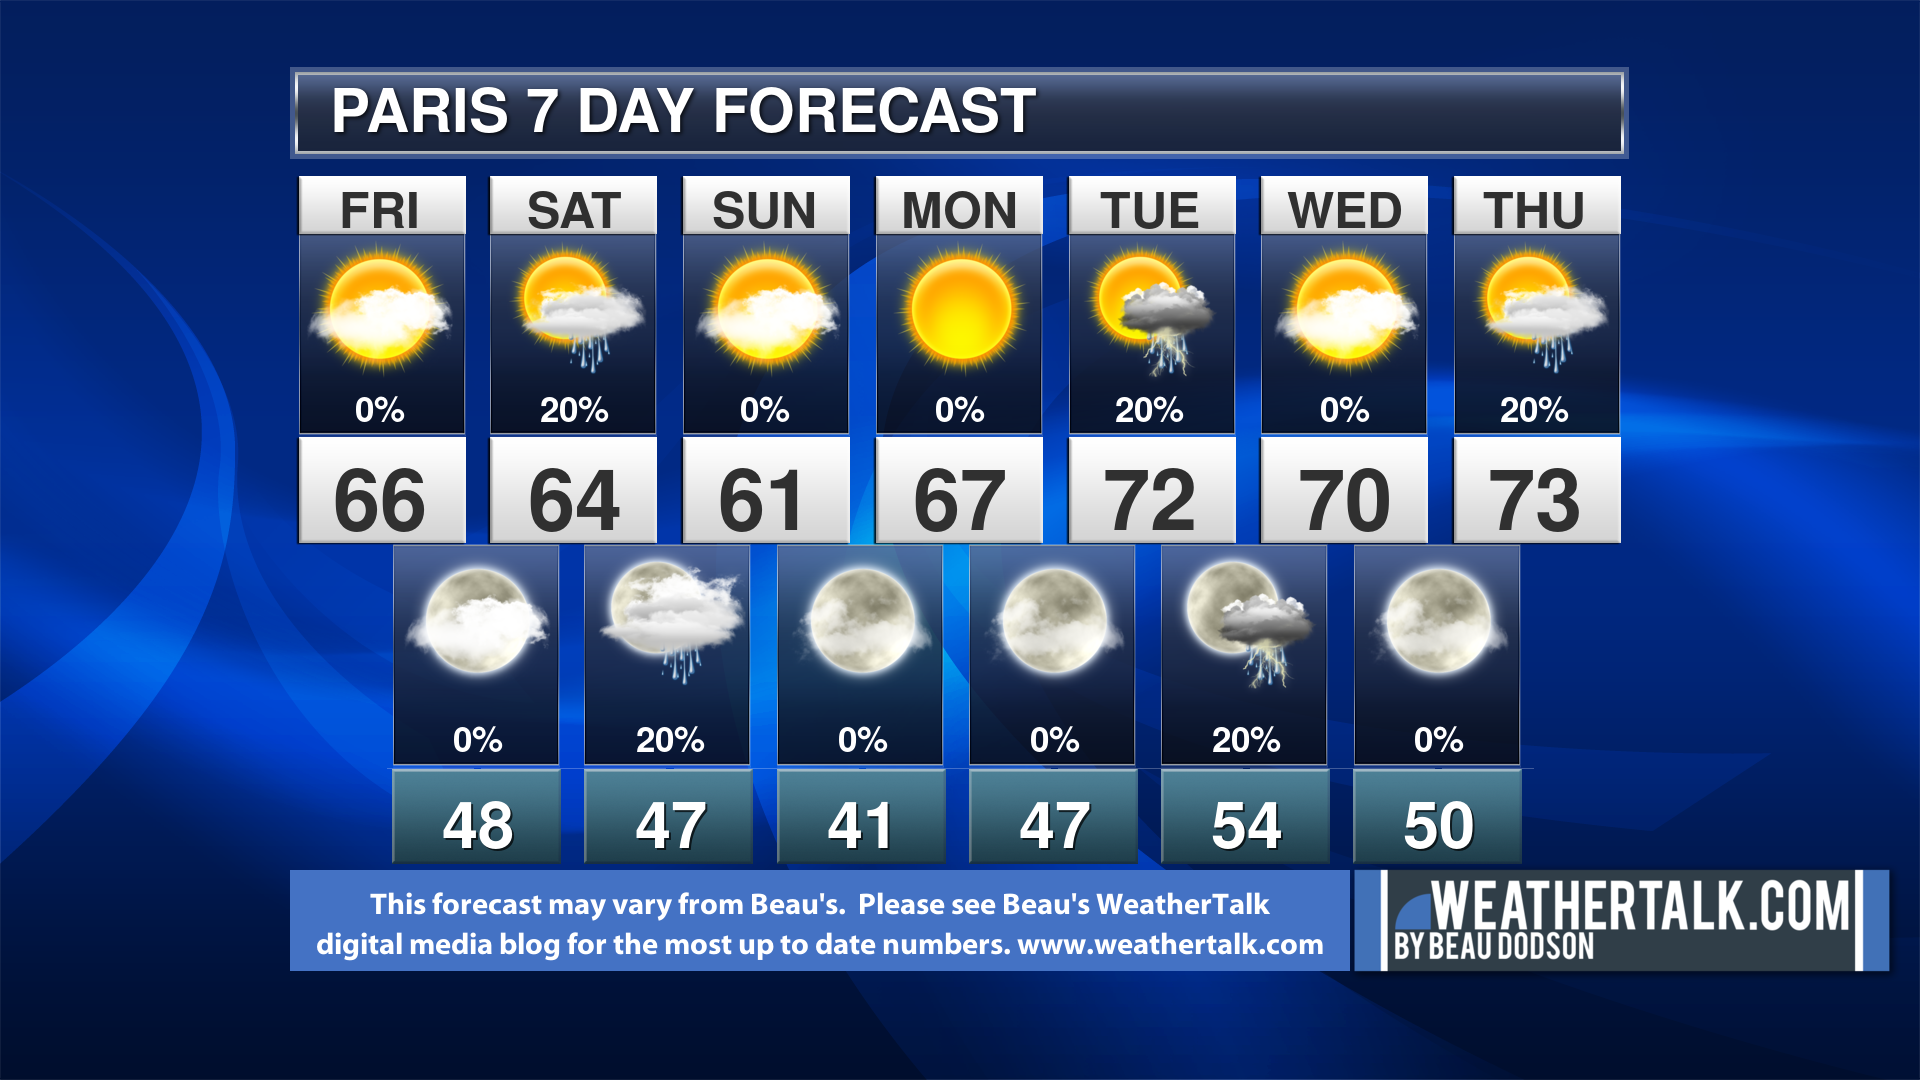
Tennessee
** These graphic-forecasts may vary a bit from my forecast above **
CAUTION: I have these graphics set to auto-update on their own. Make sure you read my hand-typed forecast above.
During active weather check my handwritten forecast.
** These graphic-forecasts may vary a bit from my forecast above **
CAUTION: I have these graphics set to auto-update on their own. Make sure you read my hand-typed forecast above.
During active weather check my handwritten forecast.
.
Tuesday through next Thursday: No severe weather.
.
October and November weather can and often does produce severe weather. Keep this in mind over the next few weeks.
The National Weather Service defines a severe thunderstorm as one that produces quarter size hail or larger, 58 mph winds or greater, and/or a tornado.
.
Severe Weather Risk Graphic (this is not for regular summer storms. This graphic is for severe thunderstorms)
The National Weather Service defines a severe thunderstorm as one that produces quarter size hail or larger, 58 mph winds or greater, and/or a tornado.
NONE
.
Click here if you would like to return to the top of the page.
Today’s outlook (below).
Light green is where thunderstorms may occur but should be below severe levels.
Dark green is a level one risk. Yellow is a level two risk. Orange is a level three (enhanced) risk. Red is a level four (moderate) risk. Pink is a level five (high) risk.
One is the lowest risk. Five is the highest risk.
Light green is not assigned a number. Light green is where storms may occur but should be below severe levels.
A severe storm is one that produces 60 mph winds or higher, quarter size hail, and/or a tornado. One or more of those is defined as a severe thunderstorm.

The black outline is our local area.

.
Tomorrow’s outlook.
Light green is where thunderstorms may occur but should be below severe levels.
Dark green is a level one risk. Yellow is a level two risk. Orange is a level three (enhanced) risk. Red is a level four (moderate) risk. Pink is a level five (high) risk.
One is the lowest risk. Five is the highest risk. Light green is not assigned a number.


.
Be sure and have WeatherOne turned on in your WeatherTalk accounts. That is the one for tornadoes, severe storms, and winter storms.
Log into your www.weathertalk.com
Click the personal notification settings tab.
Turn on WeatherOne. Green is on. Red is off.
.
Here is the latest graphic from the WPC/NOAA.
.
24-hour precipitation outlook.
.

.
48-hour precipitation outlook.
.
.
.
72-hour precipitation outlook.
.

.
Days one through seven added together. Seven-day rainfall totals.

.
- Dry today through Sunday.
- Cold today. Well below normal temperatures.
- Clouds increase Sunday night with rain and snow on Monday. Little or light accumulation possible.
- Bitterly cold Monday night into Wednesday. Black ice possible Monday night/Tuesday.ing to snow.
Click here if you would like to return to the top of the page.
.
![]()
.
Weather
.
Advice:
Monitor updates concerning a cold front Sunday night and Monday. Rain will change to snow. Bitterly cold air Monday night with lows in the teens. Wind chills in the single digits to teens.
.
Weather Forecast Analysis.
.
As a reminder, I am in Europe over the coming days. I will update everything as soon as possible. There is a six hour time difference. Some products may be at different times than normal. The good news is that calm weather is anticipated after Thursday afternoon.
.
I have updated all of the graphics.
.
Bottom line: I have updated the graphics (Friday morning). Cold today with January like temperatures.
Clouds increase Sunday night with rain and snow moving in from the northwest on Monday. Little to light accumulation possible. Black ice possible Monday night/Tuesday morning as any remaining moisture will freeze on surfaces.
January cold Monday through Wednesday.
Today
.Here is the Friday morning wind chill map. Again, brrr.

Here is the Friday 12 pm wind chill map. A cold end to the week.

.
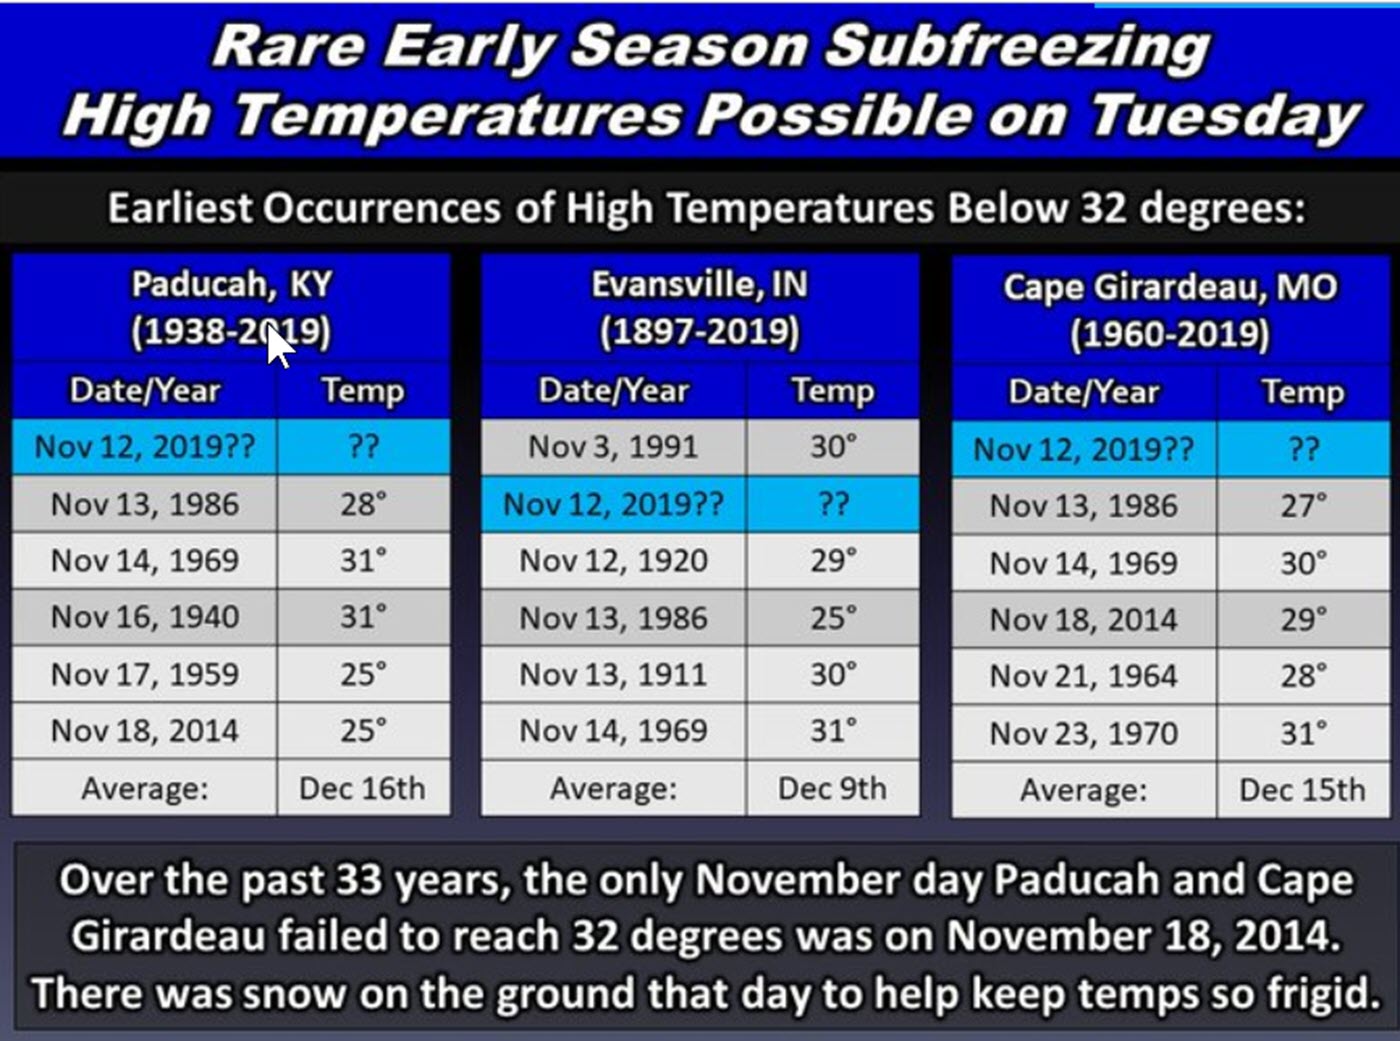
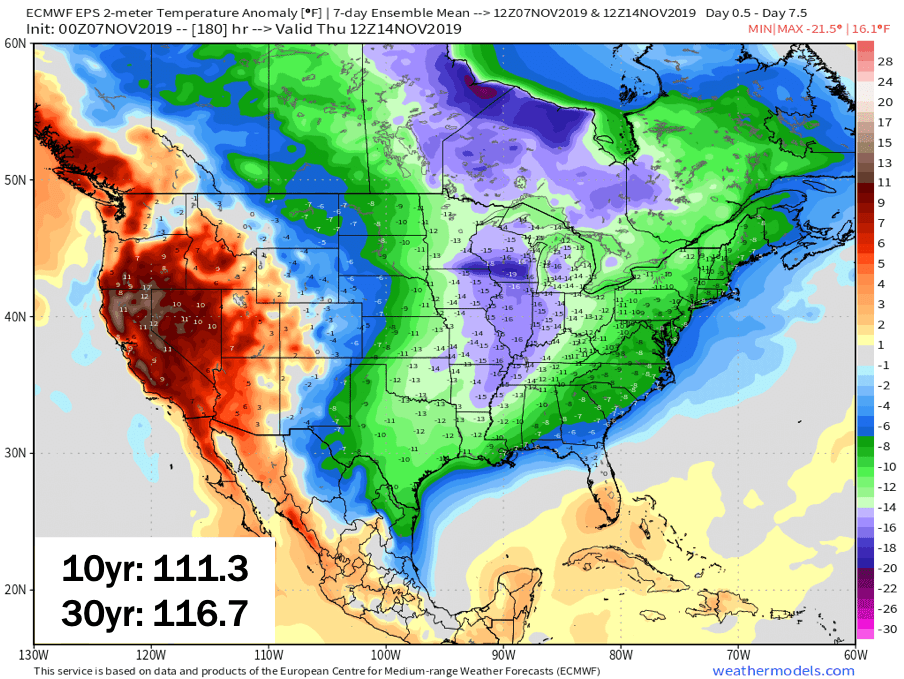
Temperatures will be well below average over the coming days.
Average high temperatures for this time of the year are around 64 degrees.
Average low temperatures for this time of the year are around 43 degrees.
Here is an animation showing you just how many degrees below normal we will be.
Cold!
.
Saturday through Wednesday. Winter cold is on the way (again).
Chilly weather on Saturday. It will warm up a bit on Sunday with highs in the upper 50s to around 60 degrees. It won’t last.
The next big weather story will arrive late Sunday night into Monday.
A strong arctic cold front will sweep through the region.
There could be some light rain showers late Sunday night over southeast Missouri and southern Illinois.
Moisture will increase as a sharp cold front moves into the region from the northwest. As this front interacts with an upper level disturabnce there will be enough lift to produce some rain showers.
Colder will already be entering our northern counties by sunrise.
As the cold air moves southward it will interact with the rain. The rain will change to sleet and snow. At this time, it appears that 0″ to 1″ of snow will be possible.
The bigger concern will be black ice.
What is black ice?
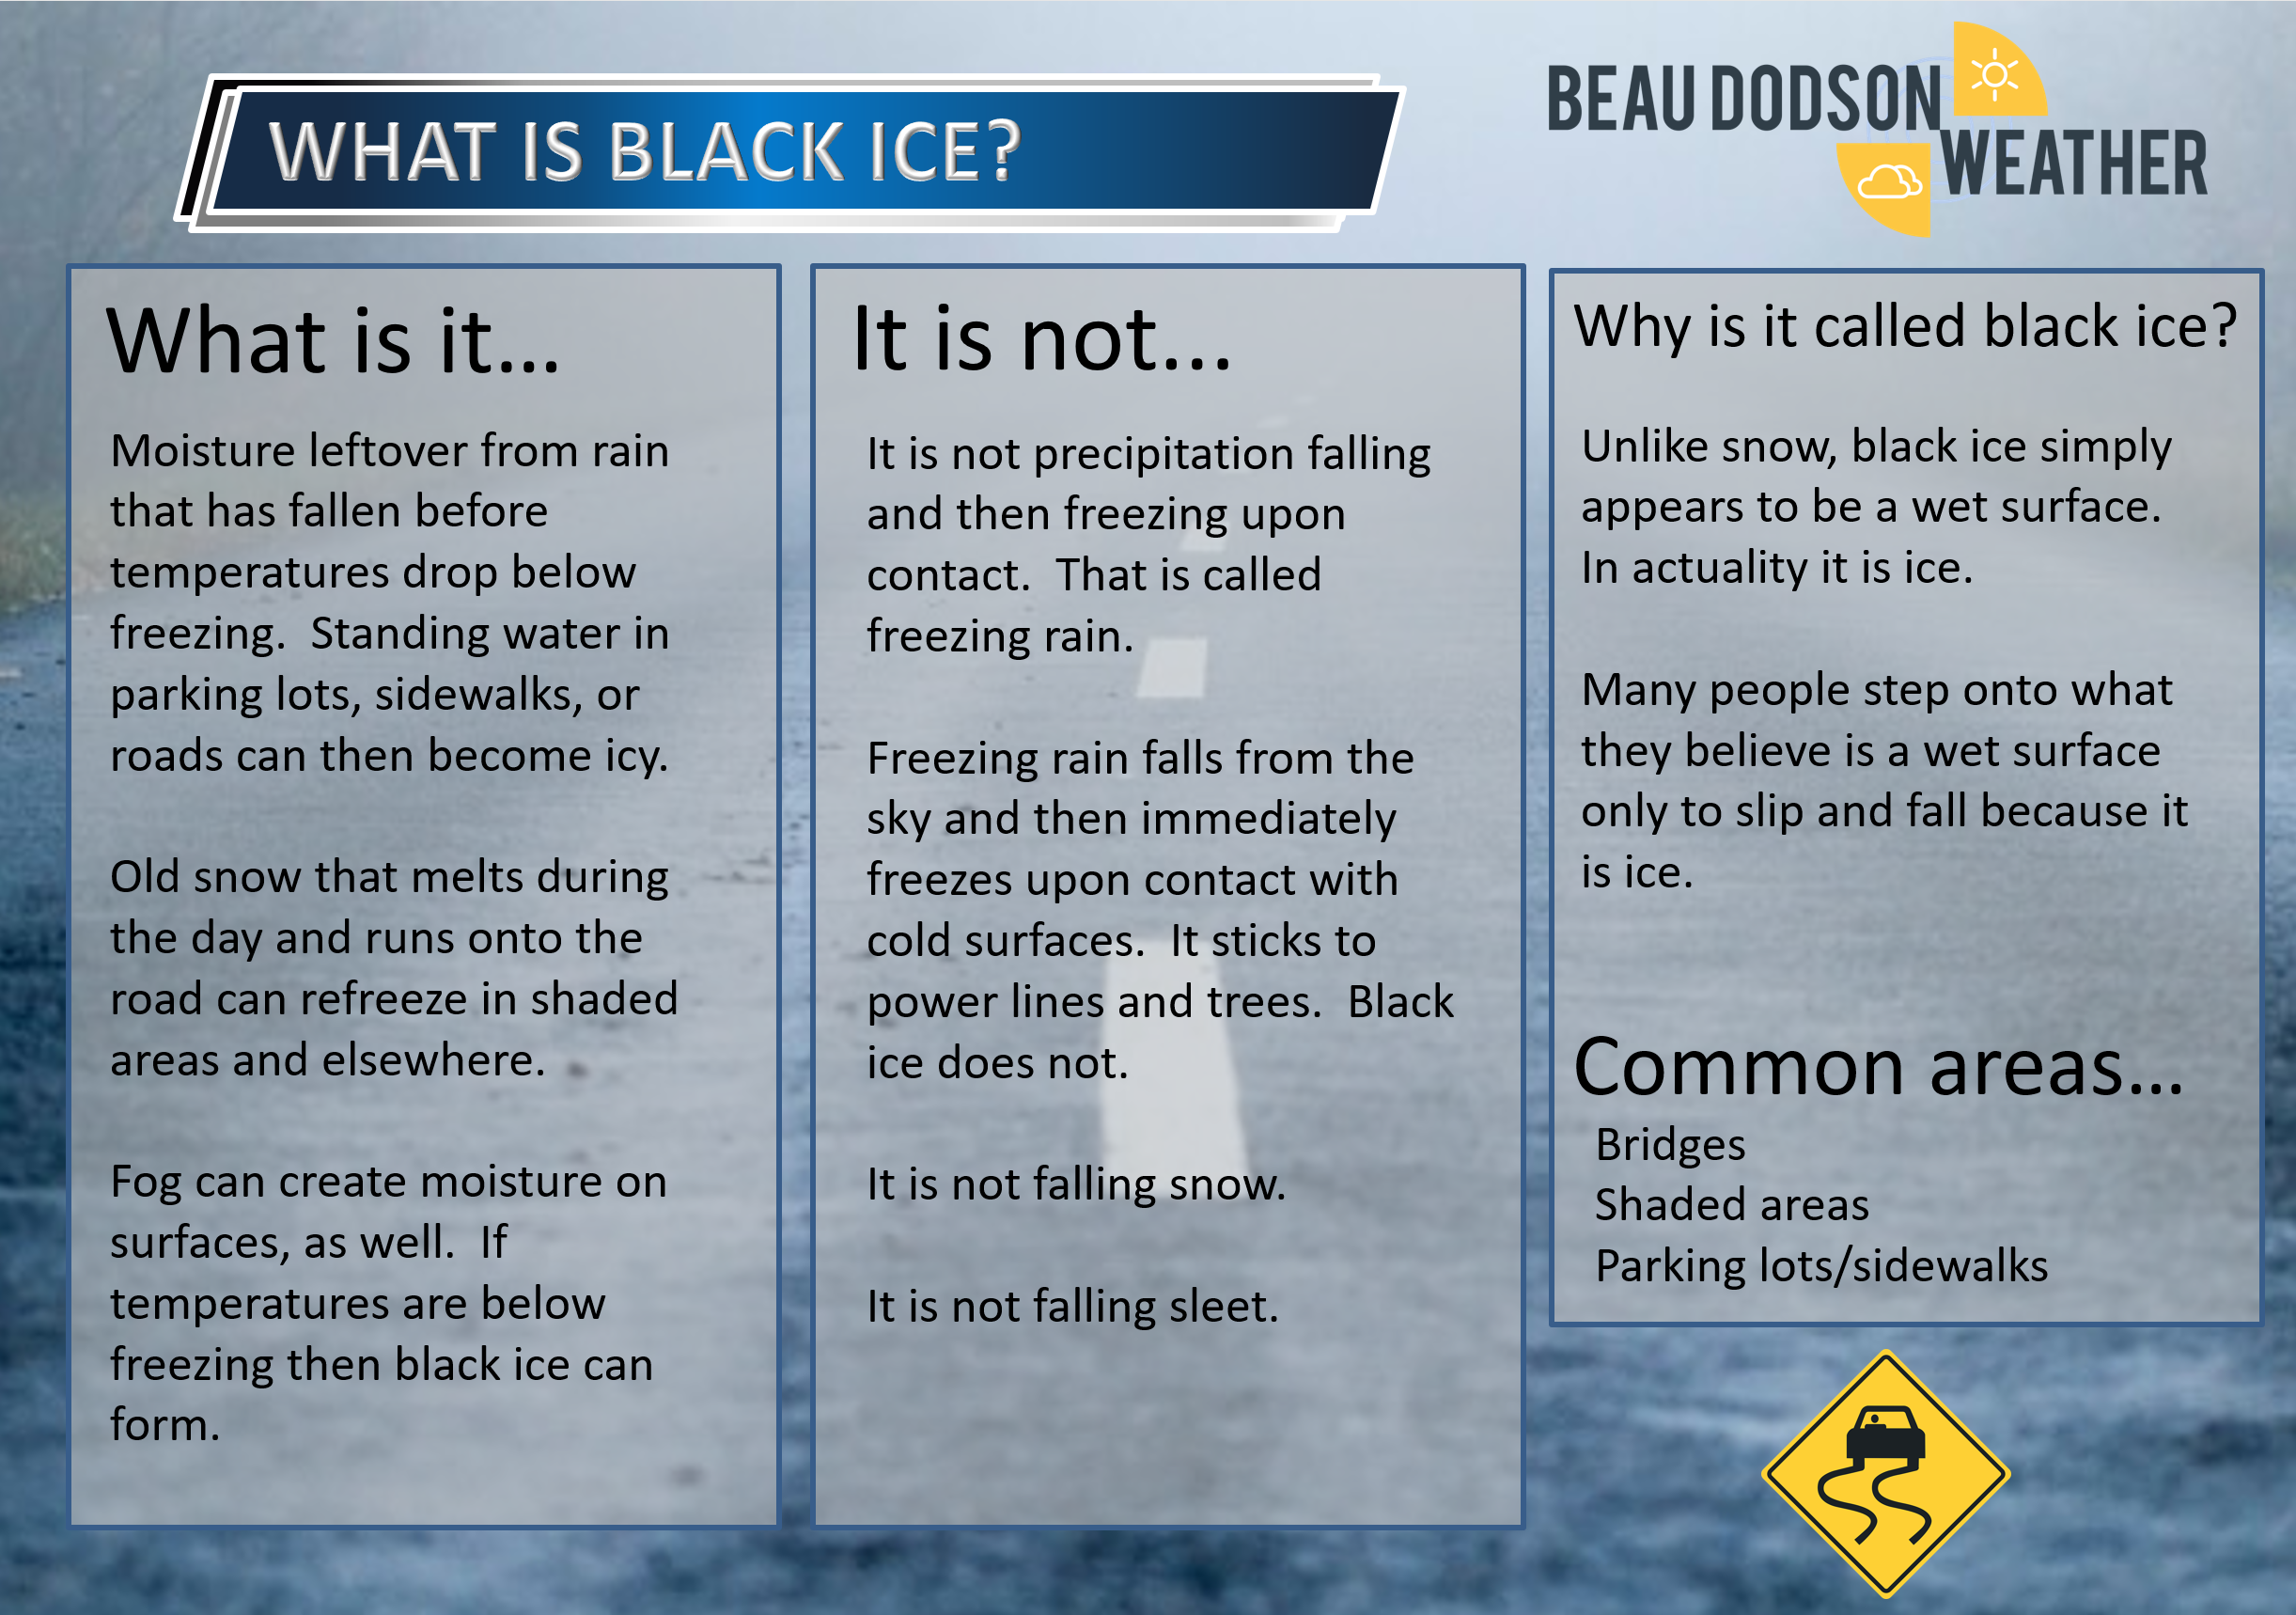
It does not take much moisture to produce black ice. Slips and falls are common when this occurs. So, use care, as always.
Let’s look at a few maps.
This is the EC model guidance for Sunday night into Monday night. You can see rain changing to snow.
Green is rain. Blue is snow. Purple is a wintry mix.
.
And another model
The NAM
This only goes out to around 12 PM Monday. The new runs will go out a longer length of time.
.
The American GFS model
At one point the GFS was dry. Now it is the most bullish on precipitation. Just one reason not to trust models in the long range.
.
In addition to the possible rain or snow we will have bitterly cold temperatures. The cold temperatures are a lock. That is coming.
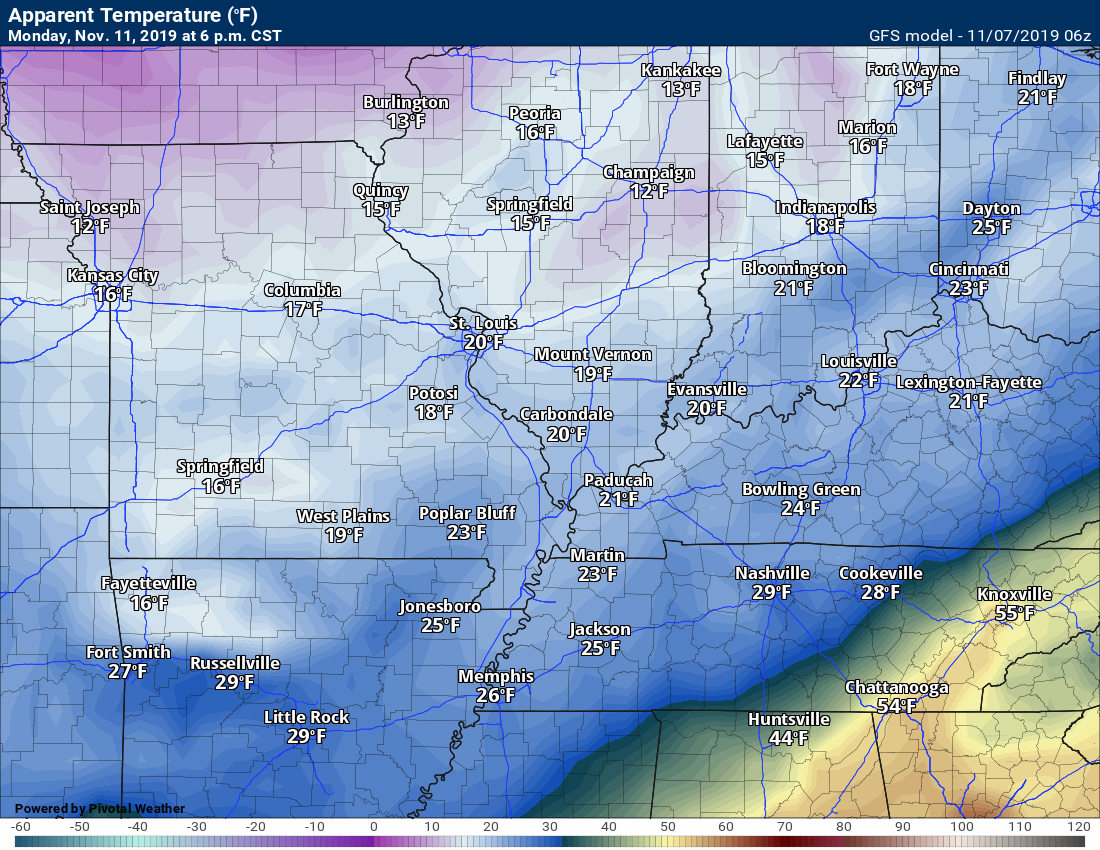
Here are some of the numbers
Monday 6 PM wind chill temperatures.
.
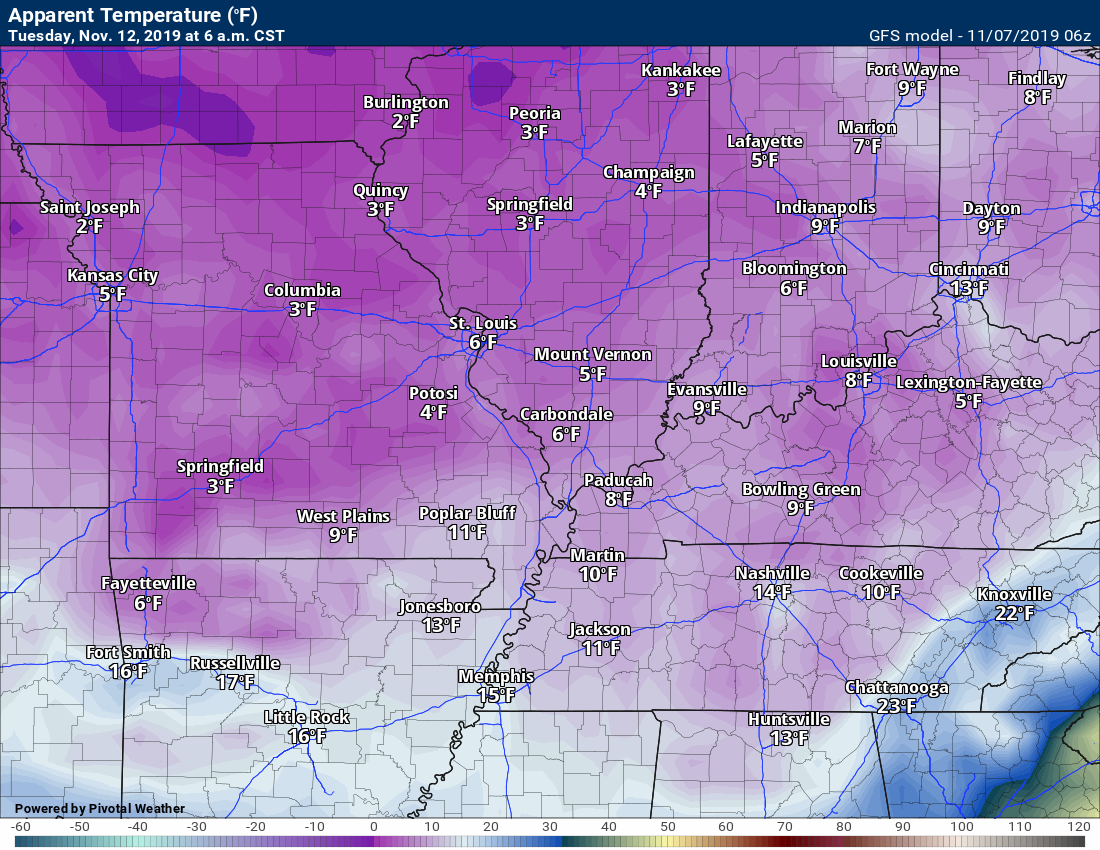
Tuesday 6 AM wind chill. Cold for the kids.
.
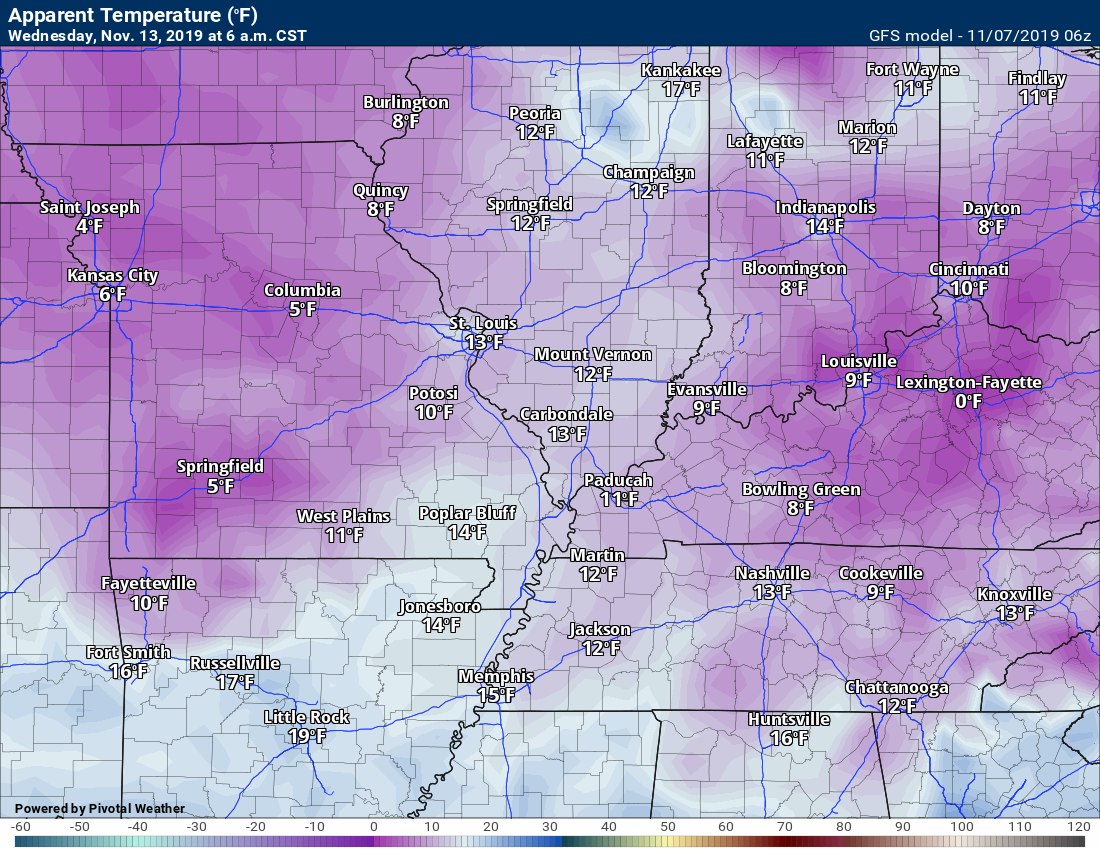
Wednesday 6 AM wind chill temperatures.
.
.
 .
.
Click here if you would like to return to the top of the page.
Again, as a reminder, these are models. They are never 100% accurate. Take the general idea from them.
Timestamp upper left.
Click the animation to expand it.
What should I take from these?
- The general idea and not specifics. Models usually do well with the generalities.
- The time-stamp is located in the upper left corner.
The animations are above in the main discussion portion of the blog. Scroll up.
.
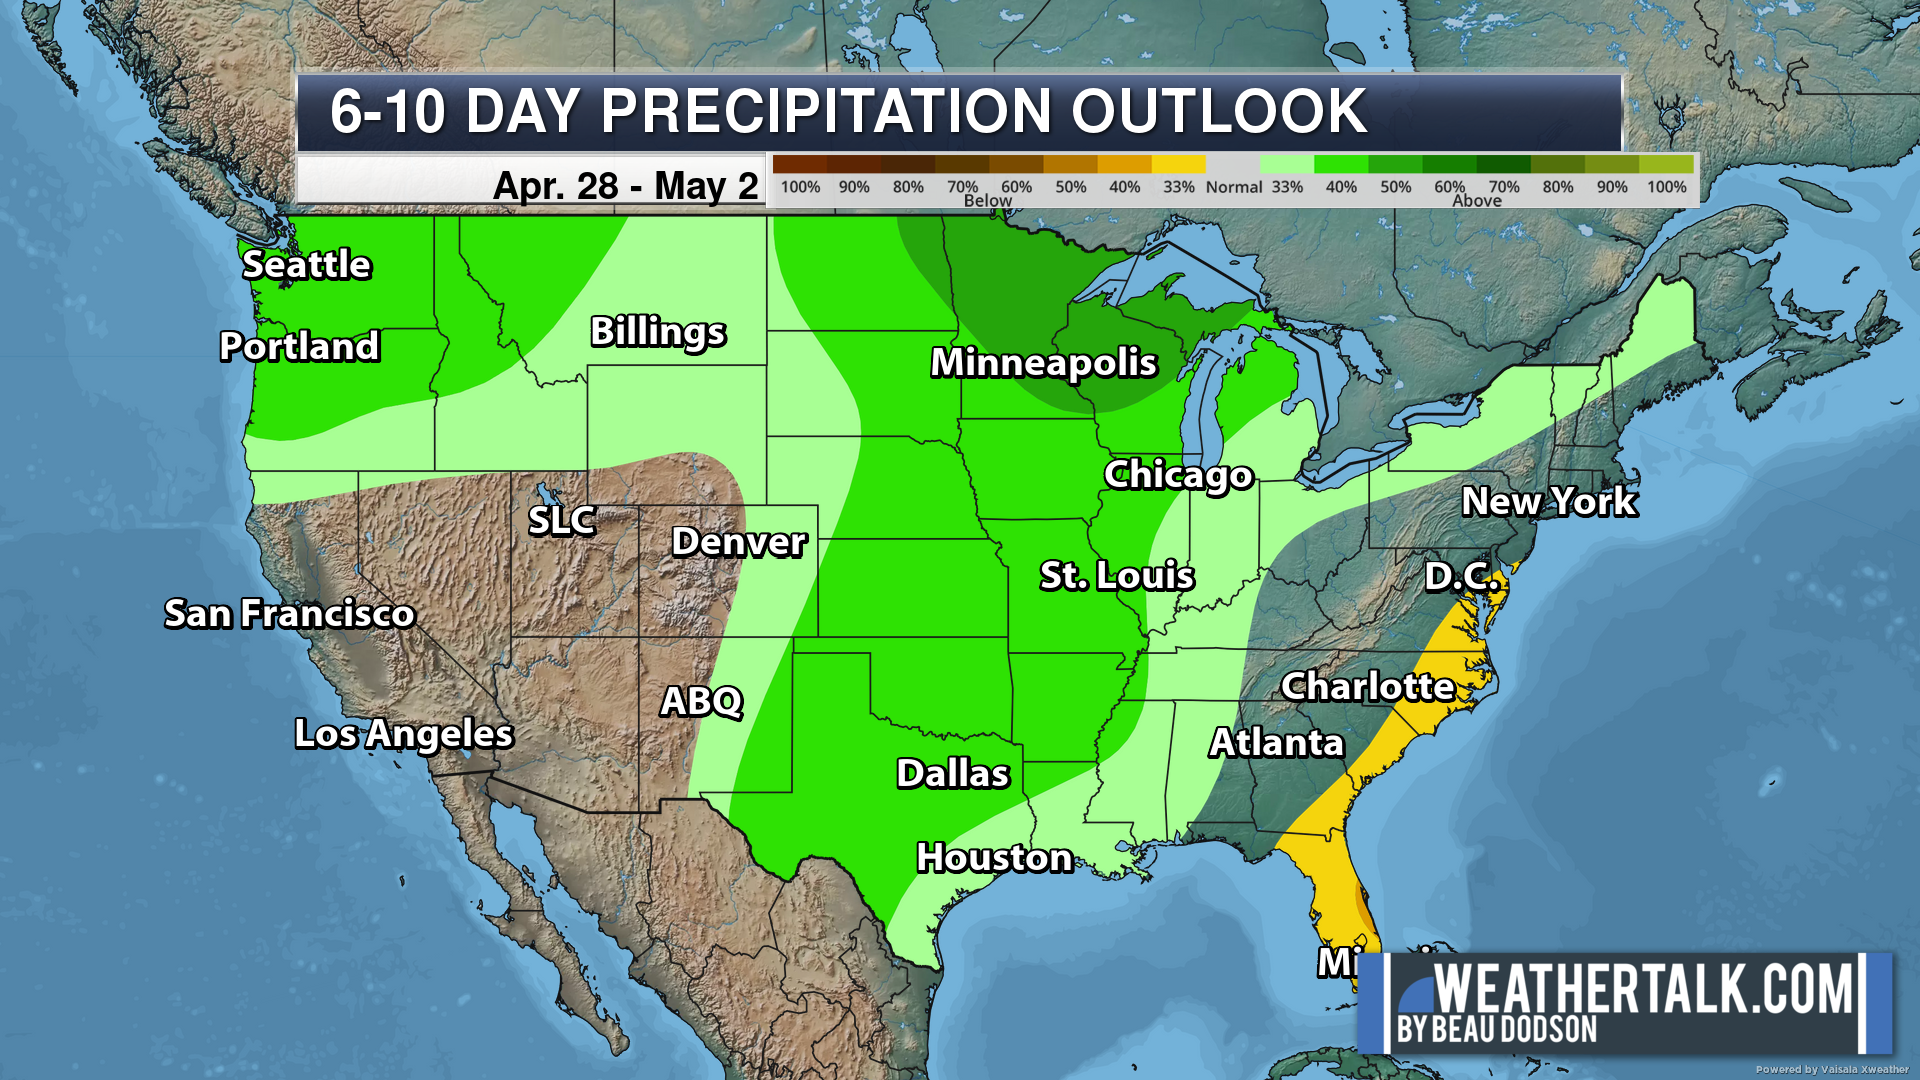
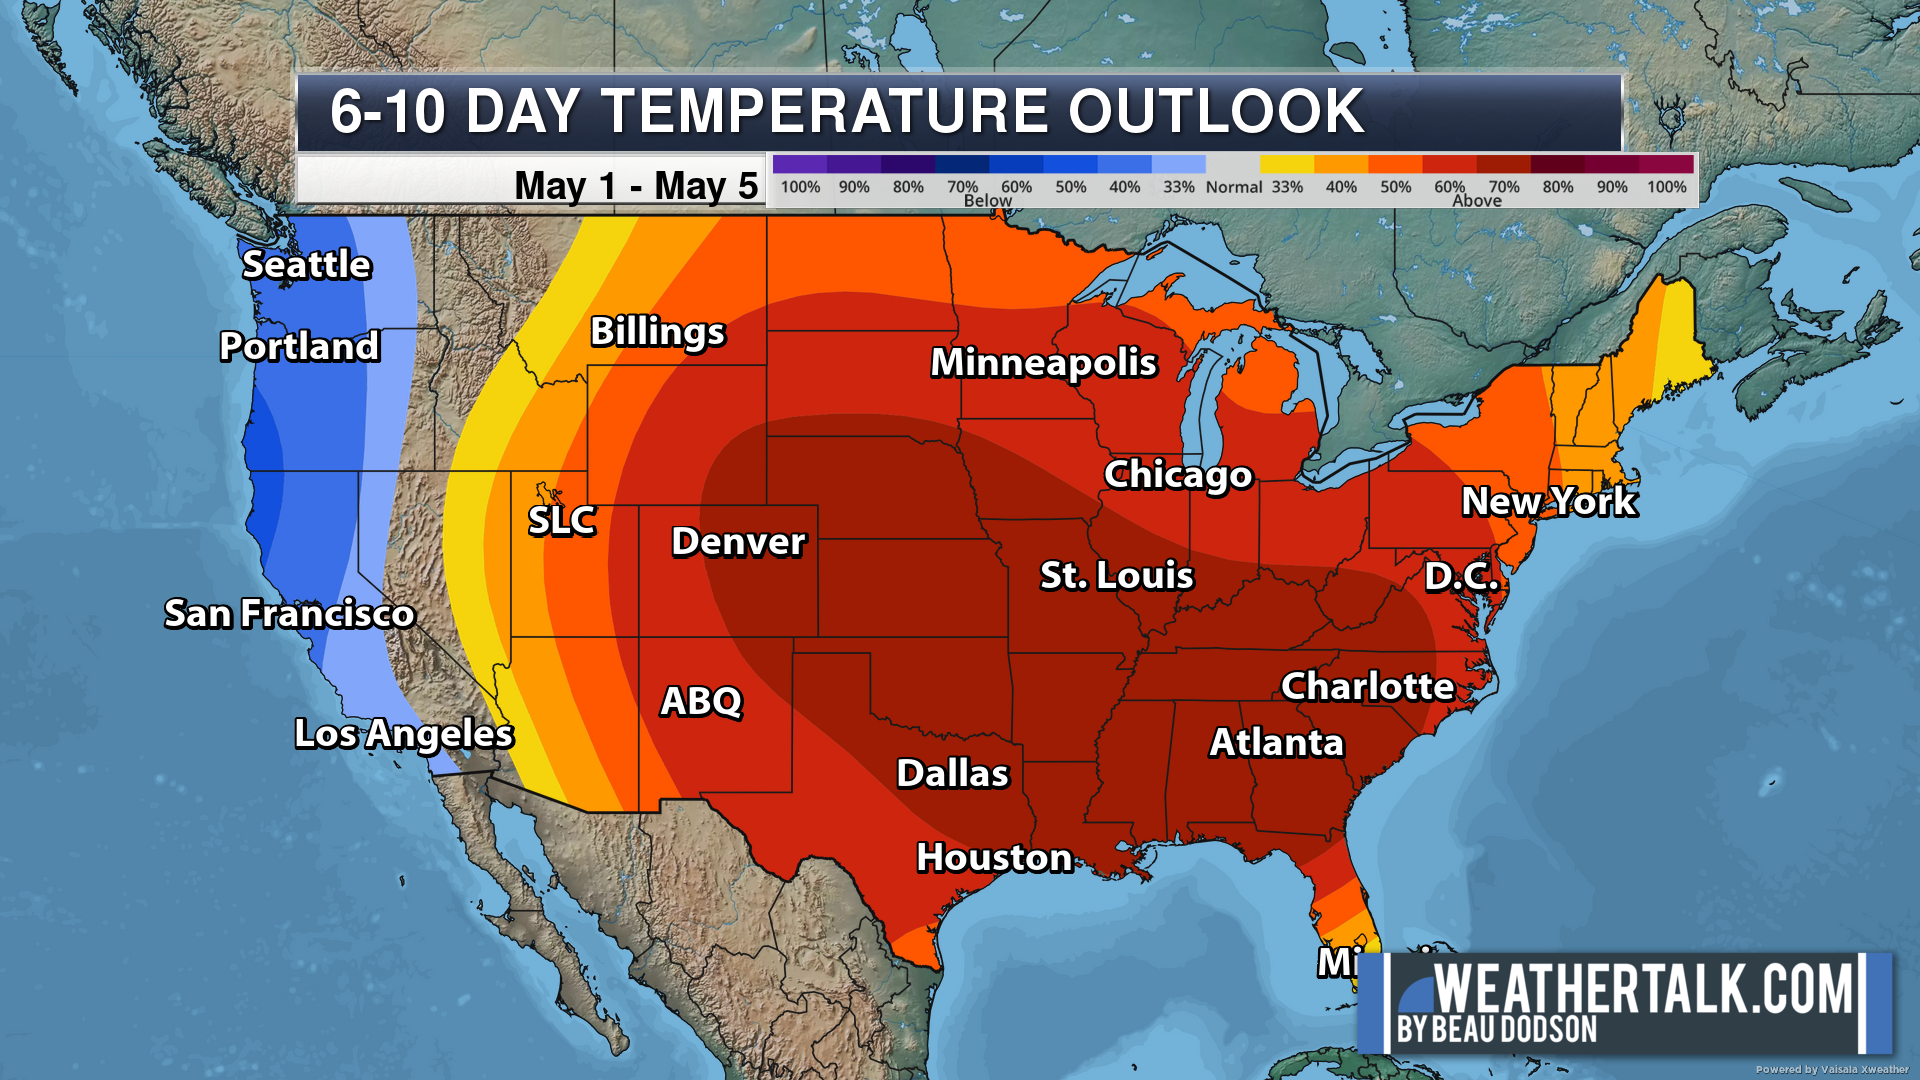
Here are the WPC forecast graphics for the six to ten and eight to fourteen-day period. This is for precipitation and temperatures.
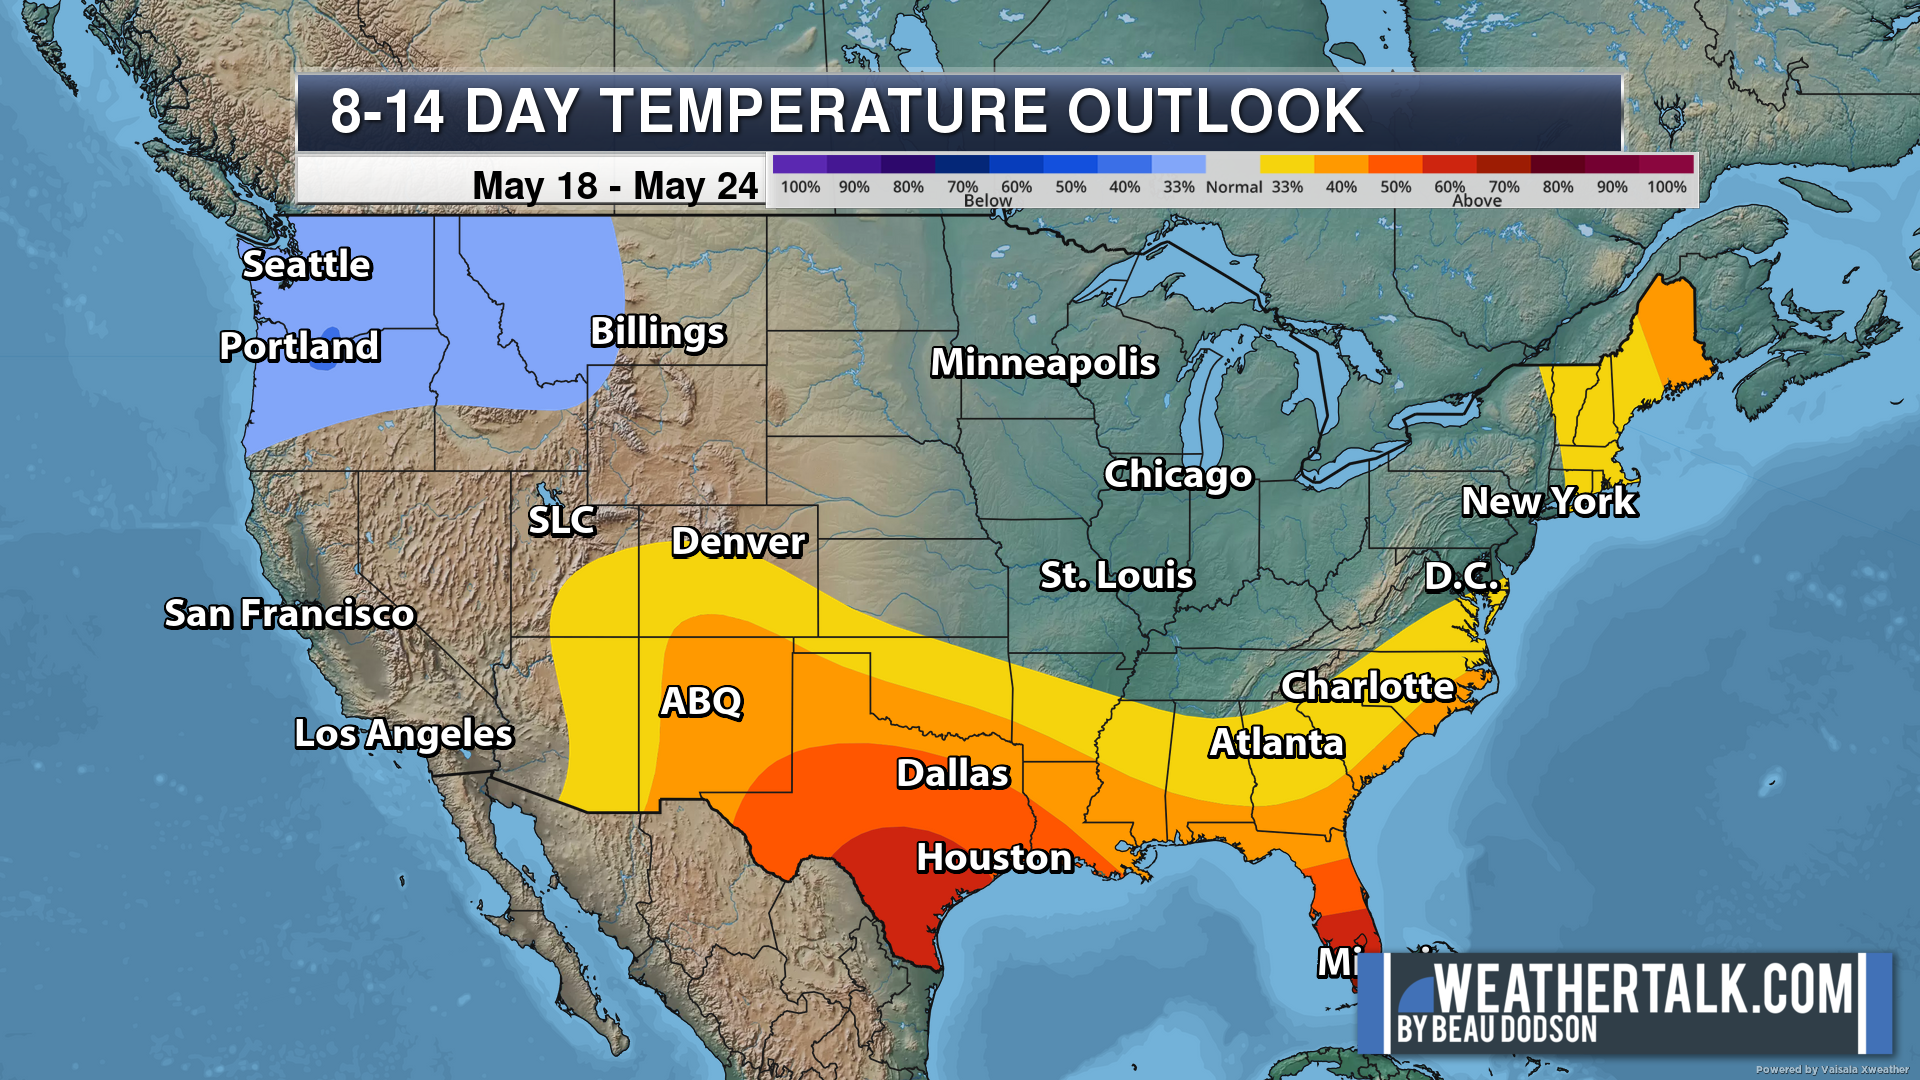
Darker colors equal a higher chance of it happening. Deep red means a high chance that temperatures will be above normal. Dark blue means a high chance that temperatures will be below normal.
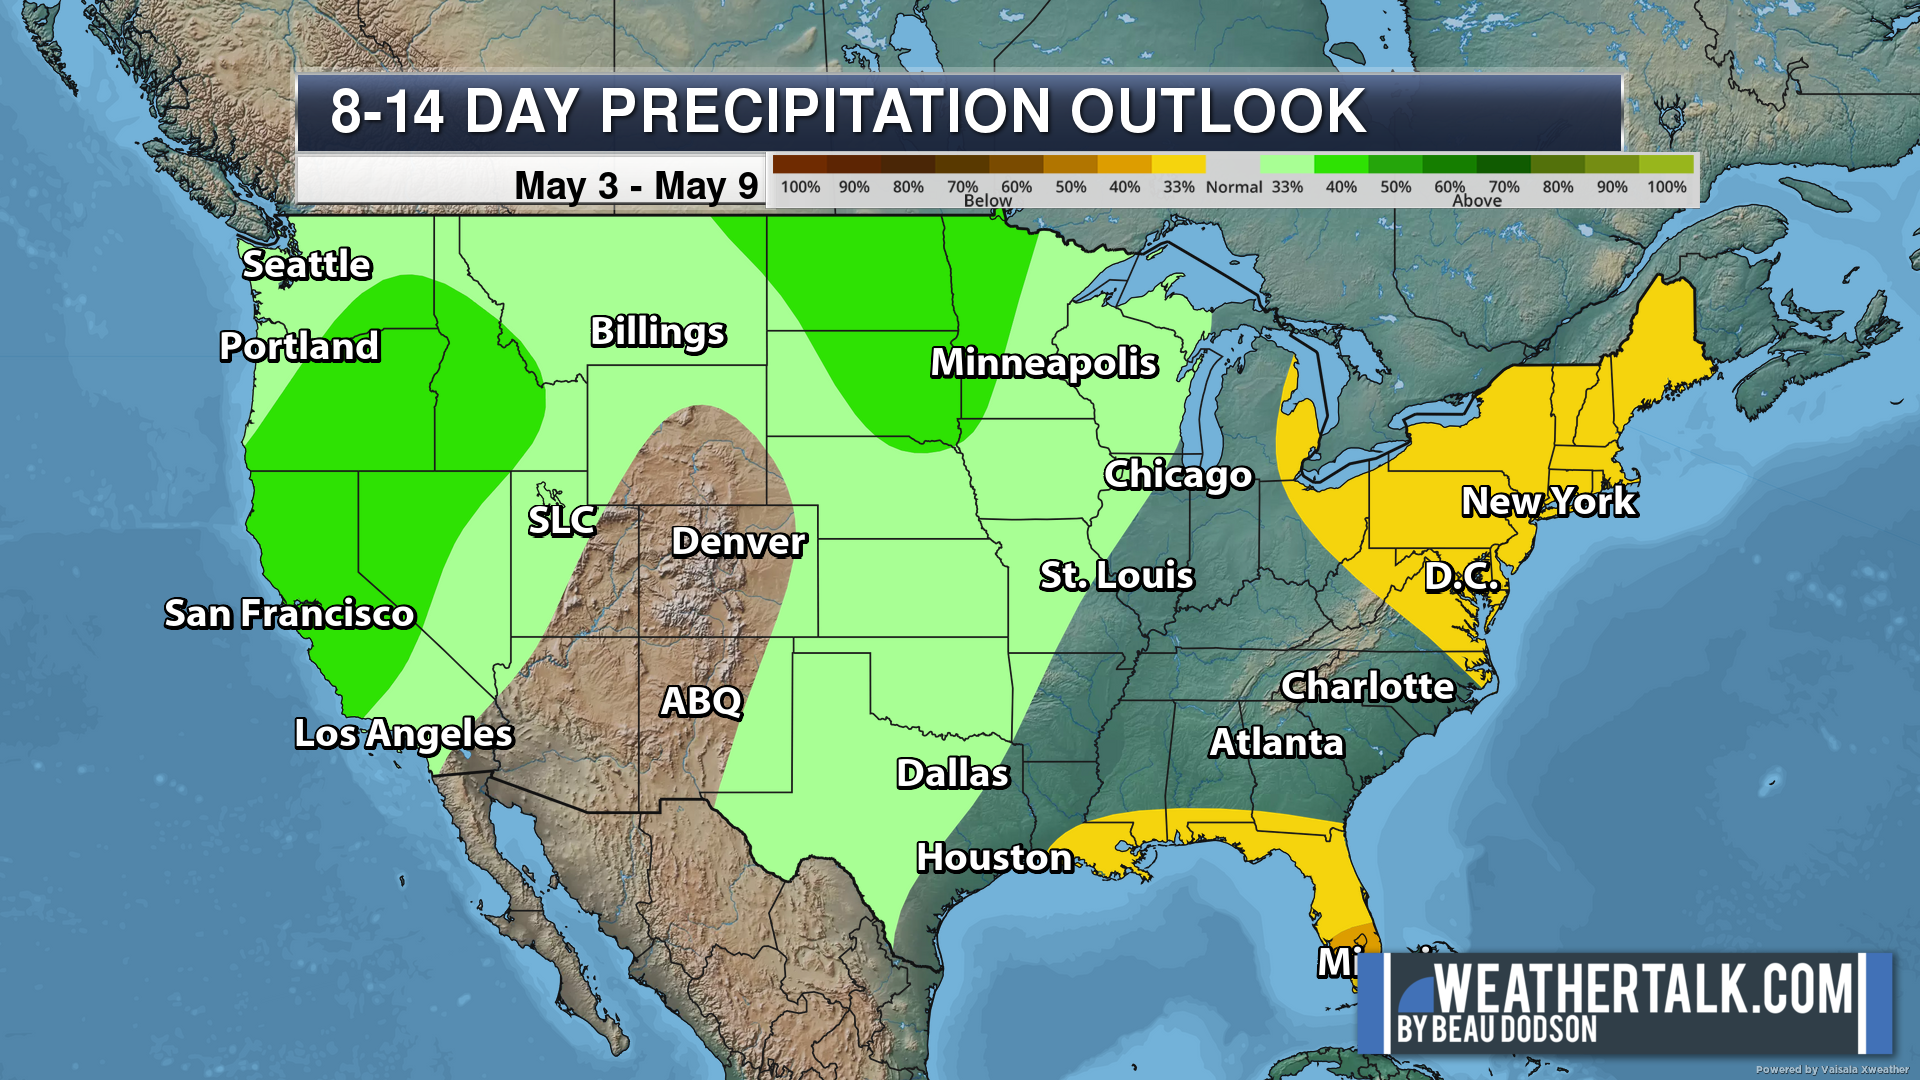
The light green colors represent a lower end chance of above-normal rainfall. Dark green means a high chance of precipitation being above normal.
The yellow/orange color means a high chance that precipitation will be below normal.
The 6 to 10-day outlook.
Precipitation
.
Temperatures
.
And the 8 to 14-day outlook.
Precipitation
Temperatures
.
These maps below update several times a day. Occasionally, in between updates, you may see a duplicate day or one out of sync.
Forty-eight-hour temperature outlook.
*****
![]()
These are bonus videos and maps for subscribers. I bring these to you from the BAMwx team. I pay them to help with videos.
The Ohio and Missouri Valley videos cover most of our area. They do not have a specific Tennessee Valley forecast but they may add one in the future.
The long-range video is a bit technical. Over time, you can learn a lot about meteorology from the long-range video.
NOTE: These may not be updated on Saturday and Sunday.
Click here if you would like to return to the top of the page.
These are bonus videos for subscribers.
I hire BAMwx to help with videos.
They do not currently have a Kentucky/Tennessee specific video.
The Ohio Valley video does capture our region.
The long-range video does cover our region.
There may be some differences in the videos vs my forecast thoughts. Keep that in mind.
Videos will be in the app first. Check your WeatherTalk app. Click video tab. You can also log into the www.weathertalk.com website to view videos.
Ohio Valley video
.

This video is a bit more meteorologically technical. An in-depth discussion about the coming weeks.
Videos will be in the app first. Check your WeatherTalk app. Click video tab. You can also log into the www.weathertalk.com website to view videos.
Long Range VIdeo

Videos will be in the app first. Check your WeatherTalk app. Click video tab. You can also log into the www.weathertalk.com website to view videos.
The Missouri Valley Forecast Vide0
.

Key Points: This was written by the BAMwx team. I don’t edit it.
.
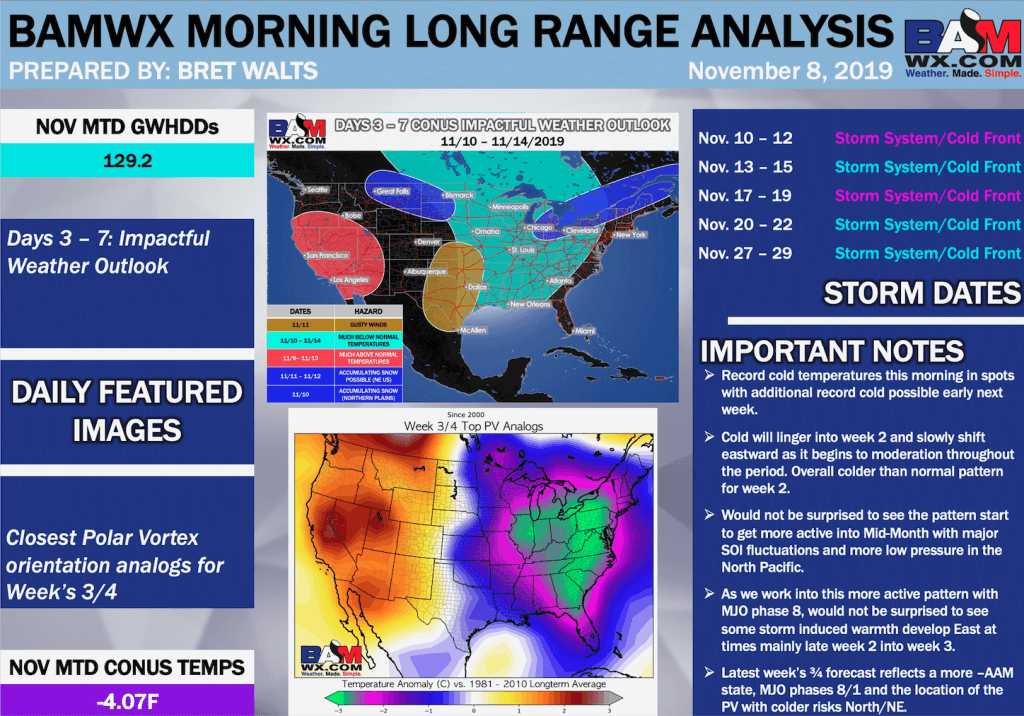
Key Points:
- Record cold temperatures this morning in spots with additional record cold possible early next week.
- Cold will linger into week 2 and slowly shift eastward as it begins to moderation throughout the period. Overall colder than normal pattern for week 2.
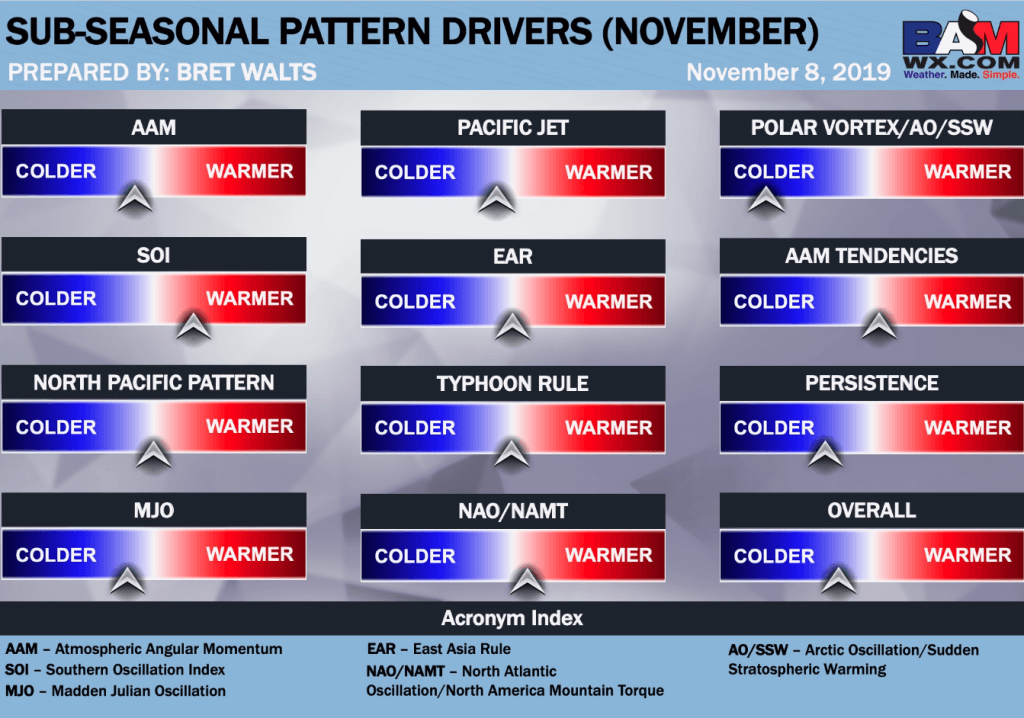
- Would not be surprised to see the pattern start to get more active into Mid-Month with major SOI fluctuations and more low pressure in the North Pacific.
- As we work into this more active pattern with MJO phase 8, would not be surprised to see some storm induced warmth develop East at times mainly late week 2 into week 3.
- Latest week’s ¾ forecast reflects a more –AAM state, MJO phases 8/1 and the location of the PV with colder risks North/NE.
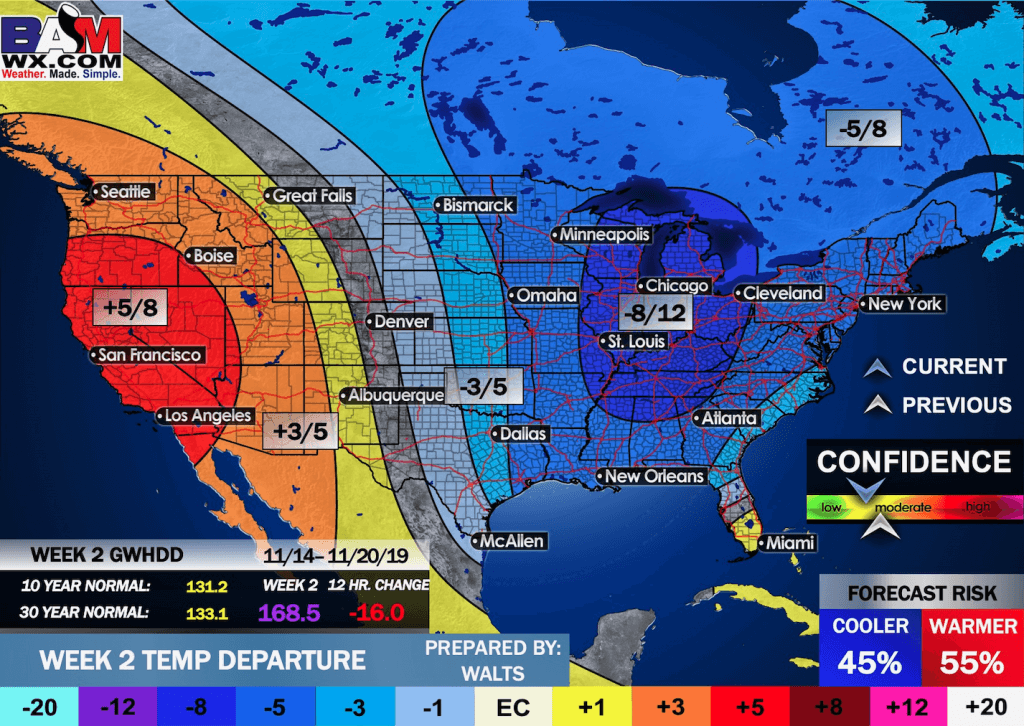
Weeks 1/2 temperature outlooks:
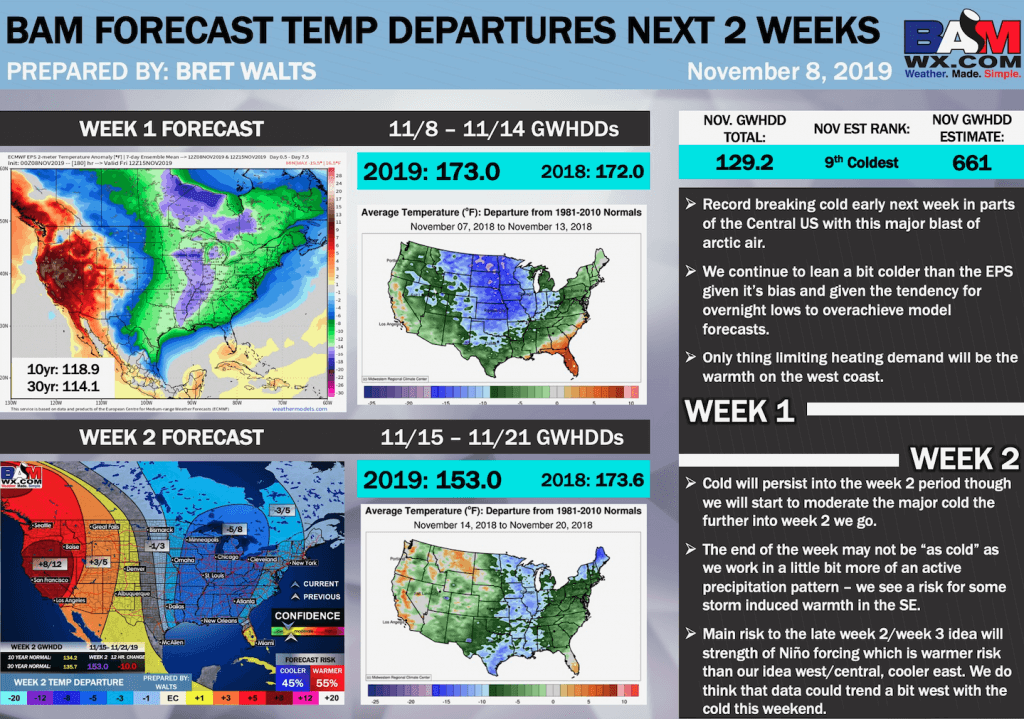
Week 1:
- Record breaking cold early next week in parts of the Central US with this major blast of arctic air.
- We continue to lean a bit colder than the EPS given it’s bias and given the tendency for overnight lows to overachieve model forecasts.
- Only thing limiting heating demand will be the warmth on the west coast.
Week 2:
- Cold will persist into the week 2 period though we will start to moderate the major cold the further into week 2 we go.
- The end of the week may not be “as cold” as we work in a little bit more of an active precipitation pattern – we see a risk for some storm induced warmth in the SE.
- Main risk to the late week 2/week 3 idea will strength of Niño forcing which is warmer risk than our idea west/central, cooler east. We do think that data could trend a bit west with the cold this weekend.
Weeks 1/2 precipitation outlooks:

Week 1:
- Data continues to generally trend weaker with the wintry system in the Ohio Valley in week 1.
- High pressure and cold air is overpowering moisture making it difficult for wet risks.
- Northern stream remains active in the Northern Plains with weak waves of light snow possible this weekend into early next week.
Week 2:
- Going wetter than the data as we begin to see more phase 8 MJO influence.
- The major SOI fluctuations and low pressure in the North Pacific would also favor a more active pattern especially for the East Coast.
- Risk here is just the placement of the cold. We are a bit further west than data – if it trends further east risk would be more dryness into the Ohio Valley.
- Need to keep an eye on late week 2 as main wetter risk for Central US pending SE ridge influence.
Weeks 3/4 updated outlooks:
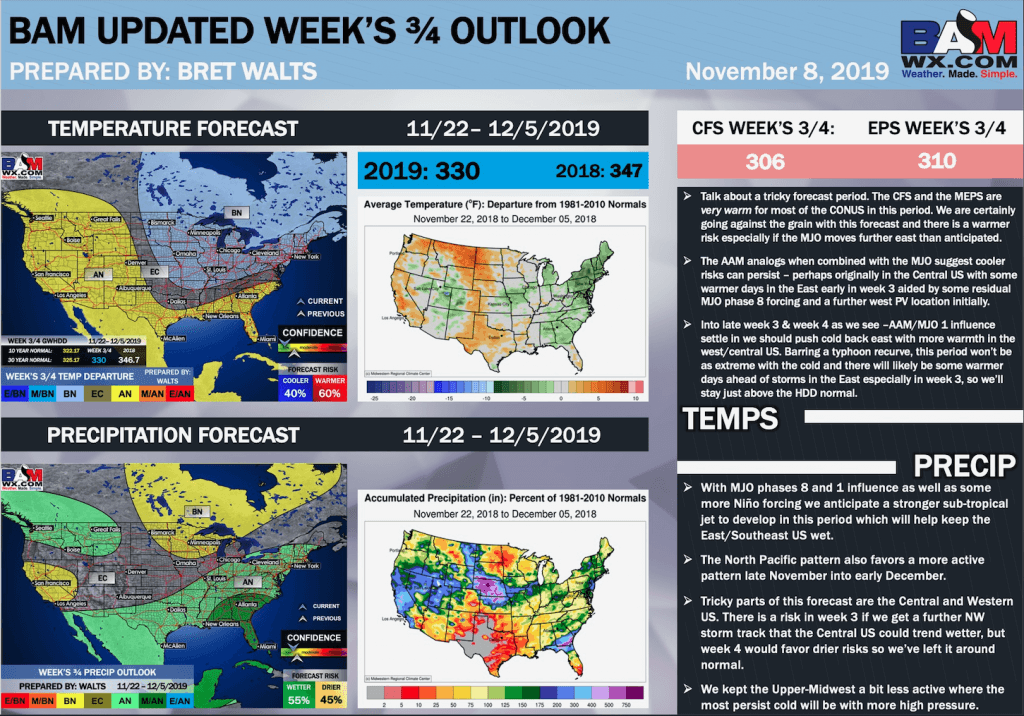
Temperatures:
- Talk about a tricky forecast period. The CFS and the MEPS are very warm for most of the CONUS in this period. We are certainly going against the grain with this forecast and there is a warmer risk especially if the MJO moves further east than anticipated.
- The AAM analogs when combined with the MJO suggest cooler risks can persist – perhaps originally in the Central US with some warmer days in the East early in week 3 aided by some residual MJO phase 8 forcing and a further west PV location initially.
- Into late week 3 & week 4 as we see –AAM/MJO 1 influence settle in we should push cold back east with more warmth in the west/central US. Barring a typhoon recurve, this period won’t be as extreme with the cold and there will likely be some warmer days ahead of storms in the East especially in week 3, so we’ll stay just above the HDD normal.
Precipitation:
- With MJO phases 8 and 1 influence as well as some more Niño forcing we anticipate a stronger sub-tropical jet to develop in this period which will help keep the East/Southeast US wet.
- The North Pacific pattern also favors a more active pattern late November into early December.
- Tricky parts of this forecast are the Central and Western US. There is a risk in week 3 if we get a further NW storm track that the Central US could trend wetter, but week 4 would favor drier risks so we’ve left it around normal.
- We kept the Upper-Midwest a bit less active where the most persist cold will be with more high pressure.
Updated sub-seasonal pattern drivers for November:
.
Click here if you would like to return to the top of the page.
.
Average high temperatures for this time of the year are around 64 degrees.
Average low temperatures for this time of the year are around 43 degrees.
Average precipitation during this time period ranges from 0.80″ to 1.00″
Yellow and orange are above average. Red is much above average. Light blue and blue is below average. Green to purple is much below average.
This outlook covers November 8h through November 13th
Click on the image to expand it.
While I am traveling, these particular graphics may have to be posted later than normal. Please keep that in mind.
.
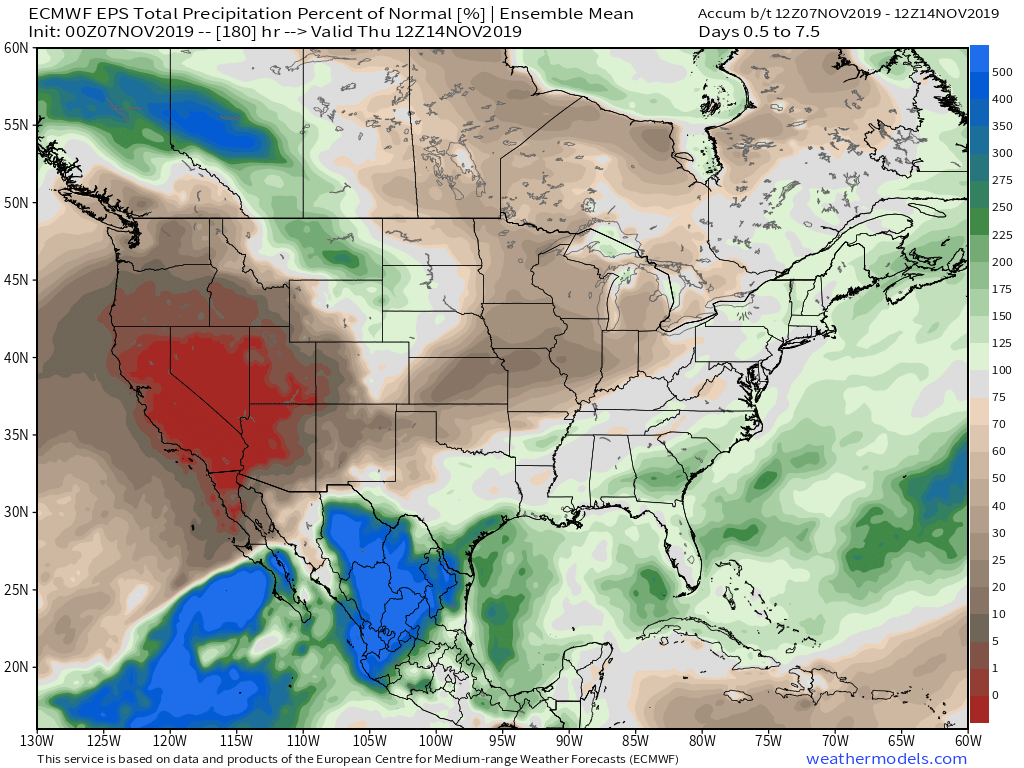
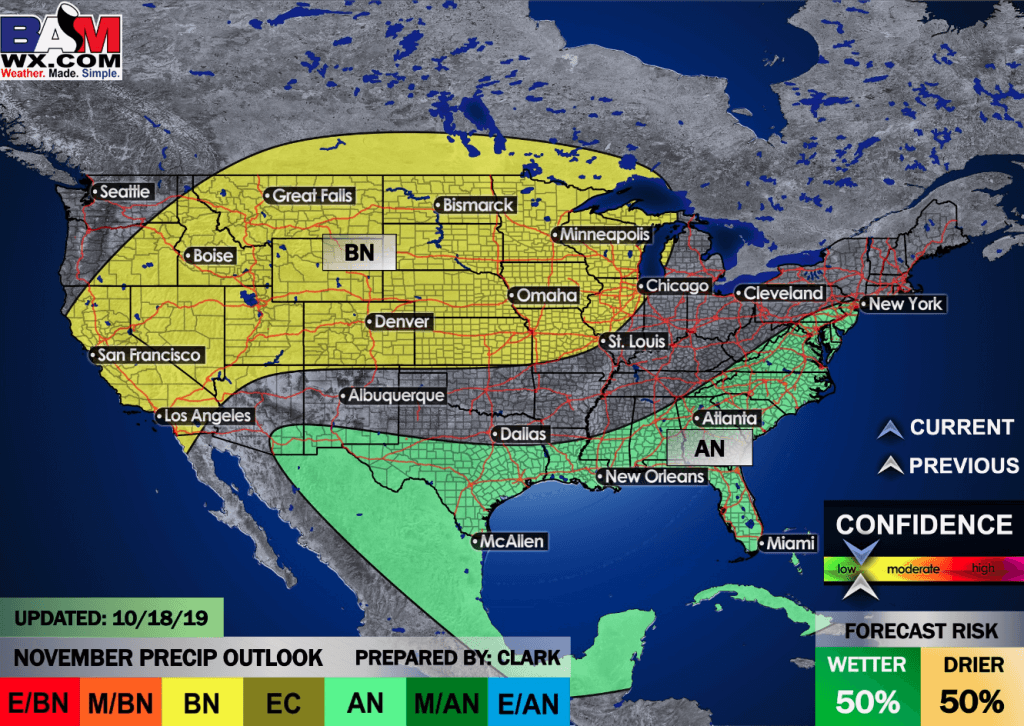
The precipitation forecast is PERCENT OF AVERAGE. Brown is below average. Green is above average. Blue is much above average.
.
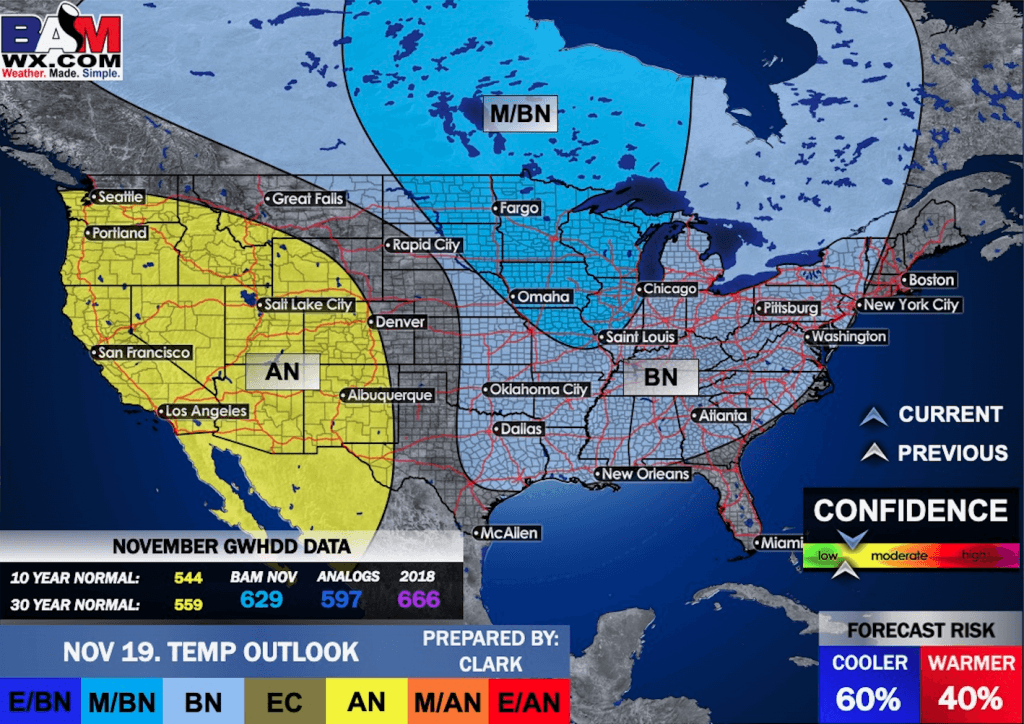
Outlook definitions
EC = Equal chances of above or below average
BN= Below average
M/BN = Much below average
AN = Above average
M/AN = Much above average
E/AN = Extremely above average
Average low temperatures for this time of the year are around 40 degrees
Average precipitation during this time period ranges from 1.00″ to 1.20″
.
This outlook covers November 14th through November 20th
Click on the image to expand it.
While I am traveling, these particular graphics may have to be posted later than normal. Please keep that in mind.
.
The precipitation forecast is PERCENT OF AVERAGE. For example, if your average rainfall is 1.00″ and the graphic shows 25%, then that would mean 0.25″ of rain is anticipated.

.
Outlook definitions
EC = Equal chances of above or below average
BN= Below average
M/BN = Much below average
AN = Above average
M/AN = Much above average
E/AN = Extremely above average
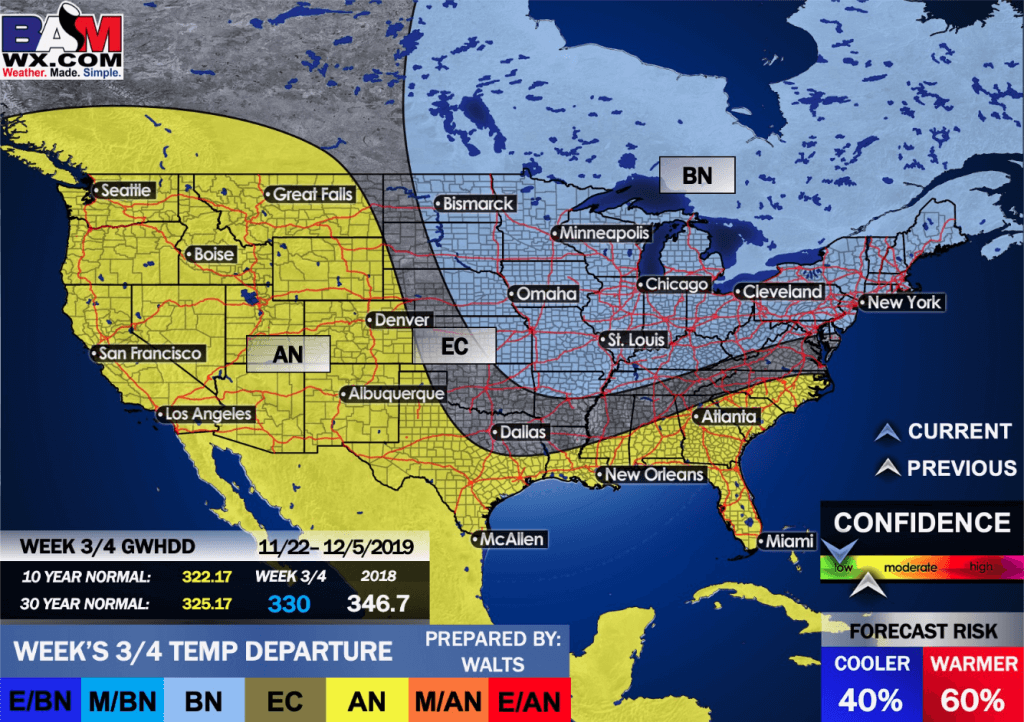
Average high temperatures for this time of the year are around 52 degrees
Average low temperatures for this time of the year are around 32 degrees
Average precipitation during this time period ranges from 1.90″ to 2.20″
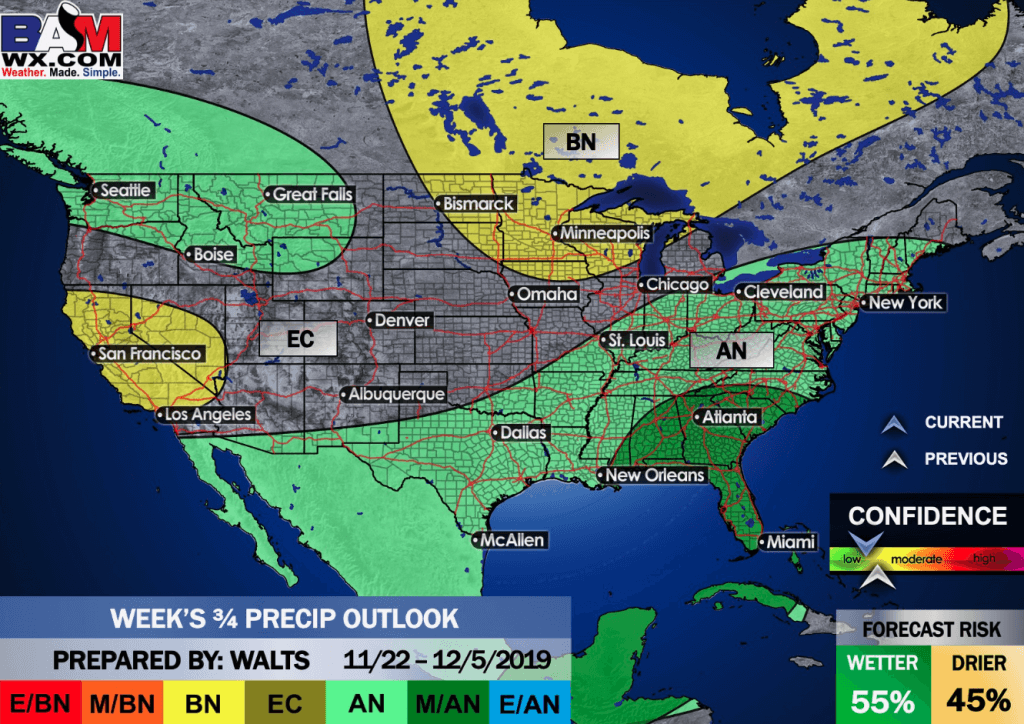
This outlook covers November 22nd through December 5th
Click on the image to expand it.
While I am traveling, these particular graphics may have to be posted later than normal. Please keep that in mind.
.
.
The precipitation forecast is PERCENT OF AVERAGE. For example, if your average rainfall is 1.00″ and the graphic shows 10%, then that would mean 0.10″ of rain is anticipated.
.
Outlook definitions
EC= Equal chances of above or below average
BN= Below average
M/BN = Much below average
AN = Above average
M/AN = Much above average
E/AN = Extremely above average
.
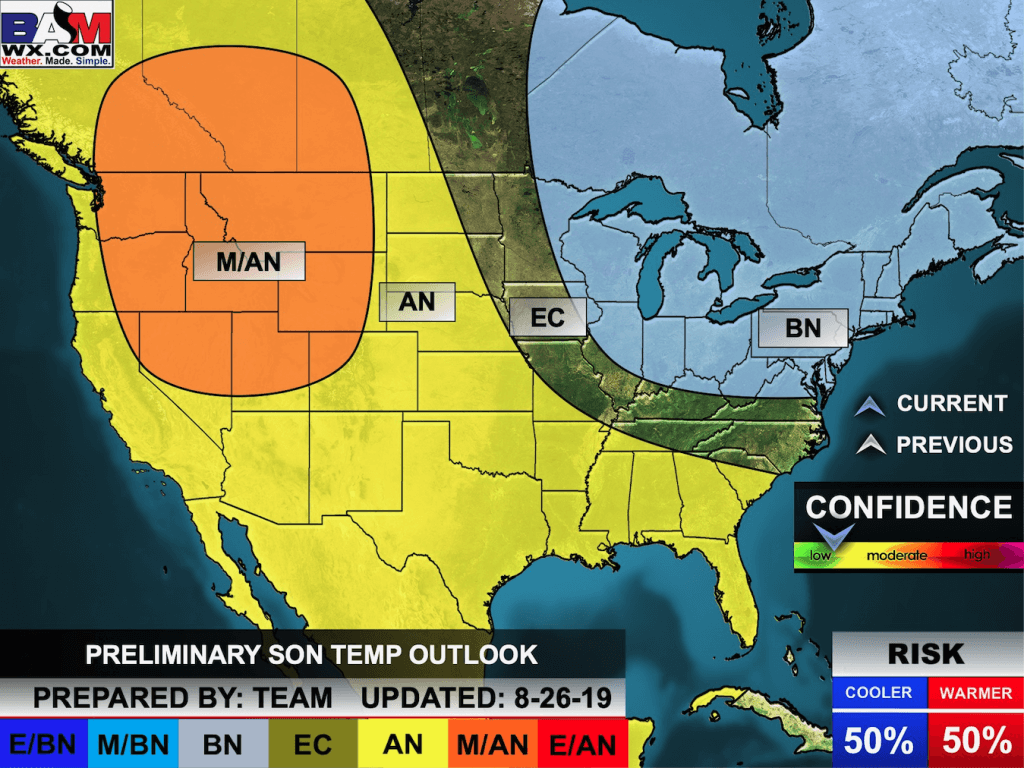
Fall Outlook
September, October, and November Temperature outlook
.
November
Click on the image to expand it.
 .
.
.
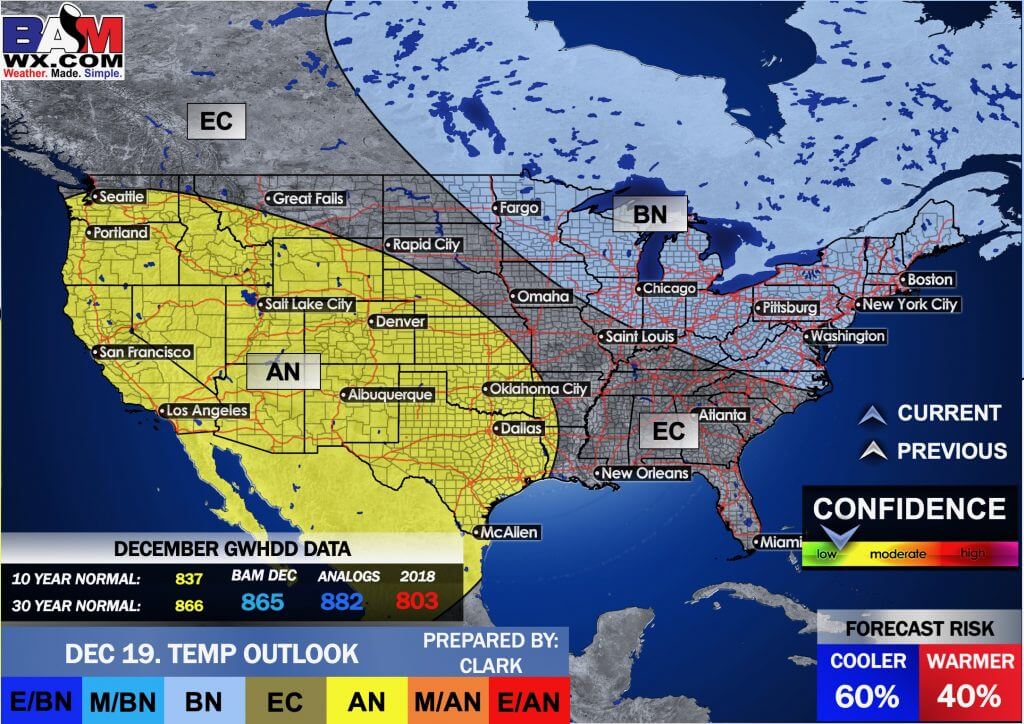
December
Click on the image to expand it.
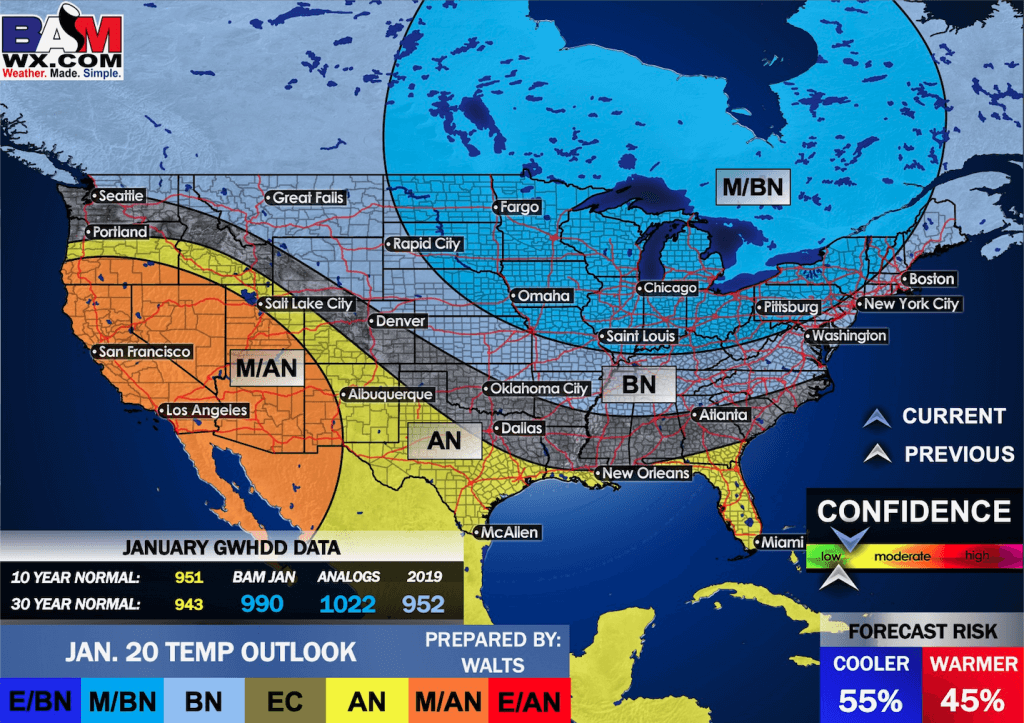
January
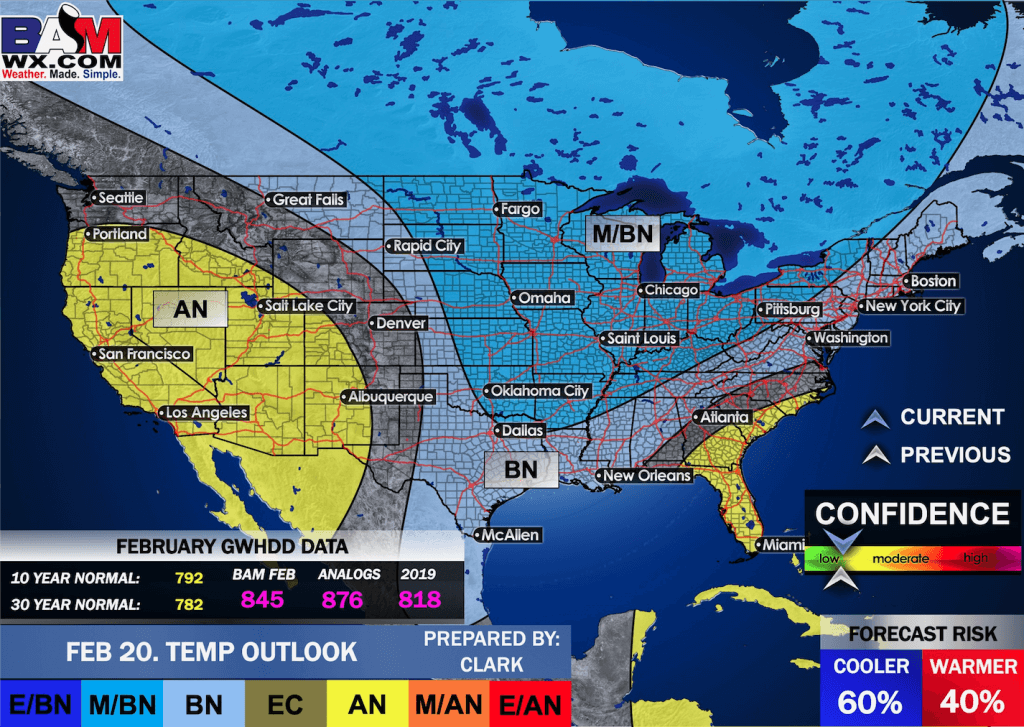
February
March
Click here if you would like to return to the top of the page..
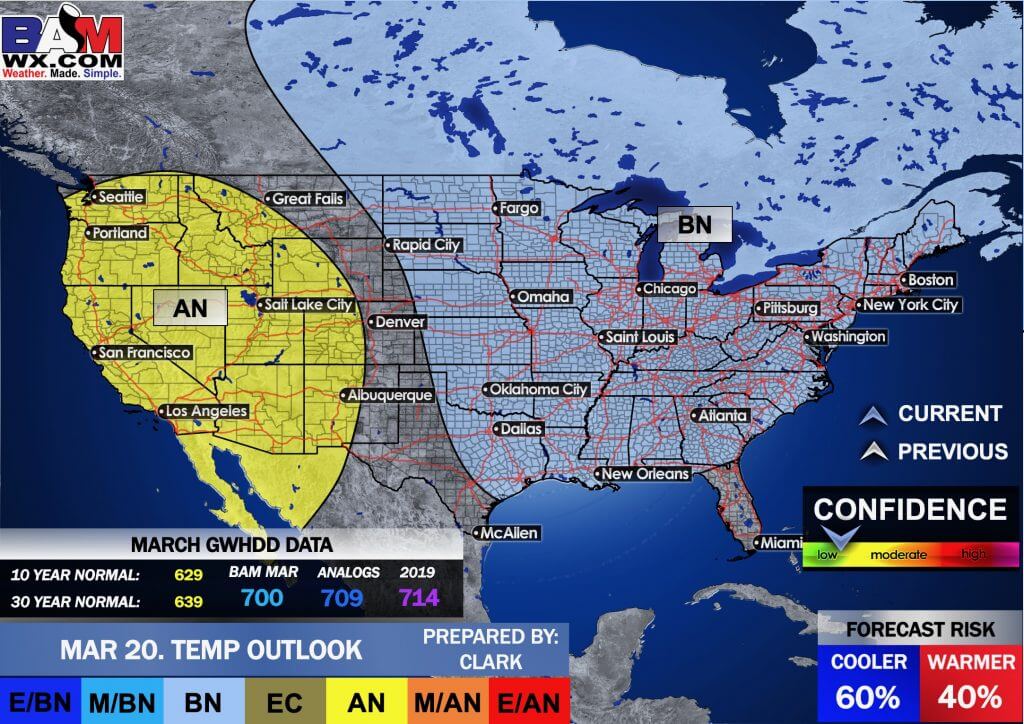
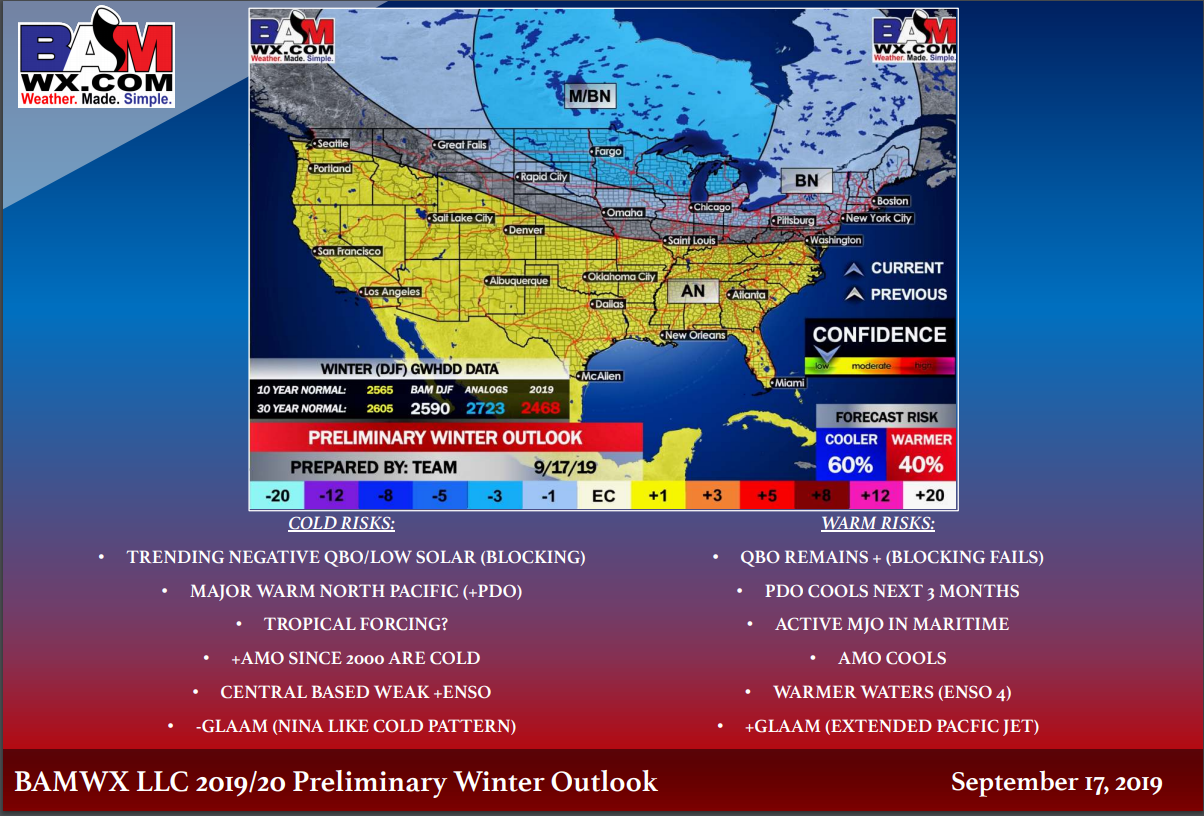
BAMwx has released its preliminary winter forecast. Keep in mind, what you really want to know is not covered in a general winter outlook. What you want to know is how much snow or ice will fall. That is not possible to predict.
The best long-range forecasters can do is to tell you above or below normal temperatures and precipitation.
This initial winter outlook indicates odds favor above-normal temperatures when everything is averaged out from November into March. That does not mean we won’t have cold weather. It just means when you average all of those months together we could end up above normal.
They indicate above-normal snowfall, as well.
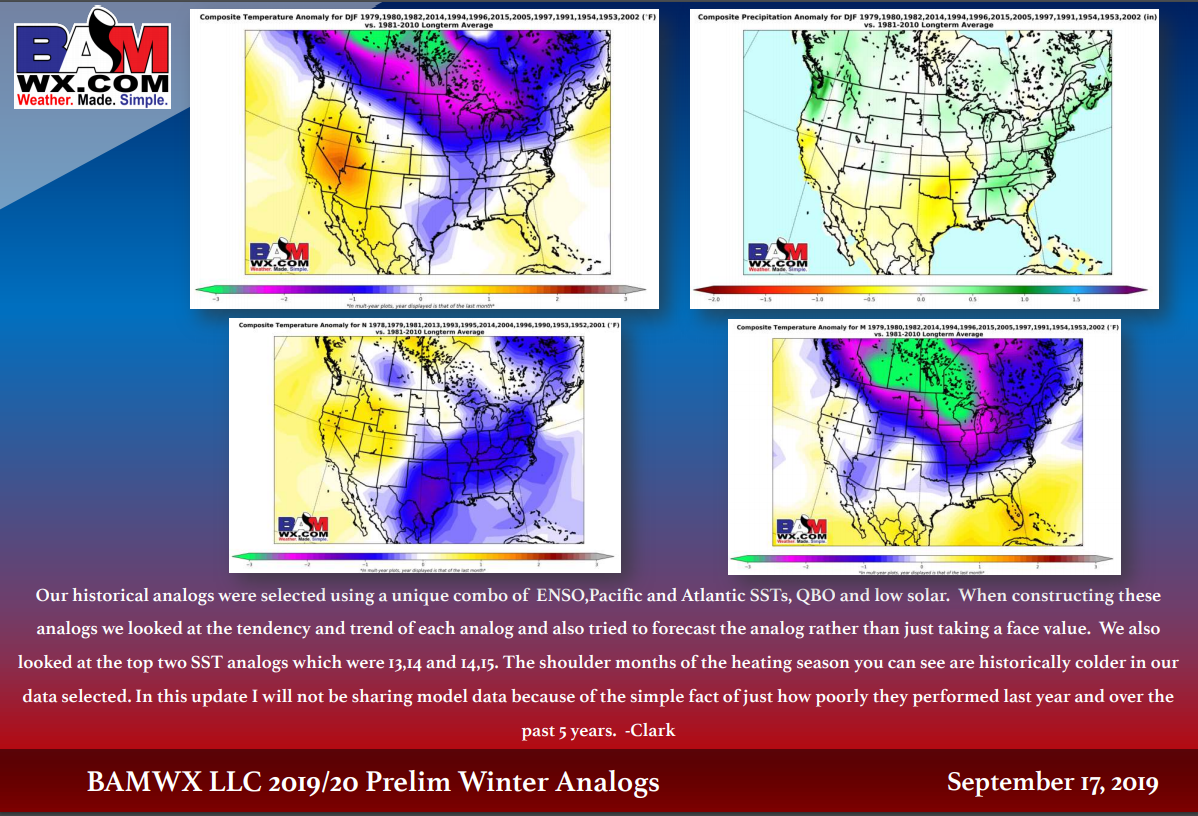
Winter analogs. BAMwx found years that have a pattern similar to what we are currently experiencing. Those are called analogs. We can compare past years with the present.
Their analogs indicate colder than normal across portions of the central and northern United States. They indicate above normal temperatures along the West Coast south and east into Texas.
Blue and purple are below normal (bright green, as well). Yellow and orange are above normal.
Winter Precipitation

Click image to enlarge
Click image to enlarge.
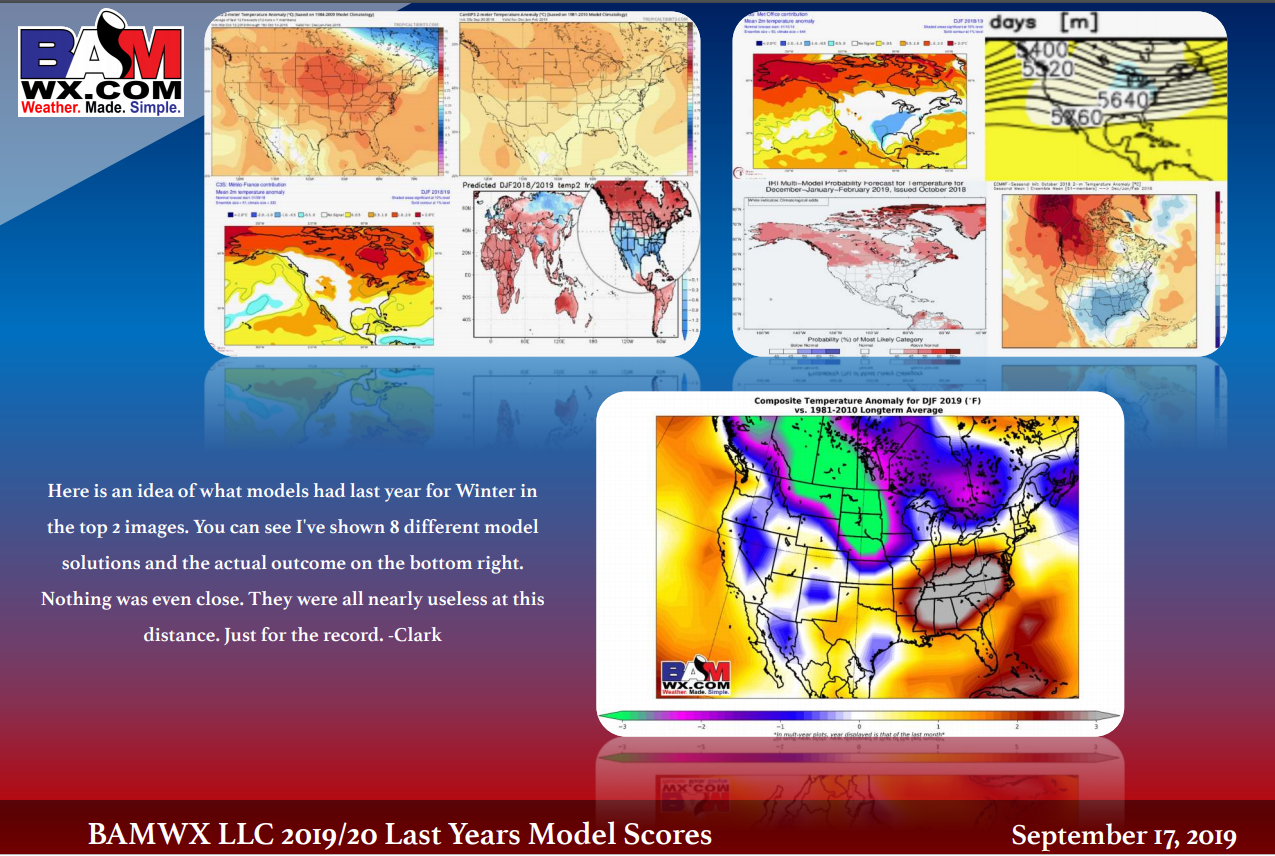
Looking back at last year. None of the models handled last year all that well.
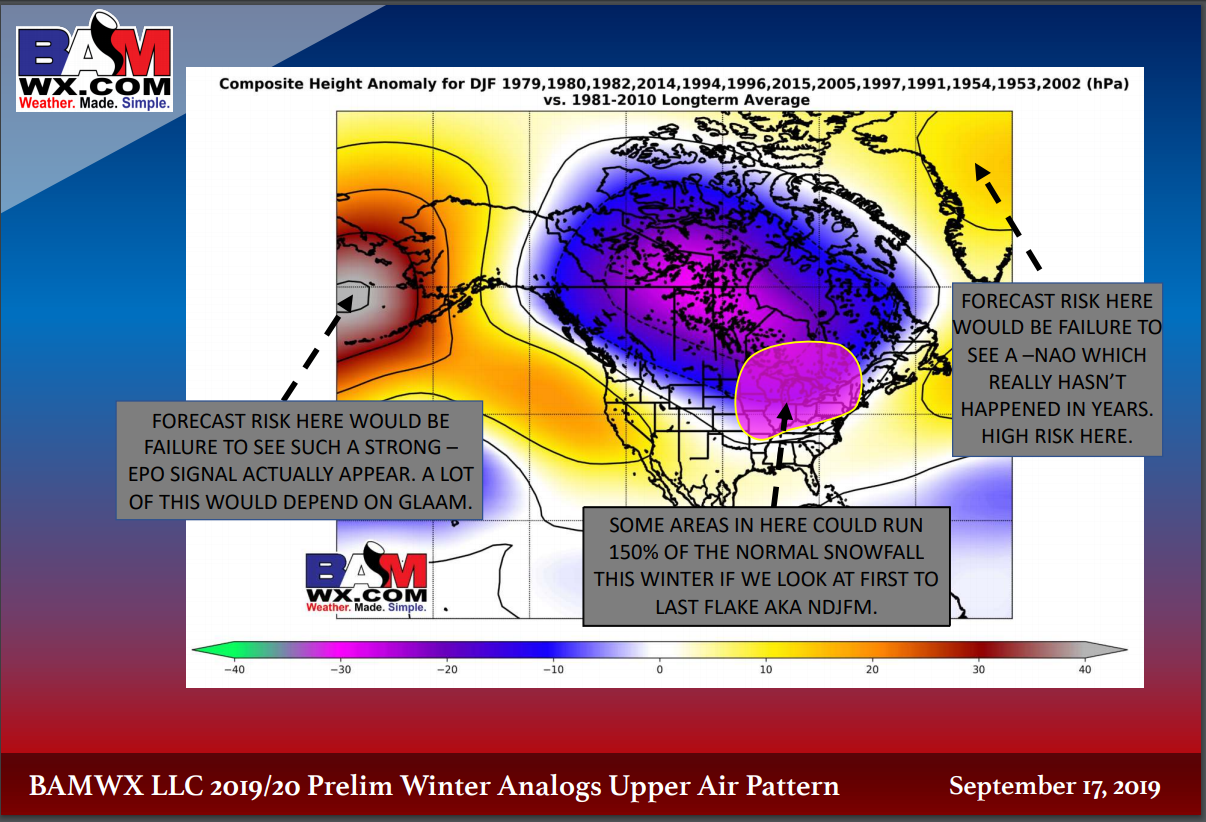
Upper air pattern.
Here is the BAMwx temperature forecast. This covers all of winter. They have us in the above normal temperature zone. Near normal just to our north. For now, they have this marked as a low confidence forecast.
Additional winter forecasts will be posted over the next couple of months. This is the preliminary outlook.
.
Radar Link: Interactive local city-view radars & regional radars.
You will find clickable warning and advisory buttons on the local city-view radars.
If the radar is not updating then try another one. If a radar does not appear to be refreshing then hit Ctrl F5. You may also try restarting your browser.
Not working? Email me at beaudodson@usawx.com
National map of weather watches and warnings. Click here.
Storm Prediction Center. Click here.
Weather Prediction Center. Click here.
.

Live lightning data: Click here.
.
Interactive GOES R satellite. Track clouds. Click here.
GOES 16 slider tool. Click here.
College of Dupage satellites. Click here
.

Here are the latest local river stage forecast numbers Click Here.
Here are the latest lake stage forecast numbers for Kentucky Lake and Lake Barkley Click Here.
.
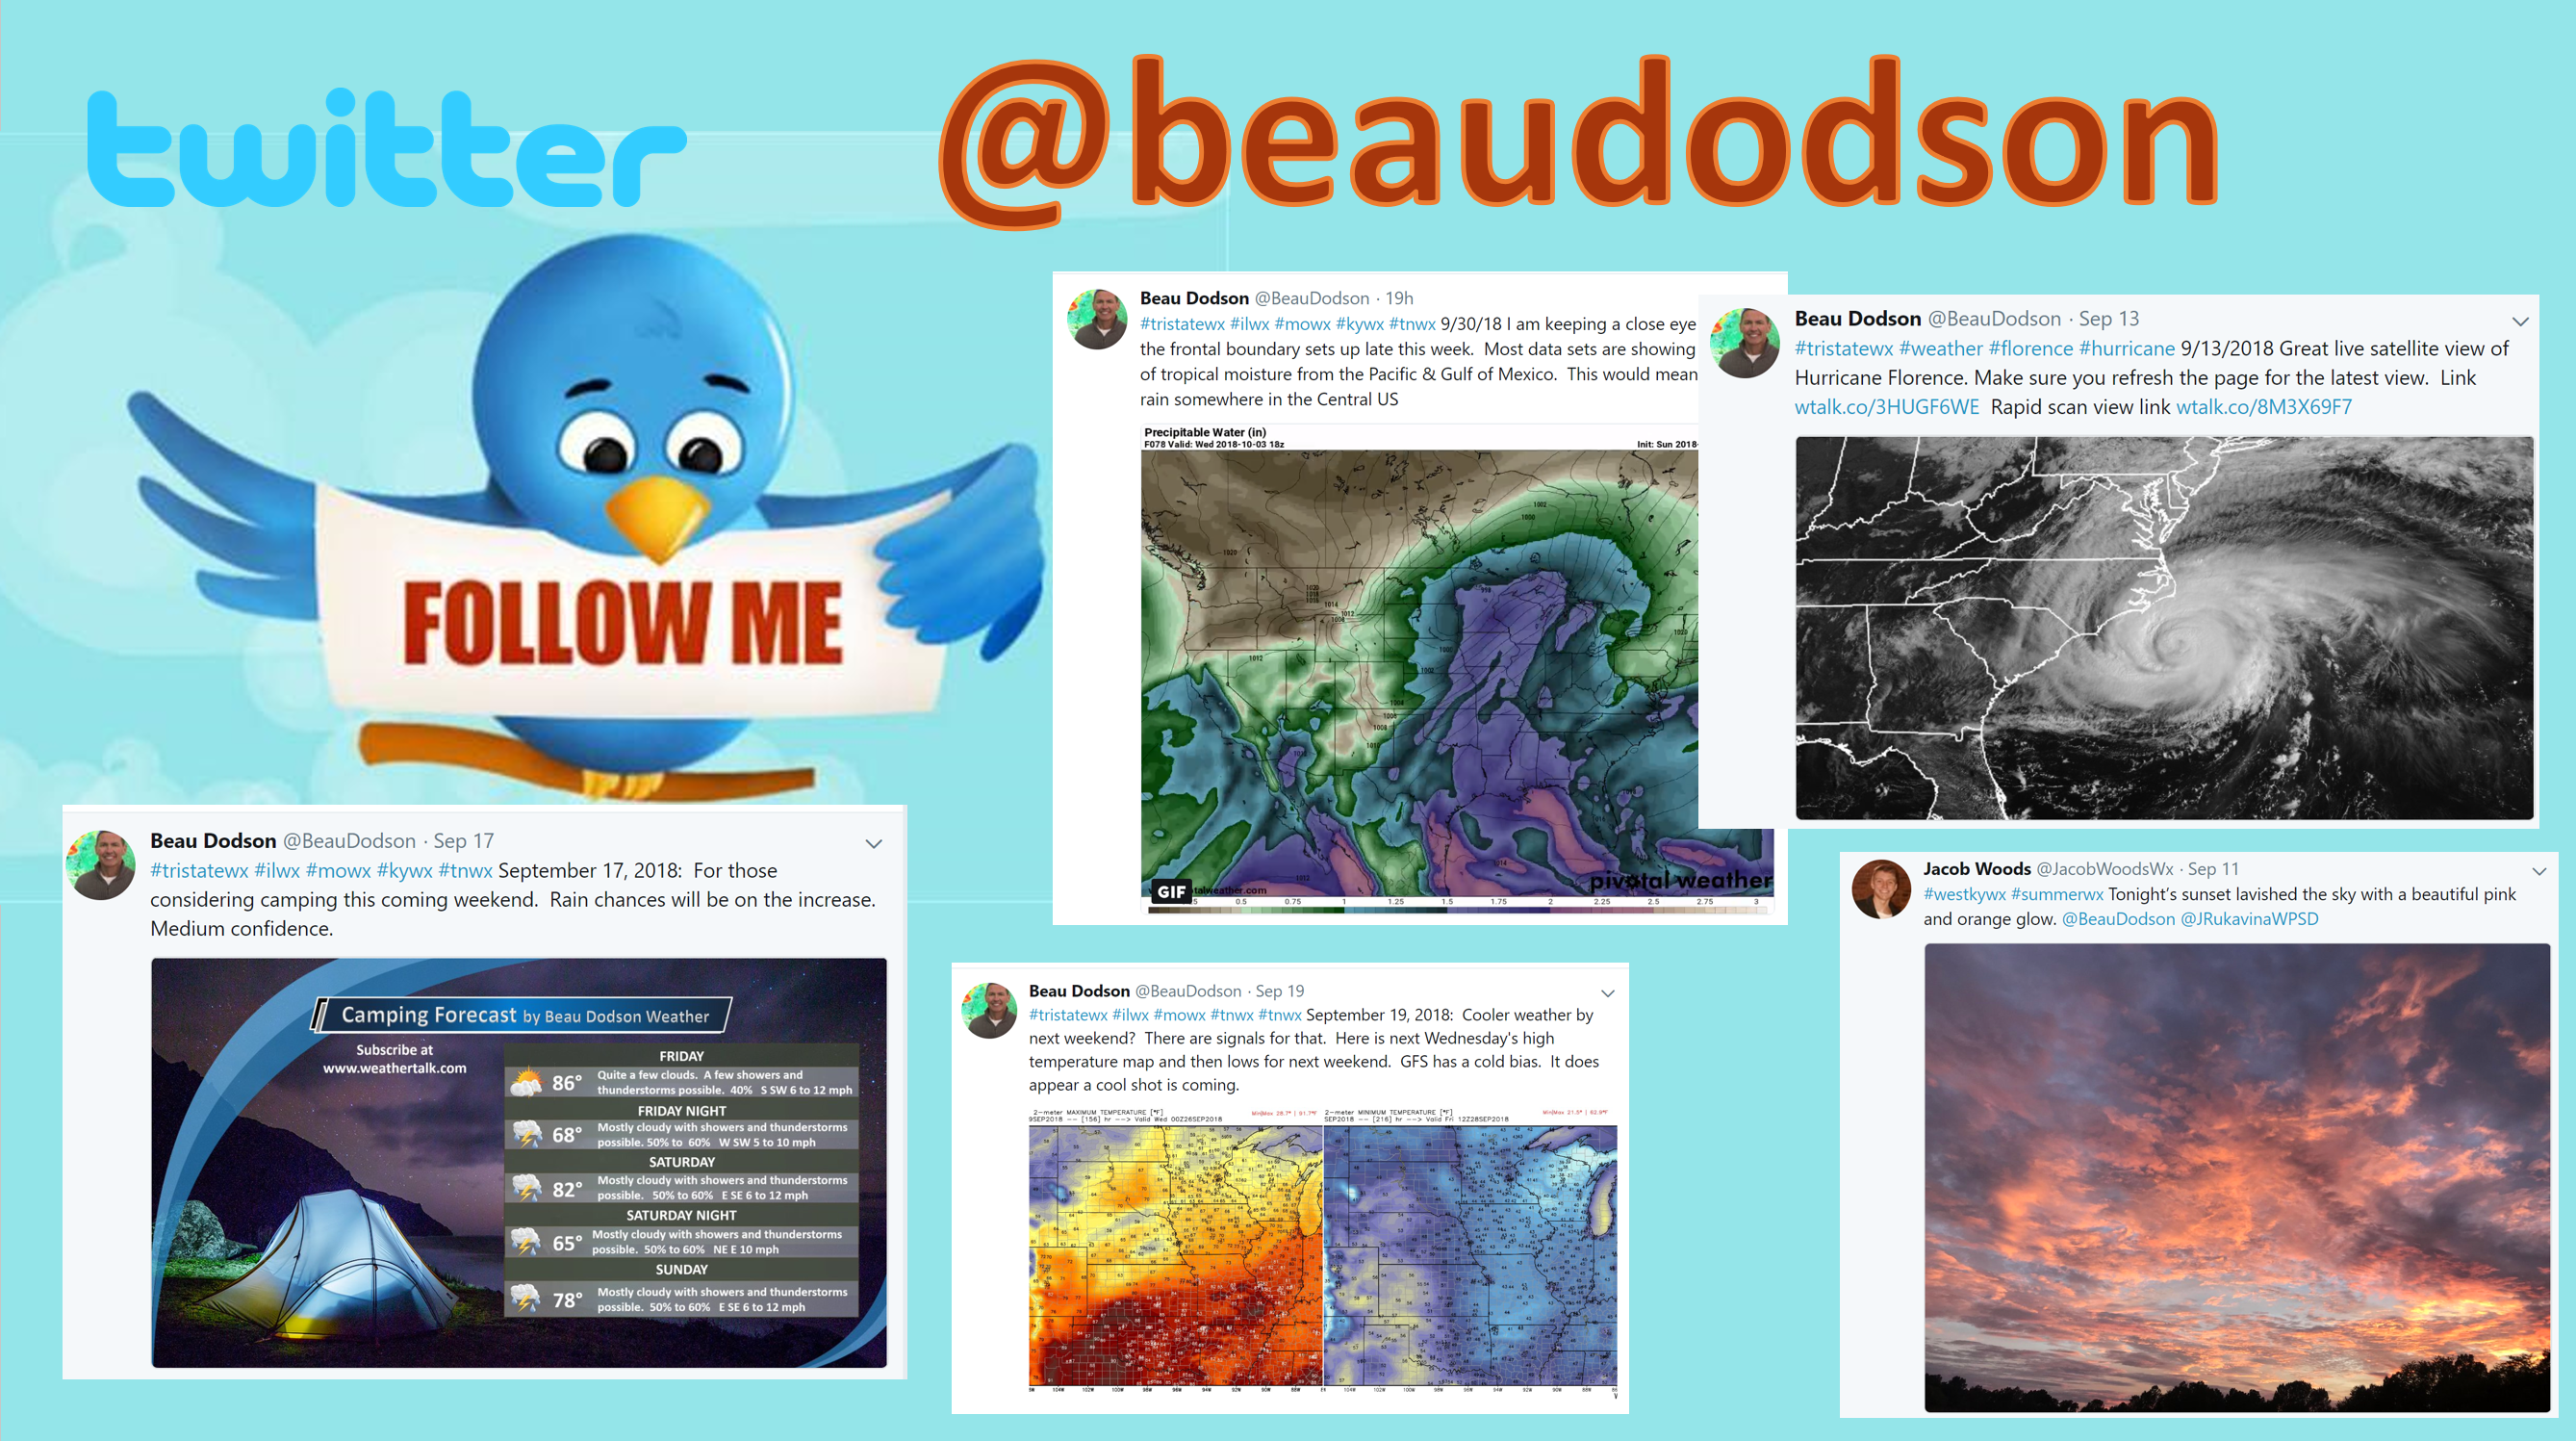
Did you know that you can find me on Twitter? Click here to view my Twitter weather account.
.
.
Who do you trust for your weather information and who holds them accountable?
I have studied the weather in our region since the late 1970s. I have 40 years of experience in observing our regions weather patterns.
My degree is in Broadcast Meteorology from Mississippi State University and a Bachelor of Science (BS).
I am an NOAA Weather-Ready Nation Ambassador. I am the Meteorologist for McCracken County rescue squad. When asked, I assist Ballard and Massac Counties, as well.
I own and operate the Southern Illinois Weather Observatory and WeatherTalk LLC.
There is a lot of noise on the internet. Over time you should learn who to trust for your weather information.
My forecast philosophy is simple and straight forward.
- Communicate in simple terms
- To be as accurate as possible within a reasonable time frame before an event
- Interact with you on Twitter, Facebook, and the blog
- Minimize the “hype” that you might see on television or through other weather sources
- Push you towards utilizing wall-to-wall LOCAL TV coverage during severe weather events
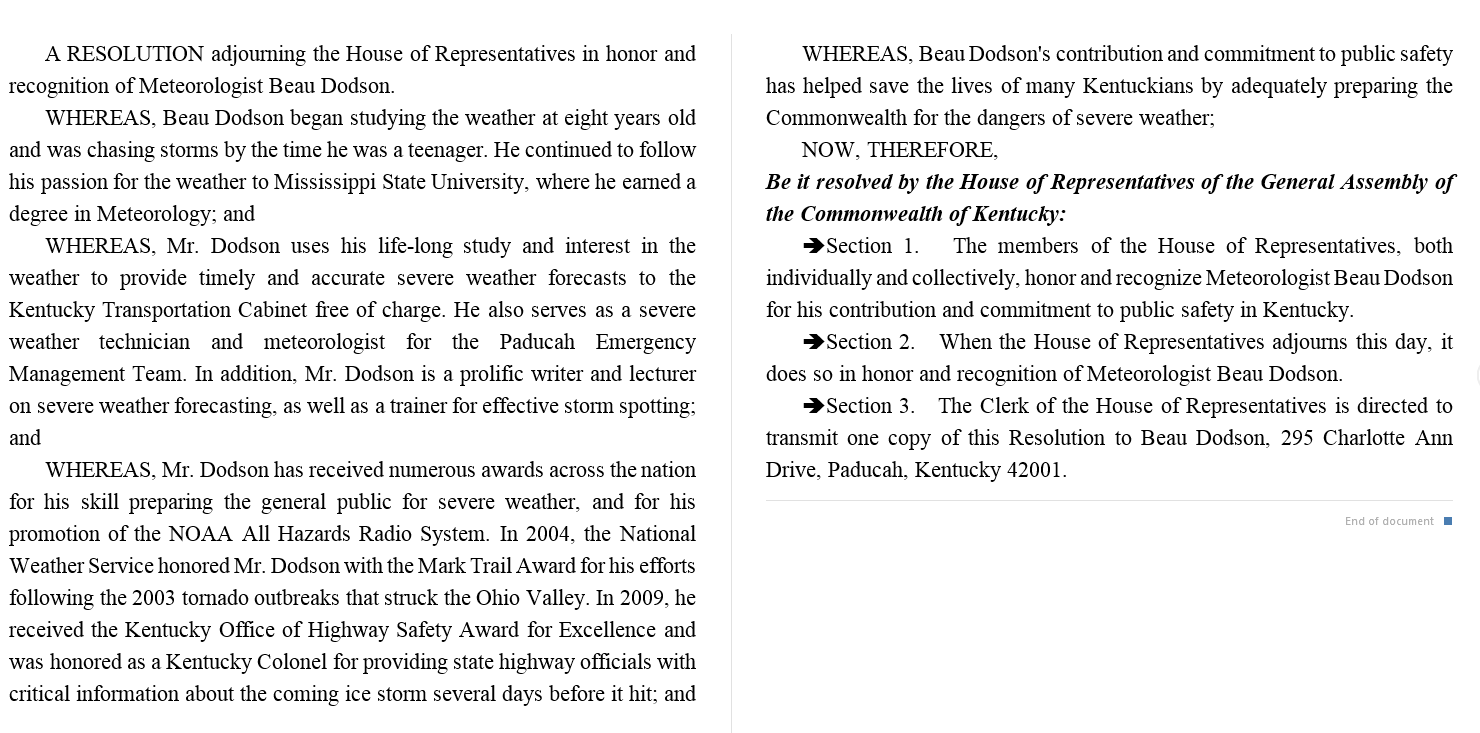
I am a recipient of the Mark Trail Award, WPSD Six Who Make A Difference Award, Kentucky Colonel, and the Caesar J. Fiamma” Award from the American Red Cross.
In 2009 I was presented with the Kentucky Office of Highway Safety Award.
I was recognized by the Kentucky House of Representatives for my service to the State of Kentucky leading up to several winter storms and severe weather outbreaks.
If you click on the image below you can read the Kentucky House of Representatives Resolution.
.
![]()
A new weather podcast is now available! Weather Geeks (which you might remember is on The Weather Channel each Sunday)
.
Tonight’s Guest WeatherBrain #1 is the Director of the Oklahoma Chronological Survey. He is also an Associate Professor in the College of Atmospheric and Geographic Sciences at the University of Oklahoma. Dr. Kevin Kloesel, welcome to WeatherBrains!
Tonight’s Guest WeatherBrain #2 is the President of Thor Guard Inc., a manufacturer of integrated lightning warning, lightning prediction, and internet-delivered weather systems. Bob Dugan, welcome to WeatherBrains!
Other discussions in this weekly podcast include topics like:
- Dallas tornado/severe coverage controversy
- Astronomy Report with Tony Rice
- National Weather Round-Up
- and more!
.
Previous episodes can be viewed by clicking here.
.
Find Beau on Facebook! Click the banner.
.
Find Beau on Twitter! Share your weather photos! @beaudodson

Click here if you would like to return to the top of the page.
Did you know that a portion of your monthly subscription helps support local charity projects? Not a subscriber? Becoming one at www.weathertalk.com
You can learn more about those projects by visiting the Shadow Angel Foundation website and the Beau Dodson News website.