


.

.
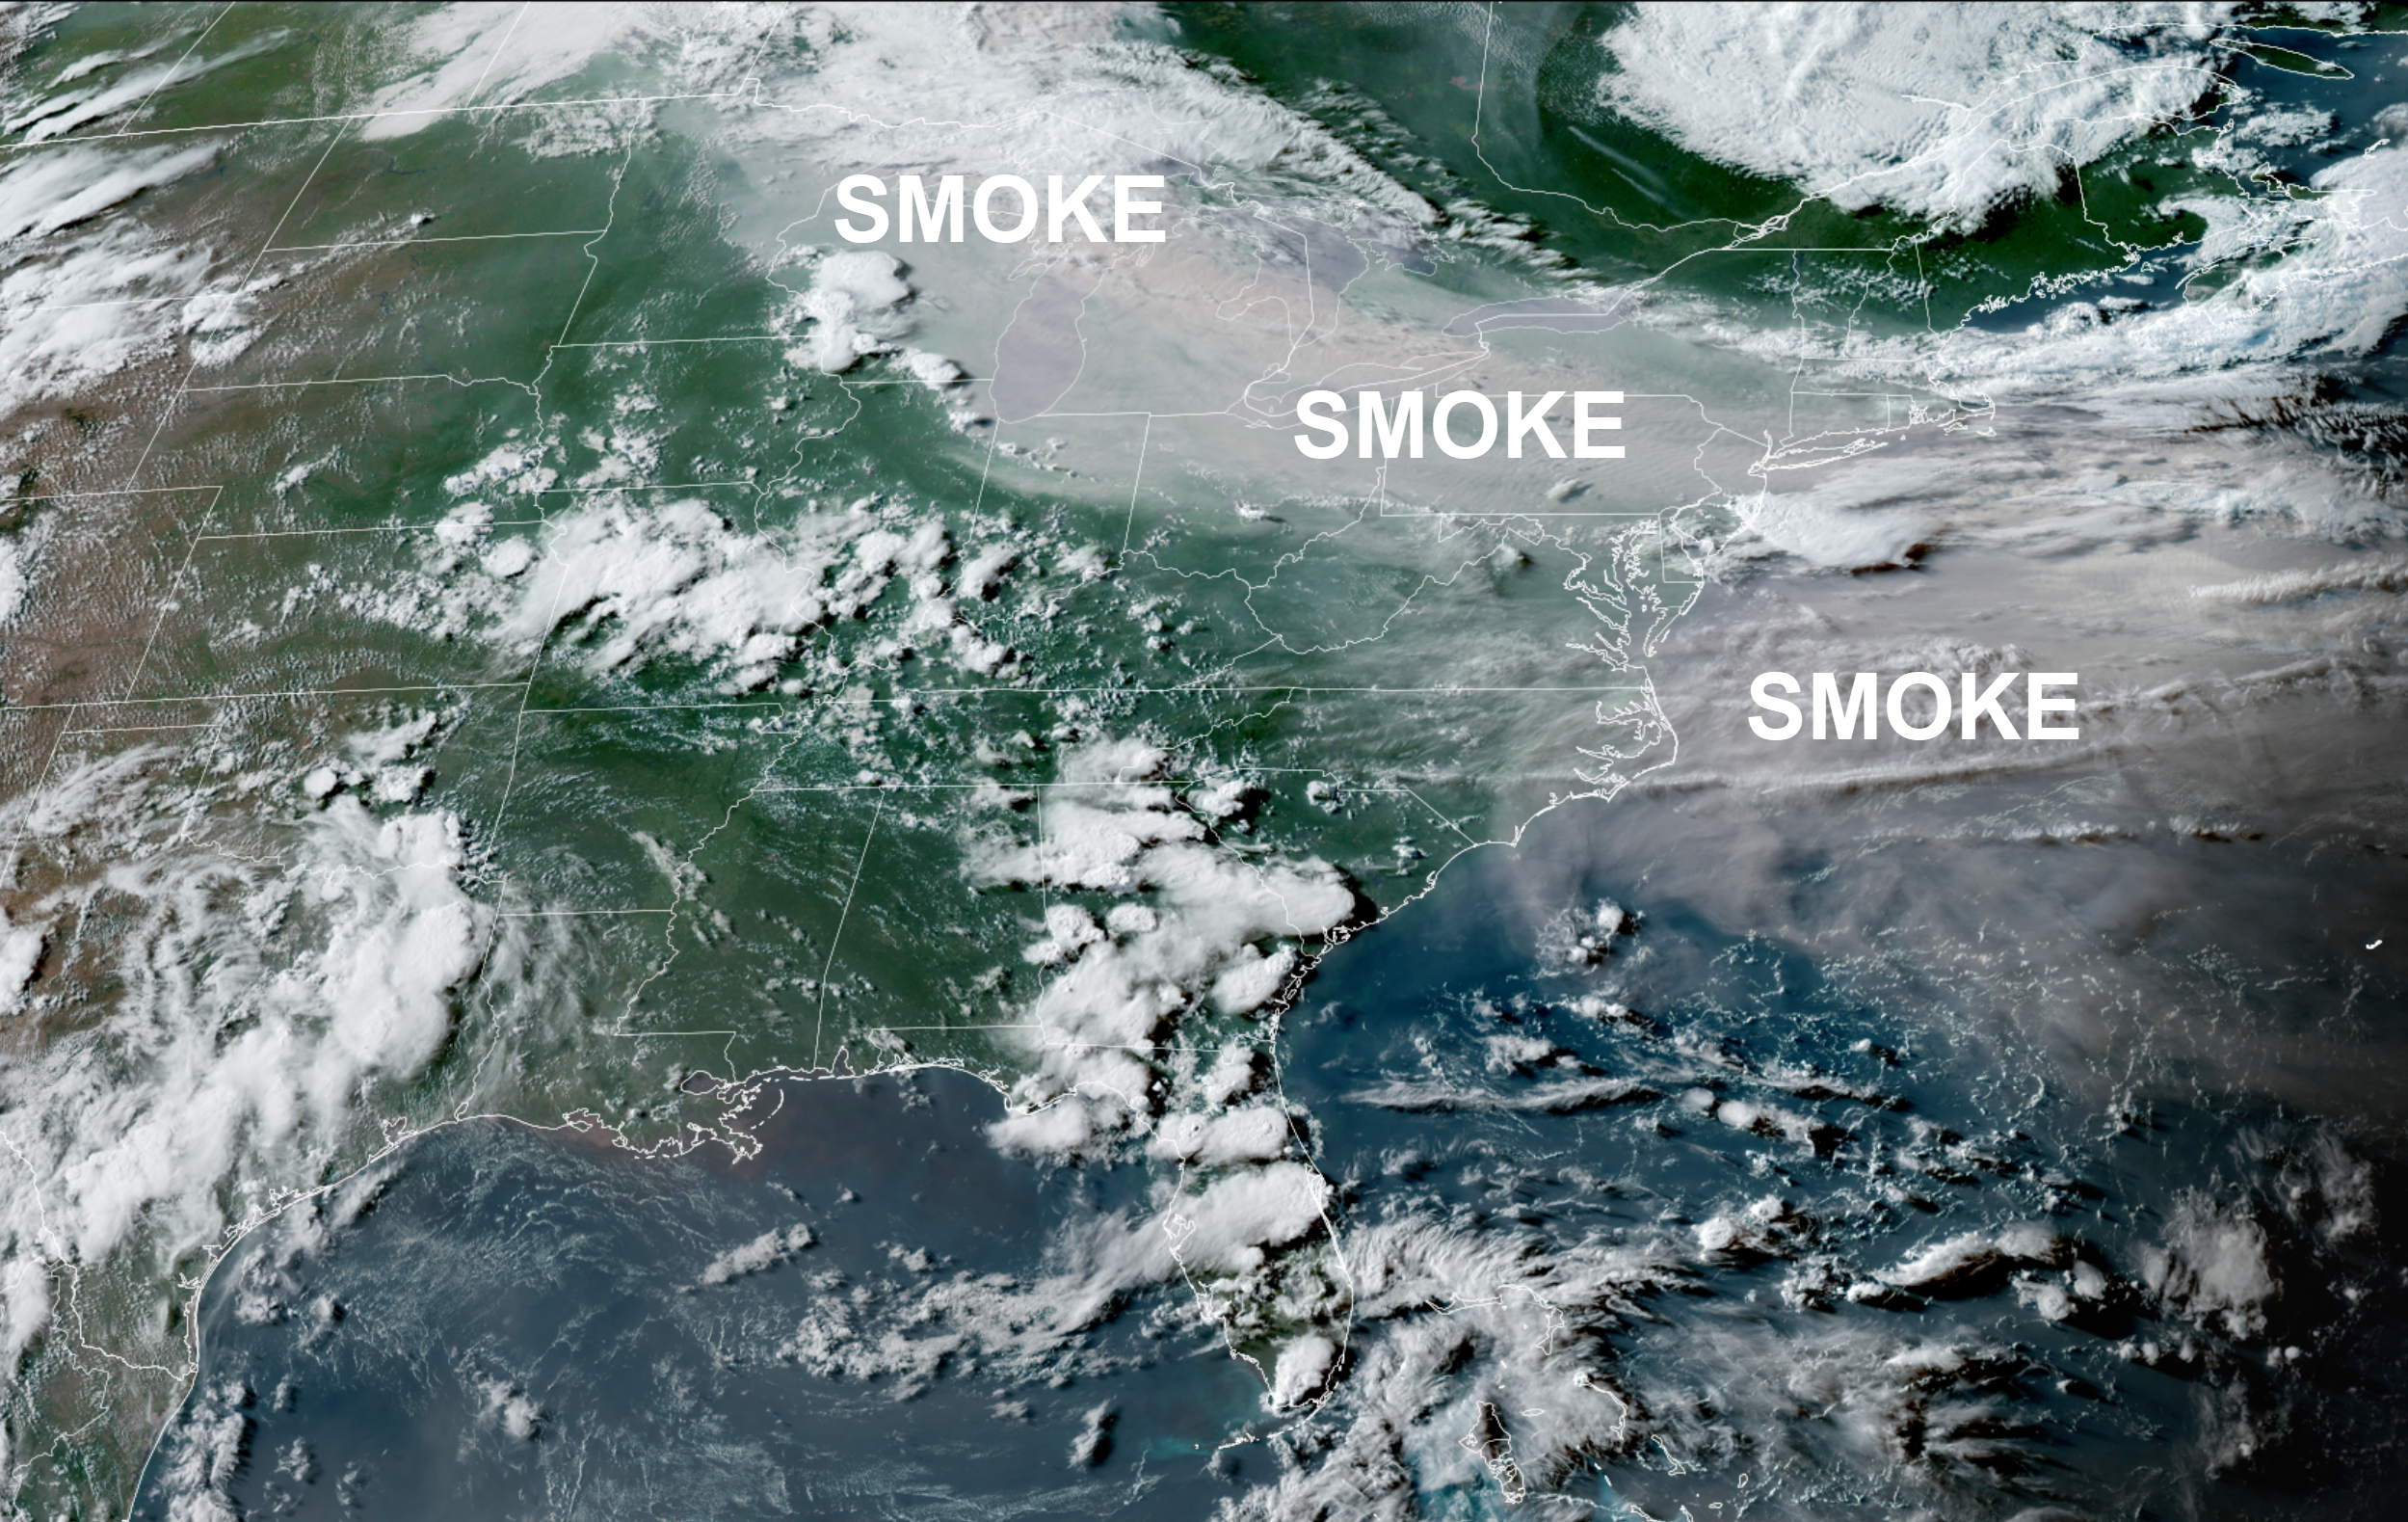
Key Seven-Day Weather Information
.
.
.

🌪️ Seven-Day Tornado and Severe Weather Outlook ⛈️
July 17th through July 23rd.
A severe thunderstorm is defined as a storm that produces 58 mph wind gusts and quarter-sized hail or larger.
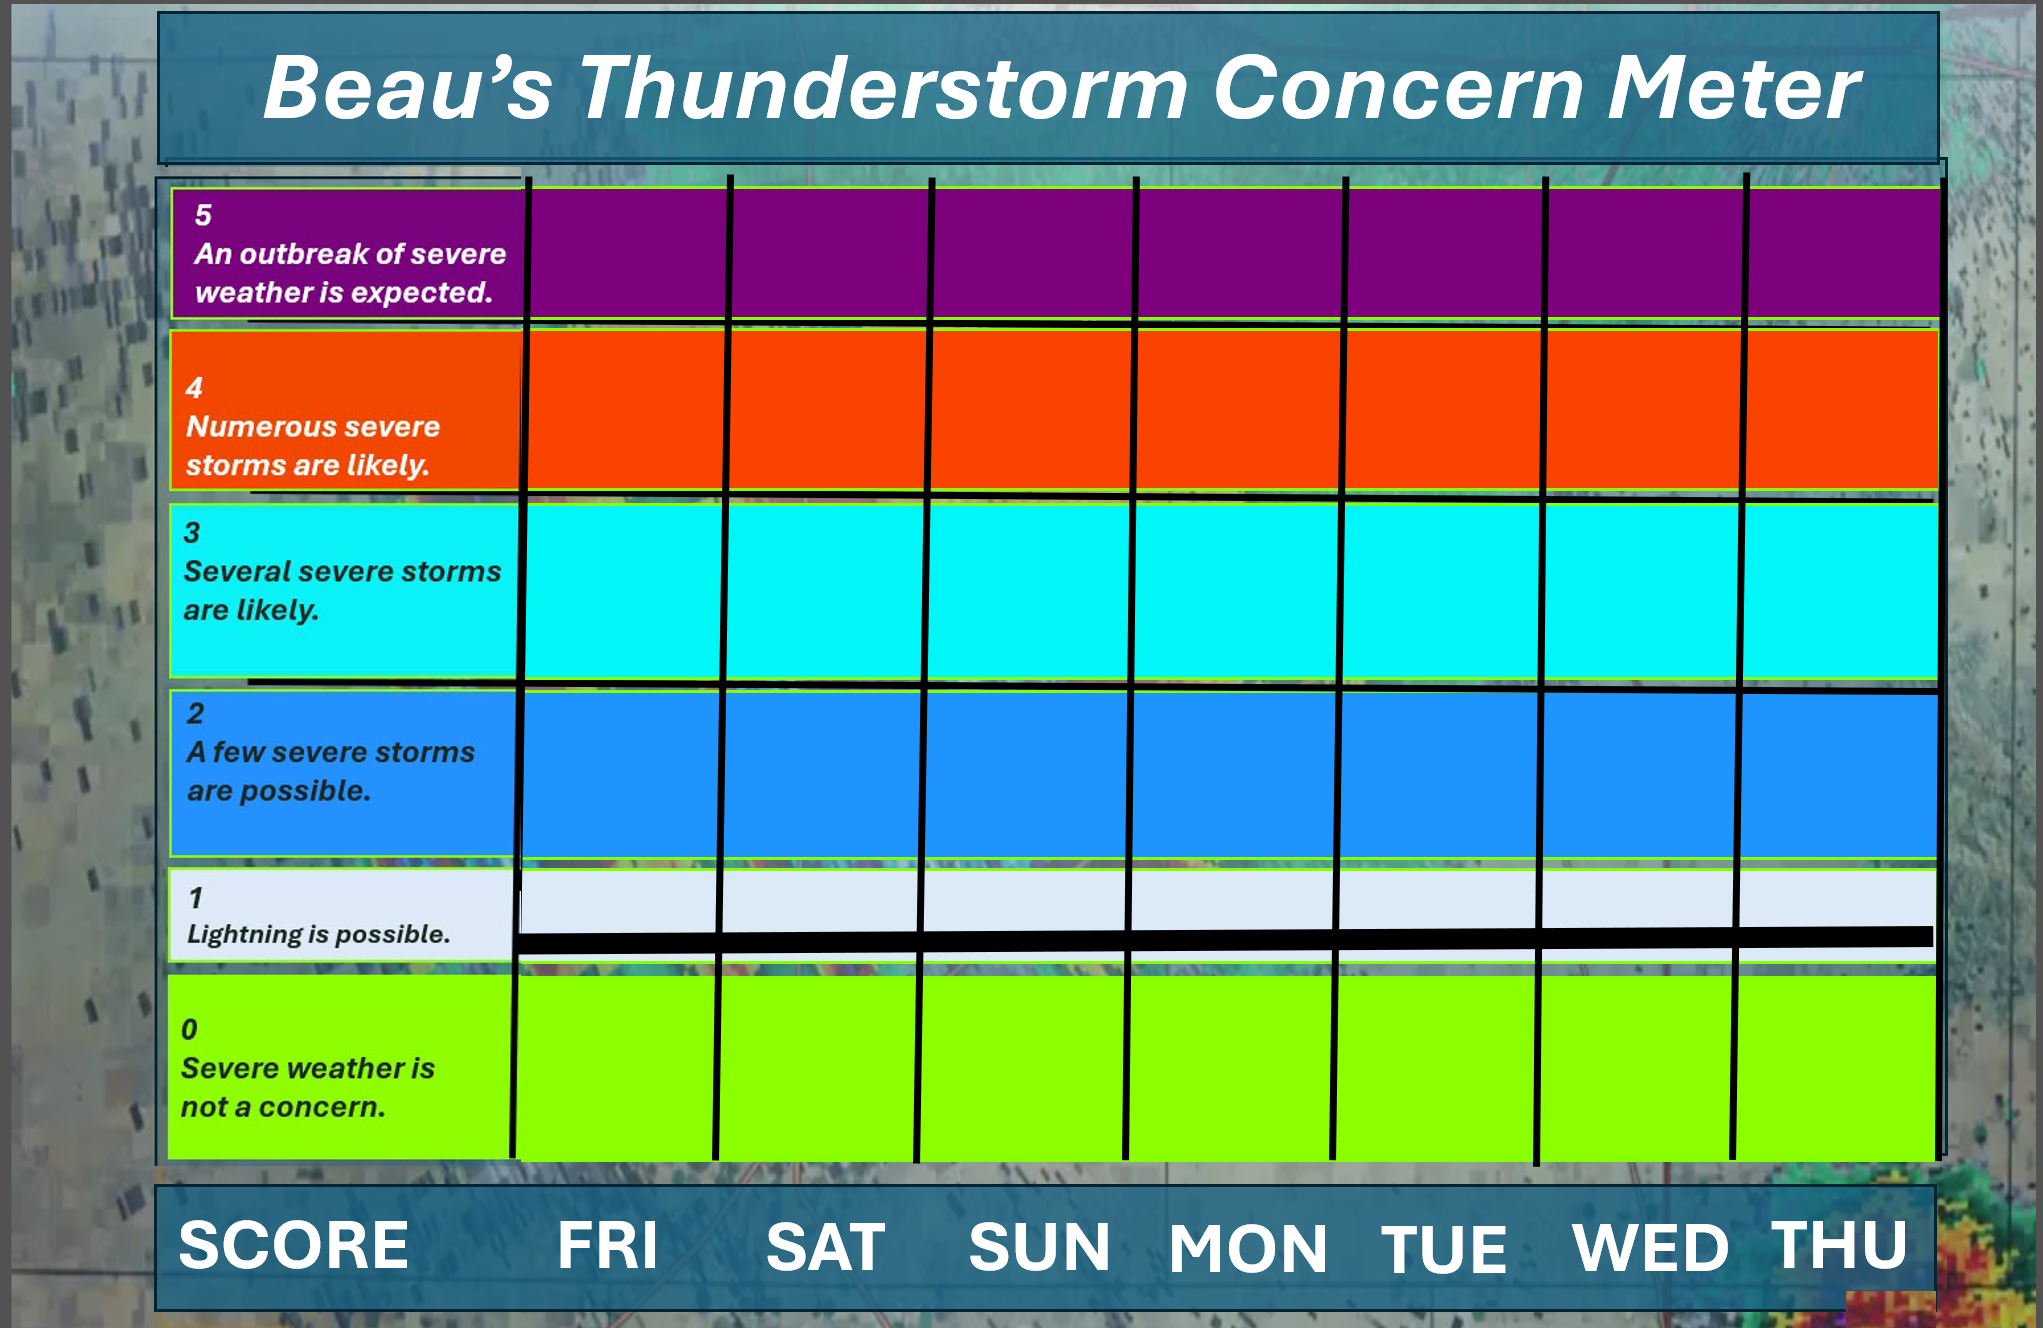
⛈️ Current severe weather risk: MONITOR. I will keep an eye on next Tuesday.
🌪️ Current tornado risk: NO.
🌪️ Current confidence level in the tornado forecast: HIGH.
Here is my weekly thunderstorm concern meter.
.

Seven-Day Hazardous Weather Outlook
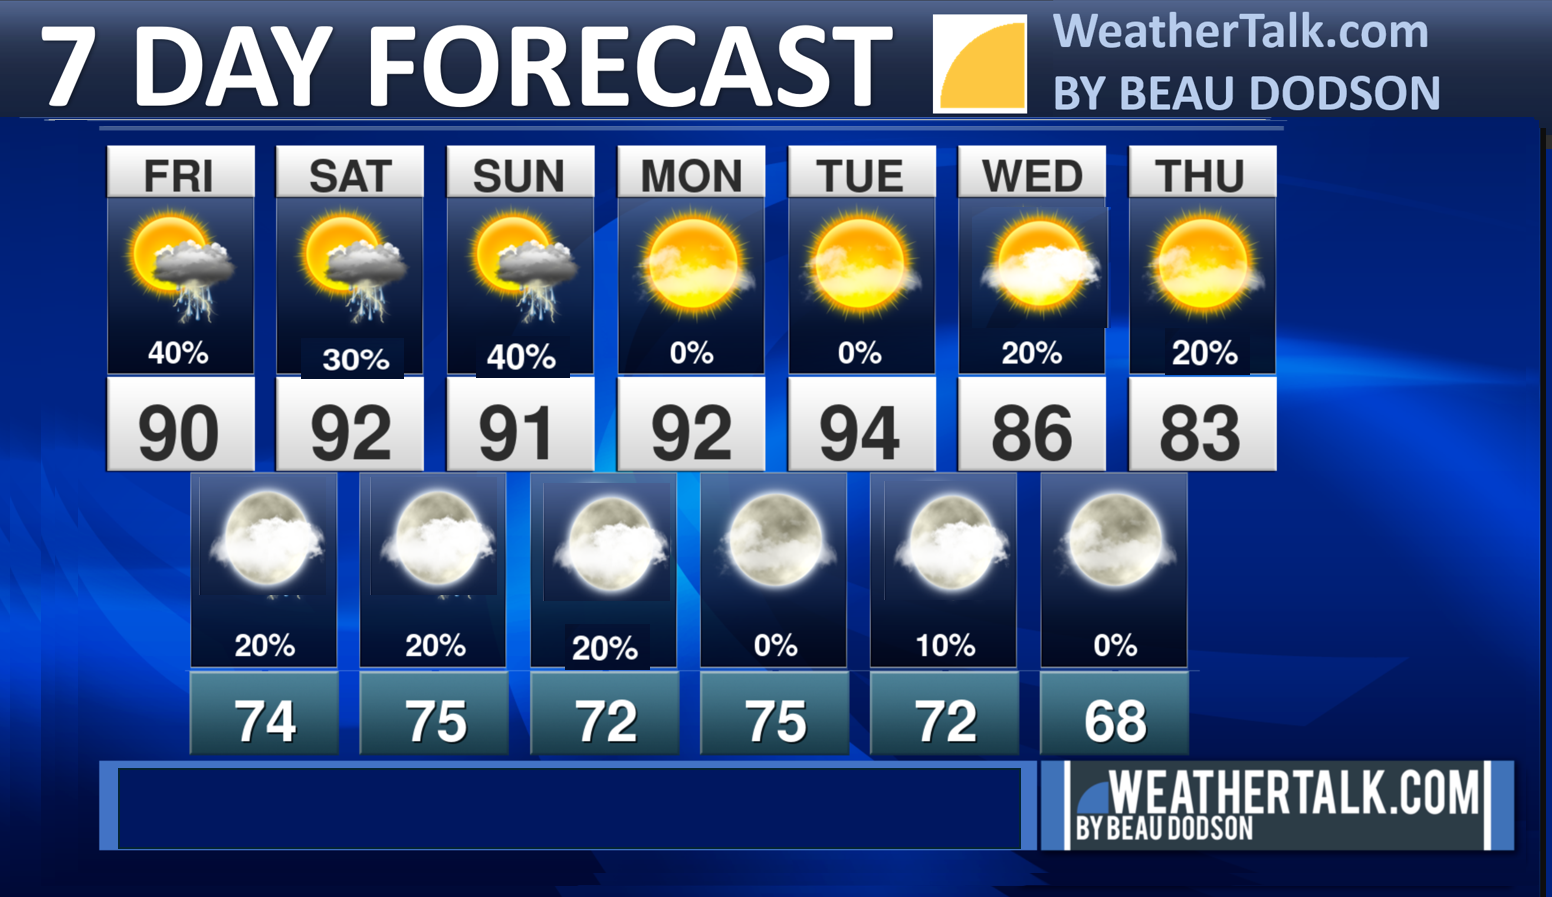
1. Is lightning in the forecast? YES. Scattered lightning risk this week. Chances may increase again towards the middle of next week.
2. Is flash flooding in the forecast? LOW RISK. Slow-moving summer thunderstorms can produce pockets of heavy rain. These rains could briefly overwhelm drainage systems. Typical for summer.
3. Will non-thunderstorm winds top 40 mph? NO.
4. Will the temperature rise above 90 degrees? YES. Scattered into early next week. It appears a bit cooler air is possible towards the middle of next week.
5. Is the heat index forecast to rise above 100 degrees? POSSIBLE. Scattered this weekend. Away from clouds and precip. Heat index values could hover around 100 degrees. Perhaps a bit higher.
6. Is the heat index forecast to rise above 110 degrees? NO.
.
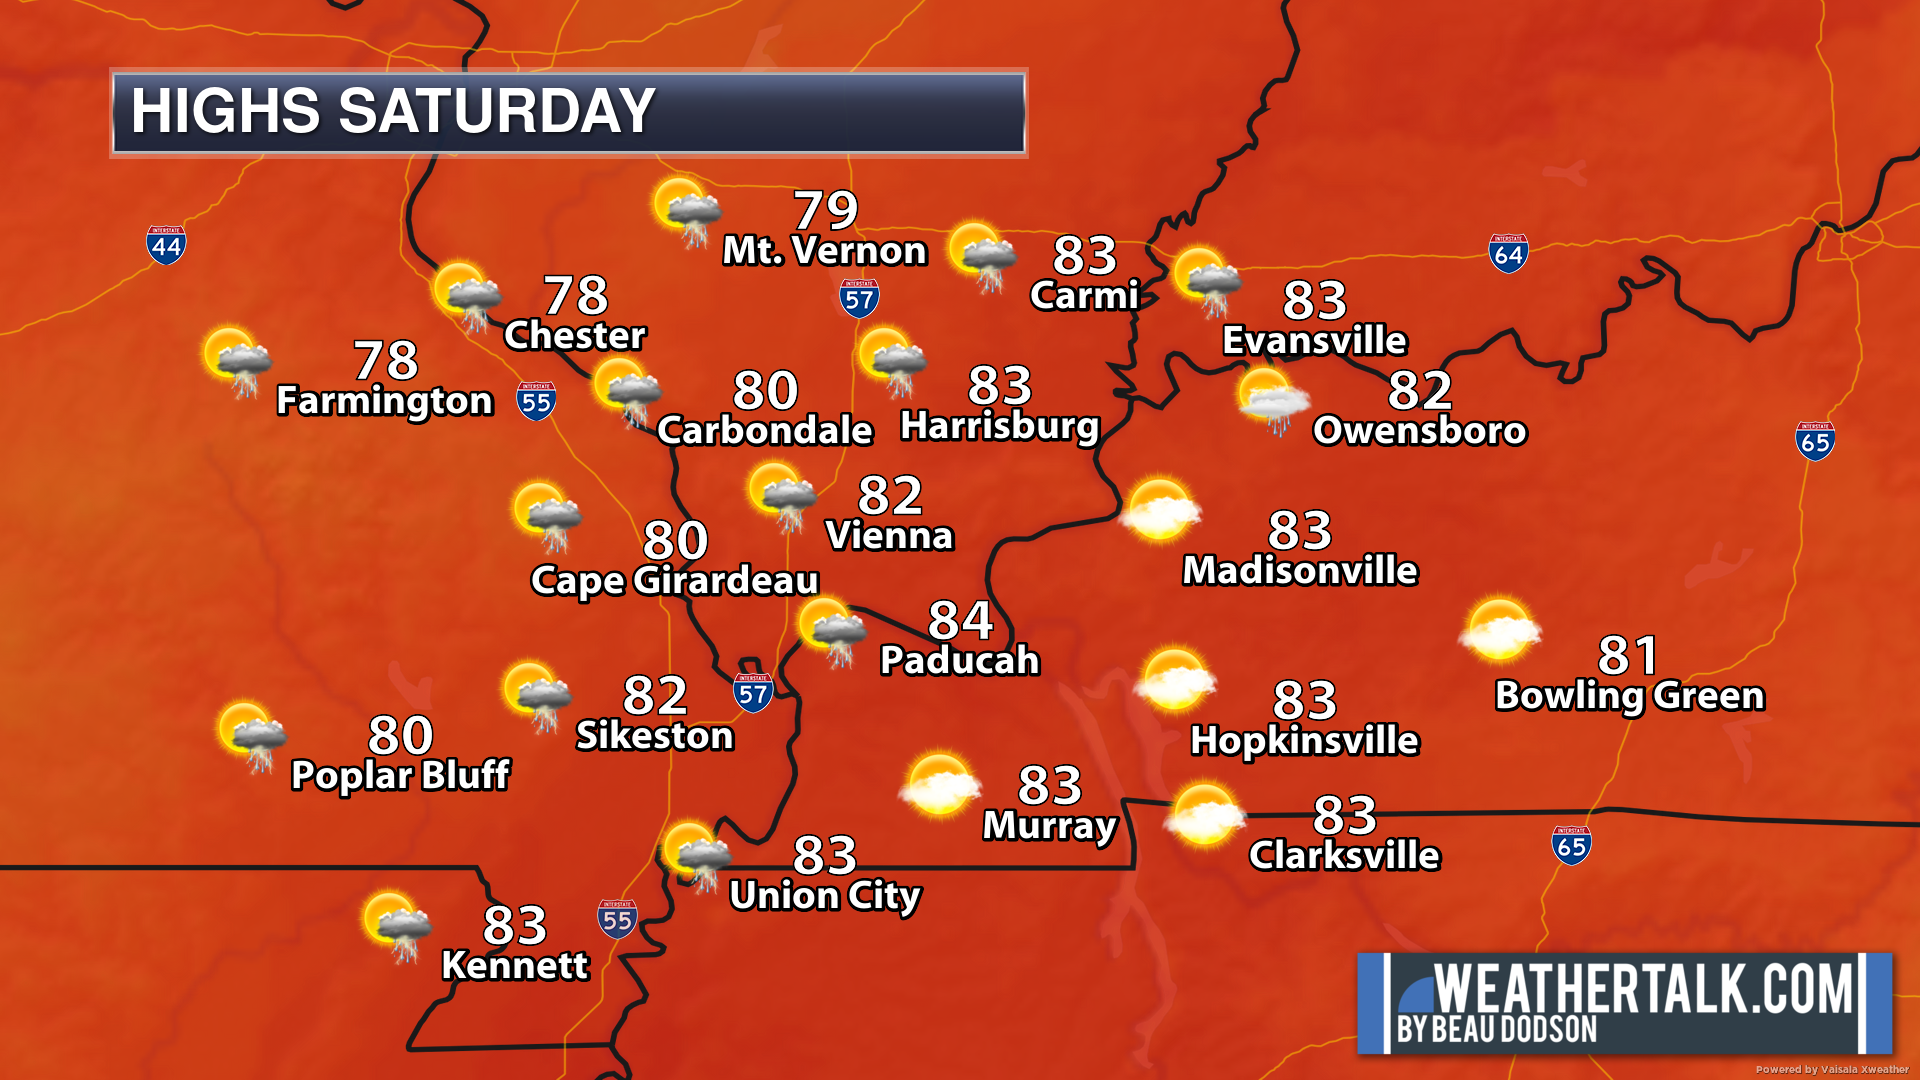
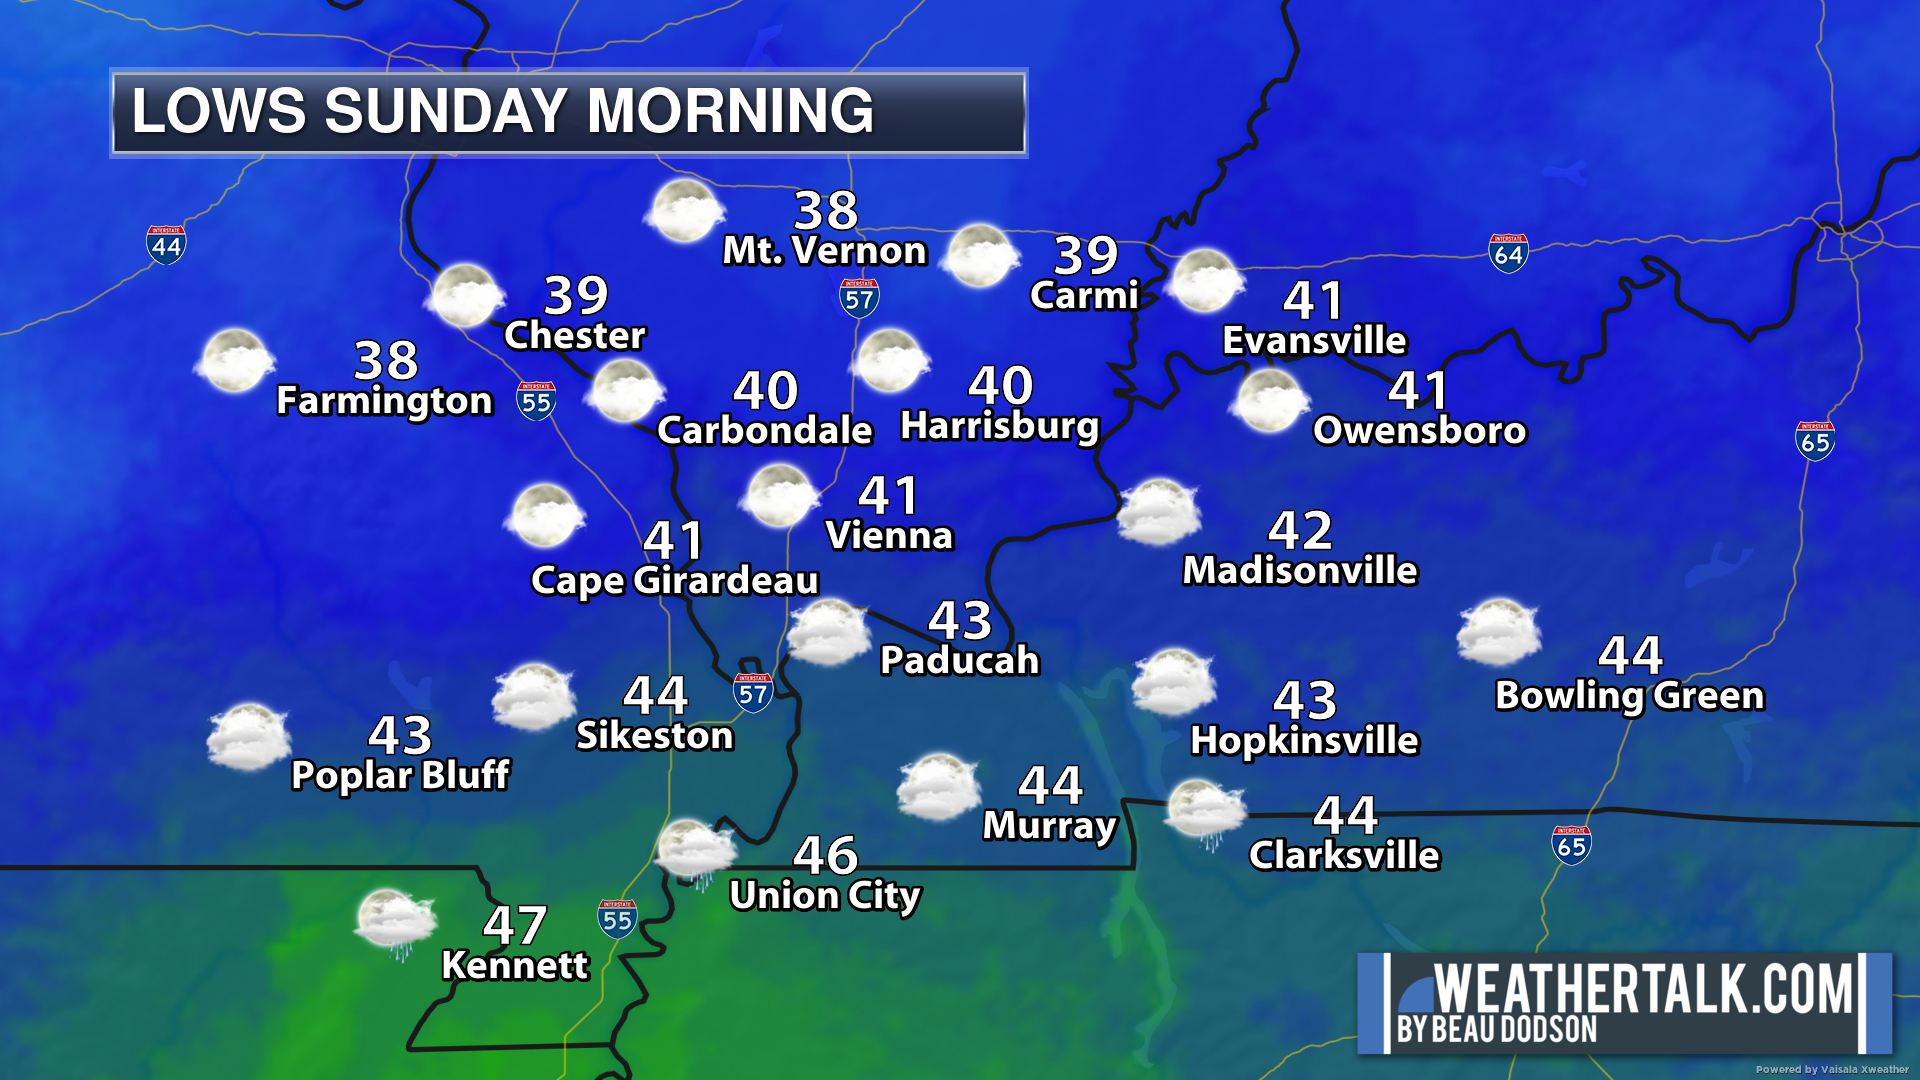
.
Seven-day outlook graphic.
This is a broad-brush overview of the entire region.
* Scroll down to see your local city rain probability maps.
.

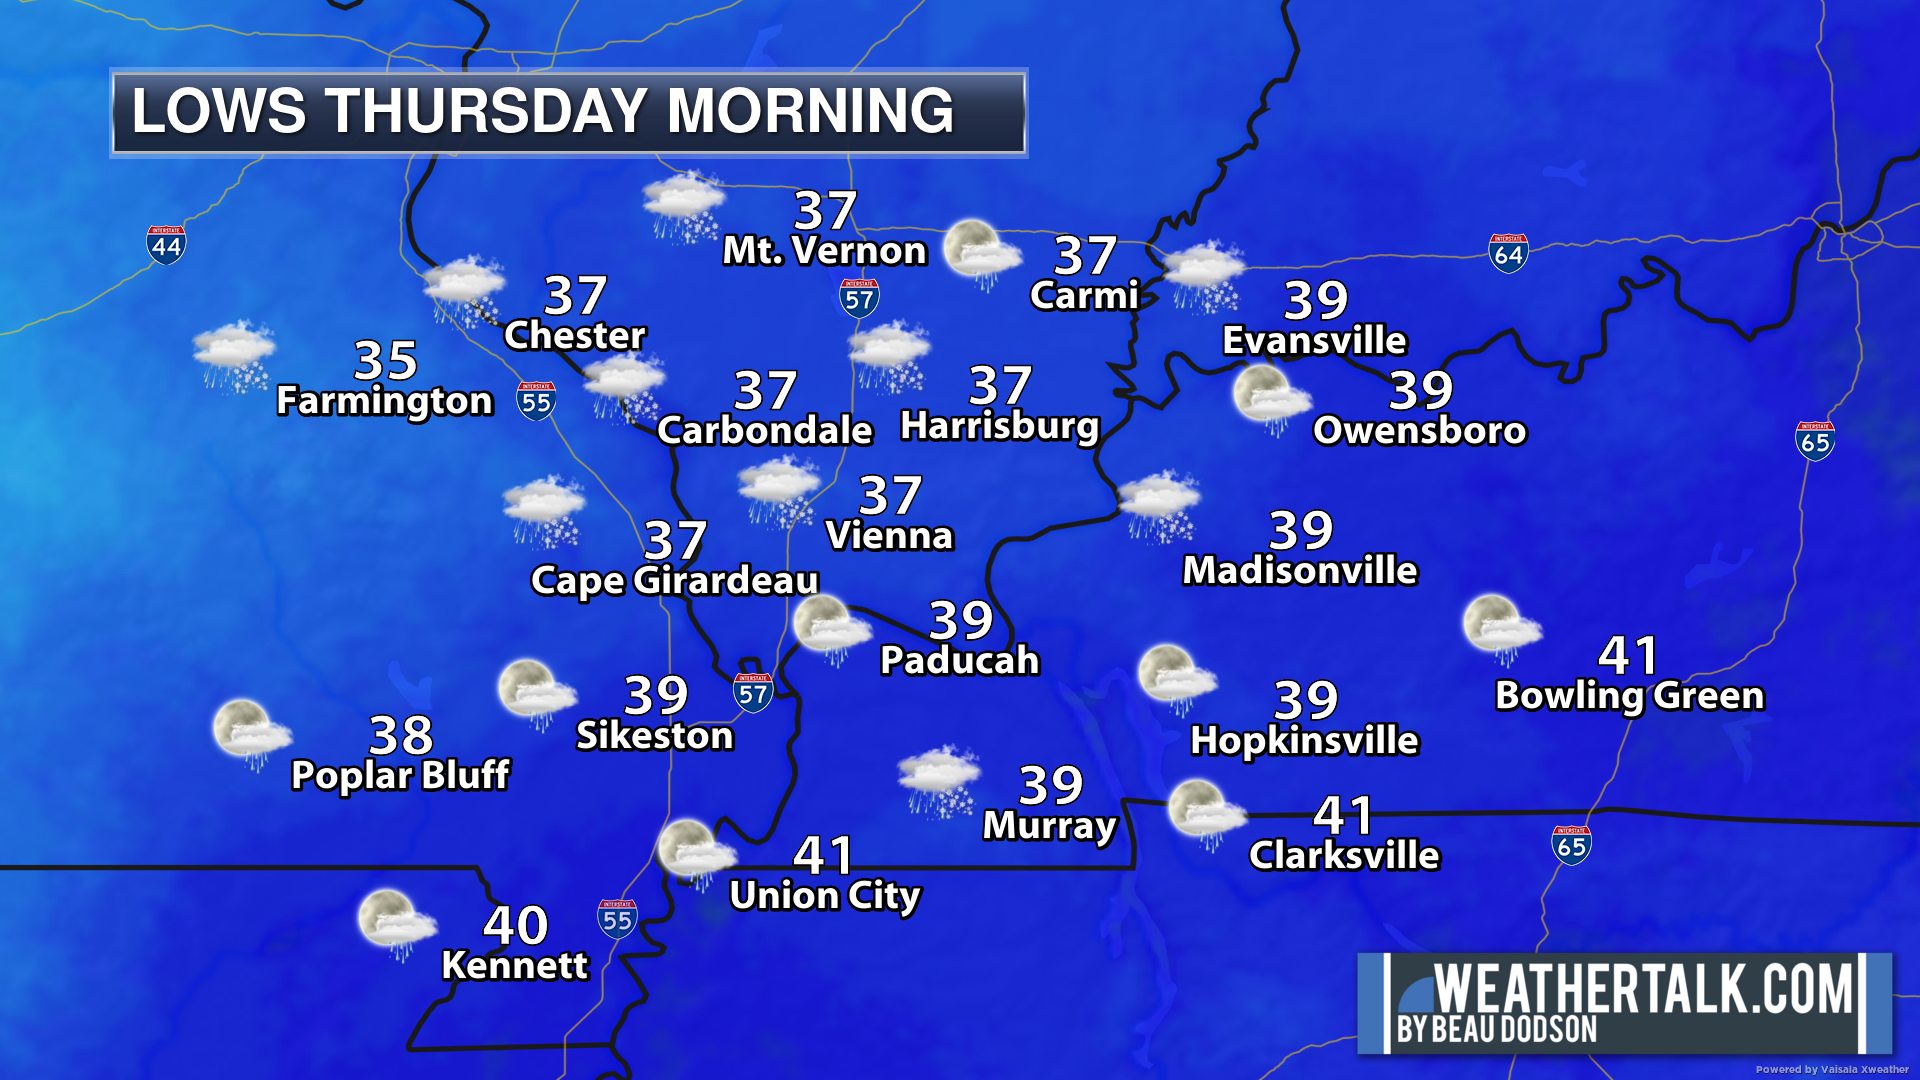
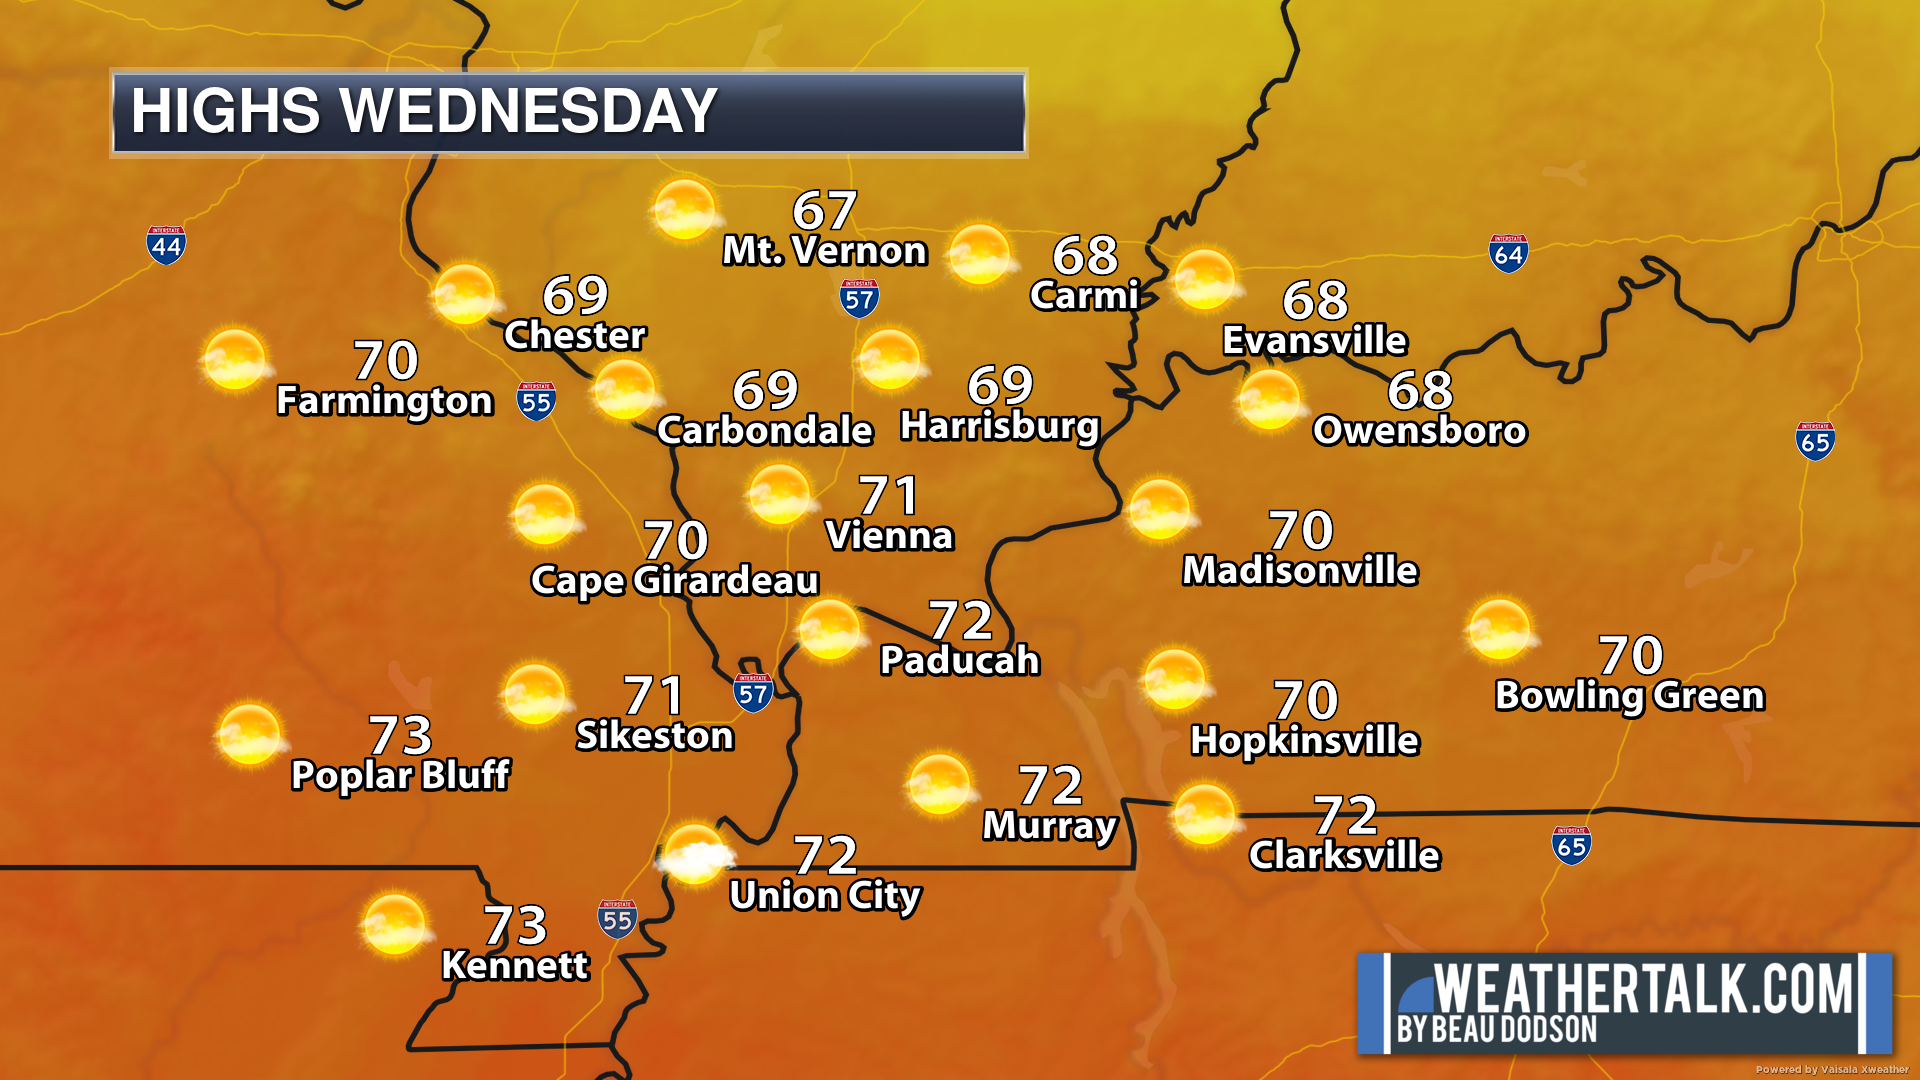
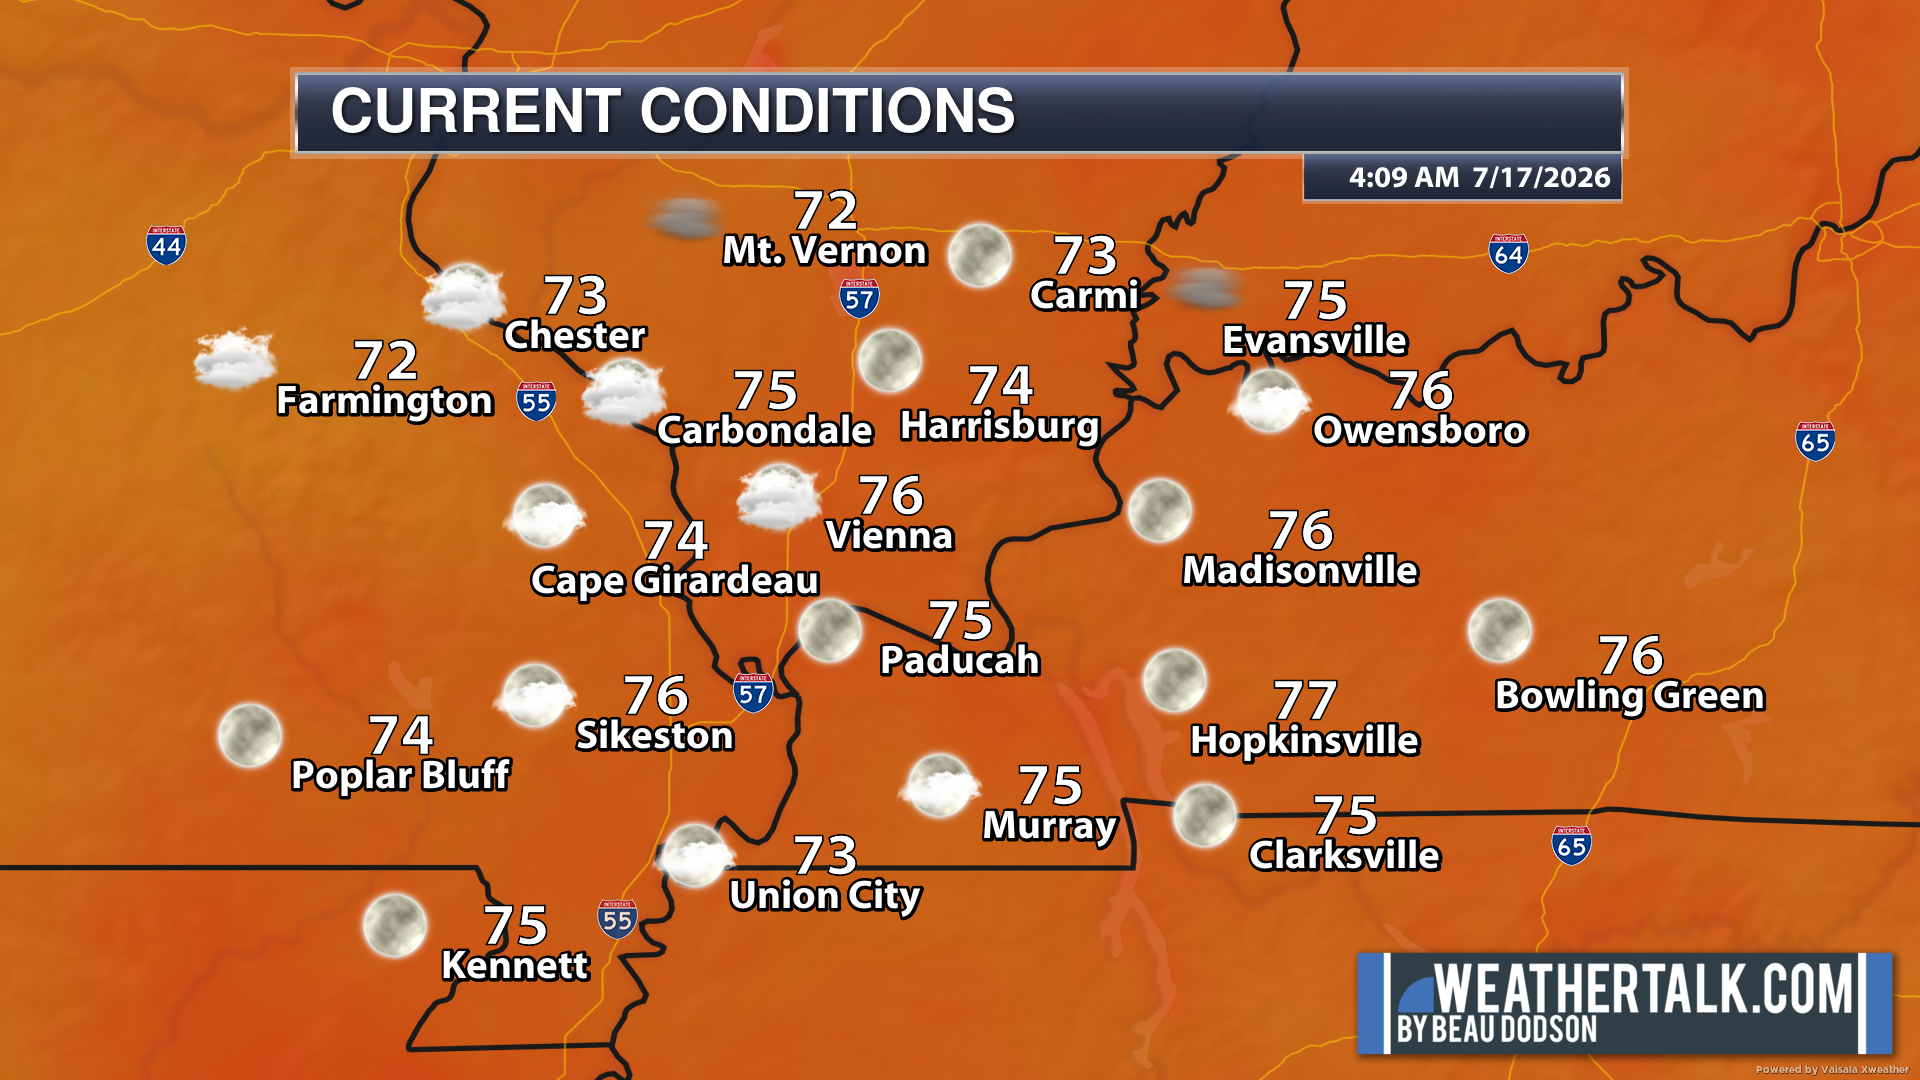
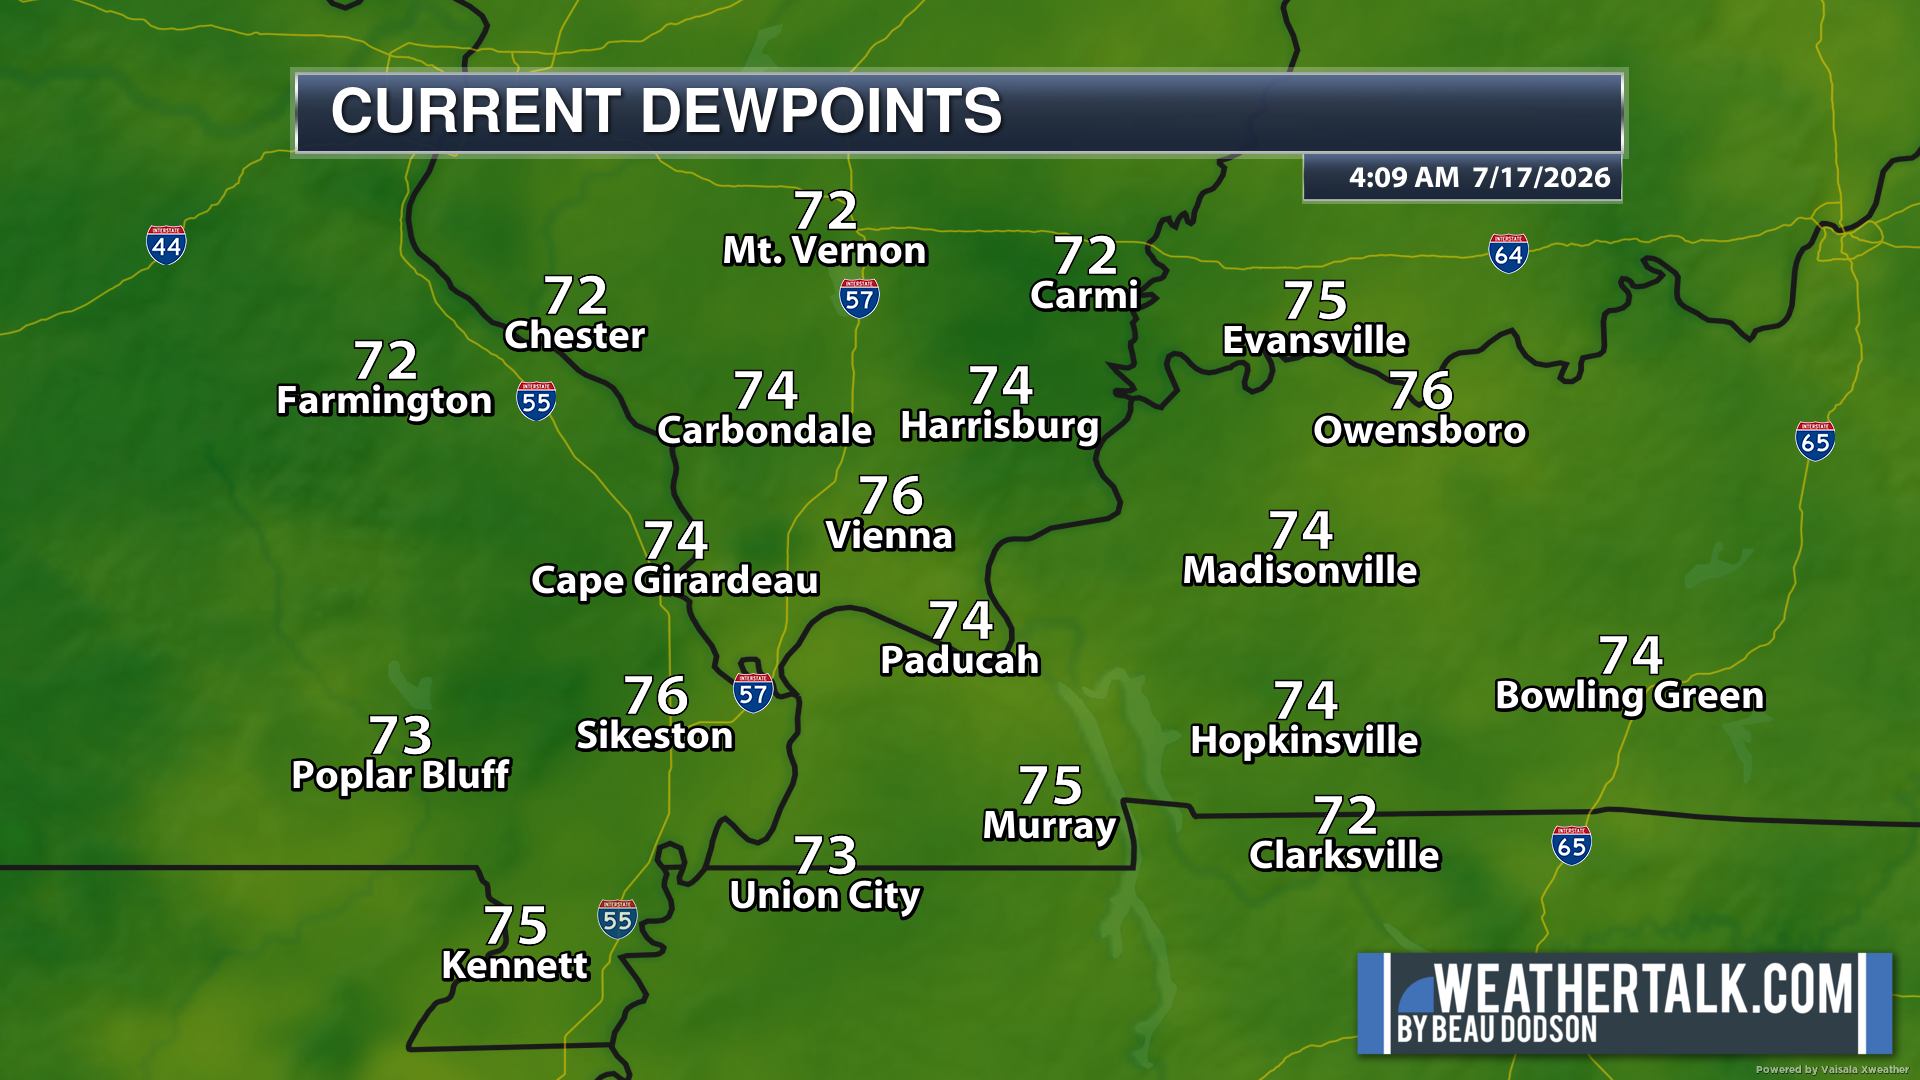
Here are the 4 AM temperatures and dew points. Dew points control how muggy it feels.
.
.
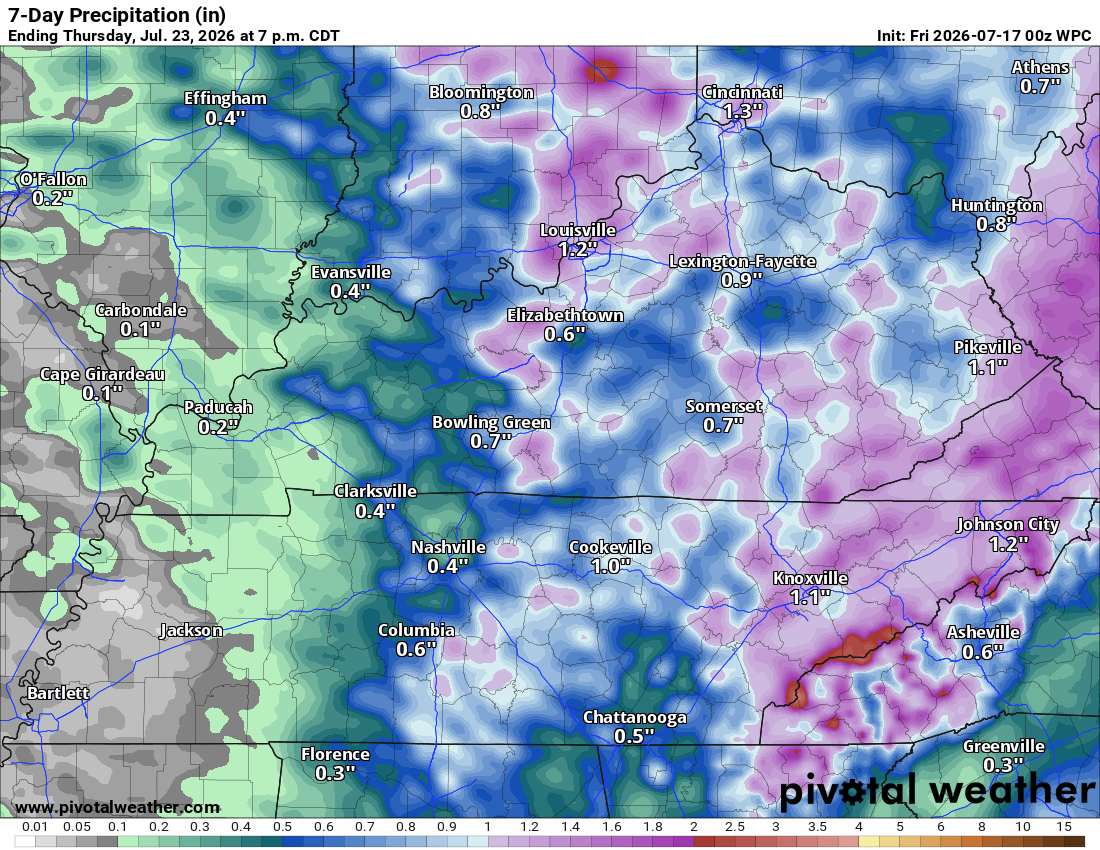
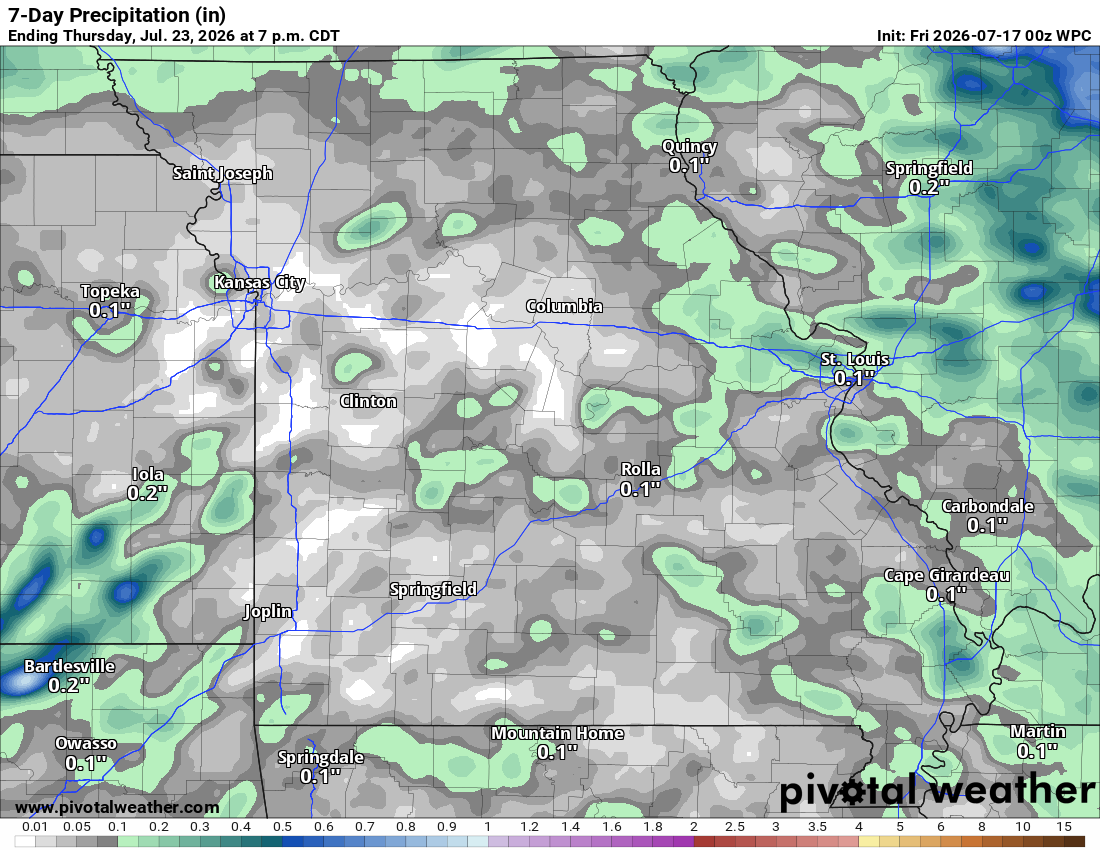
Let’s Look At The Five-Day Rainfall Totals Forecast
⚠️ This won’t be exact because the graphic is trying to predict where summer storms will form.
Some areas will receive higher totals. Summer thunderstorms can produce a wide range of totals.
Take a general idea from these graphics.
Western view (Missouri and southwest Illinois)
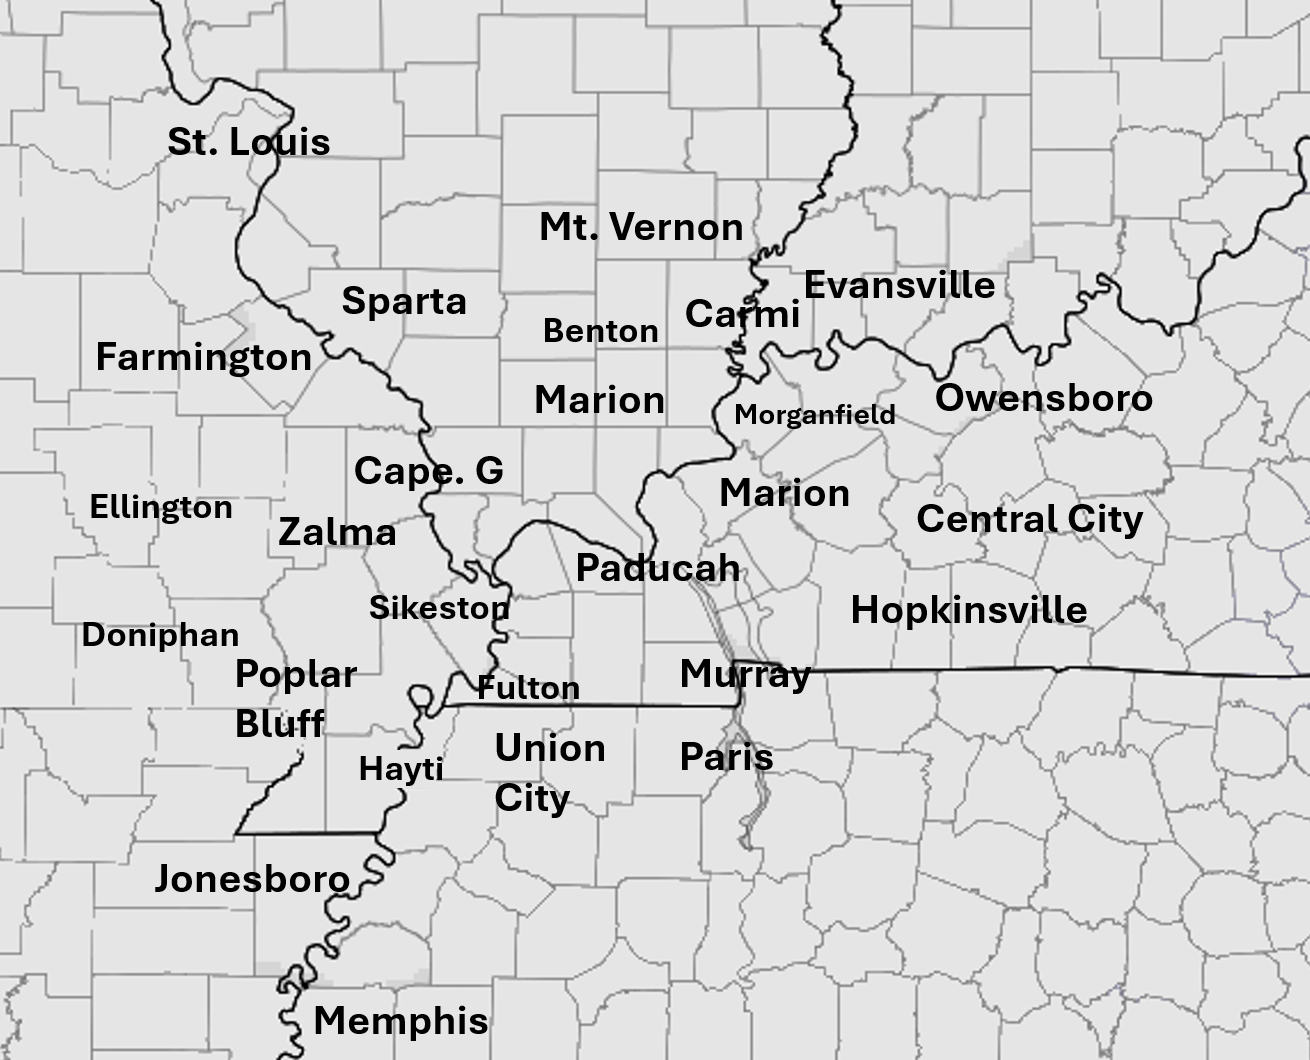
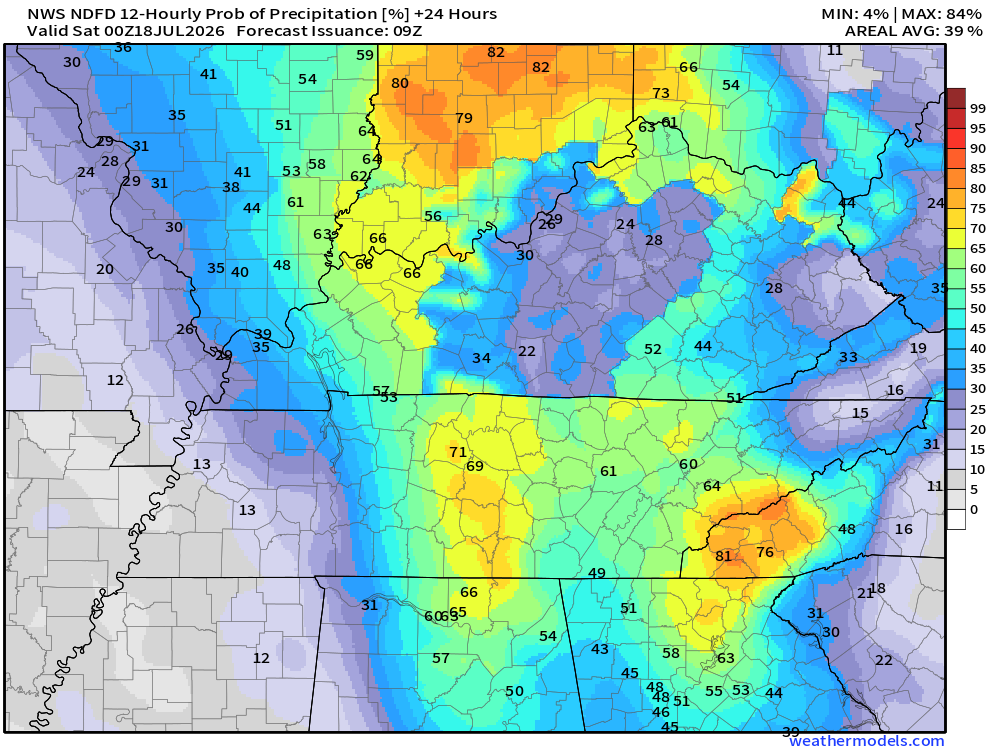
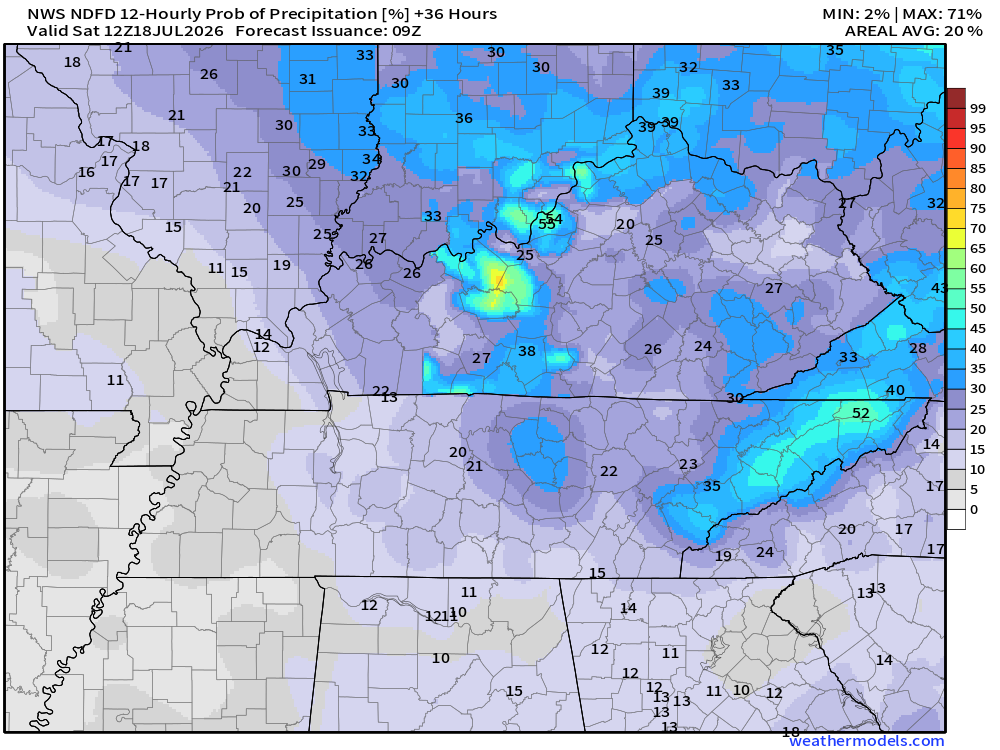
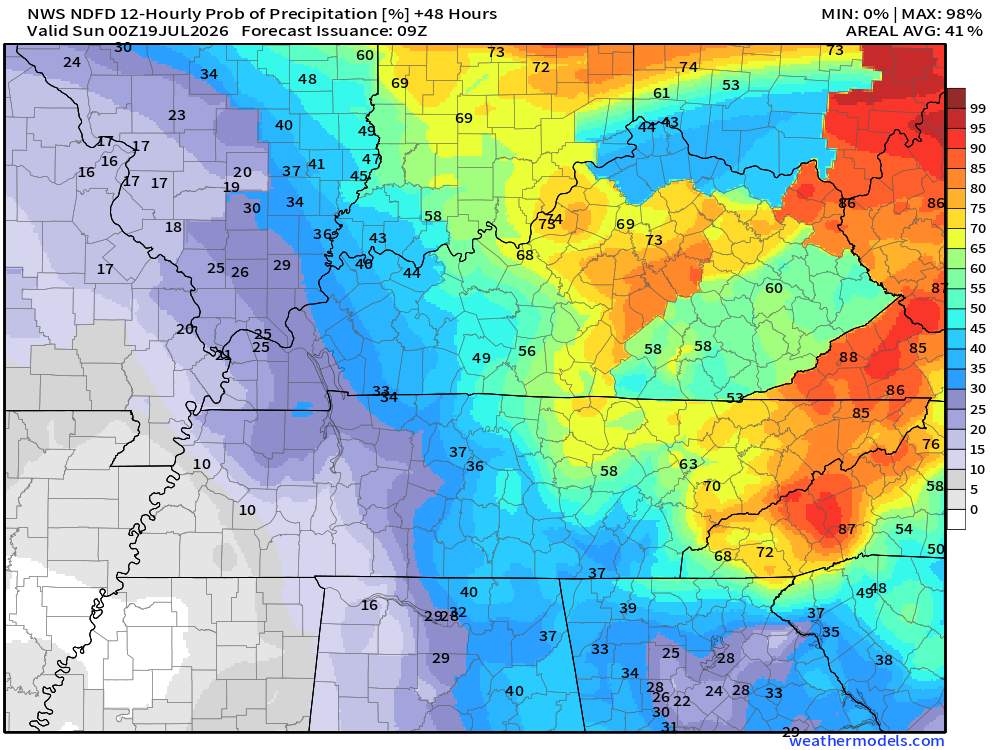
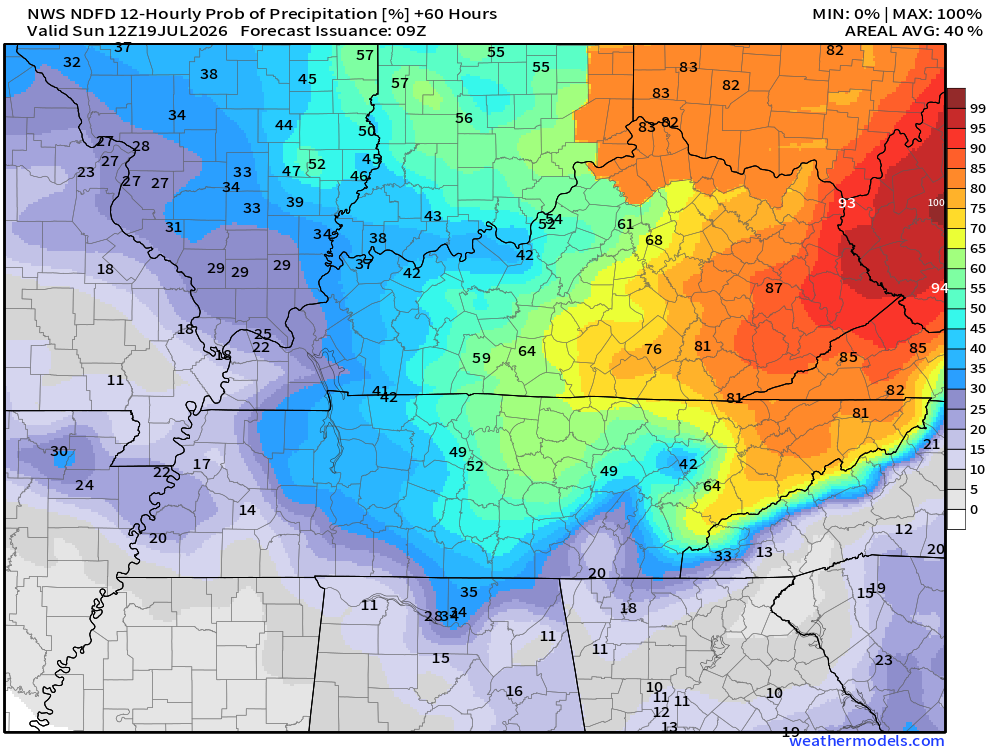
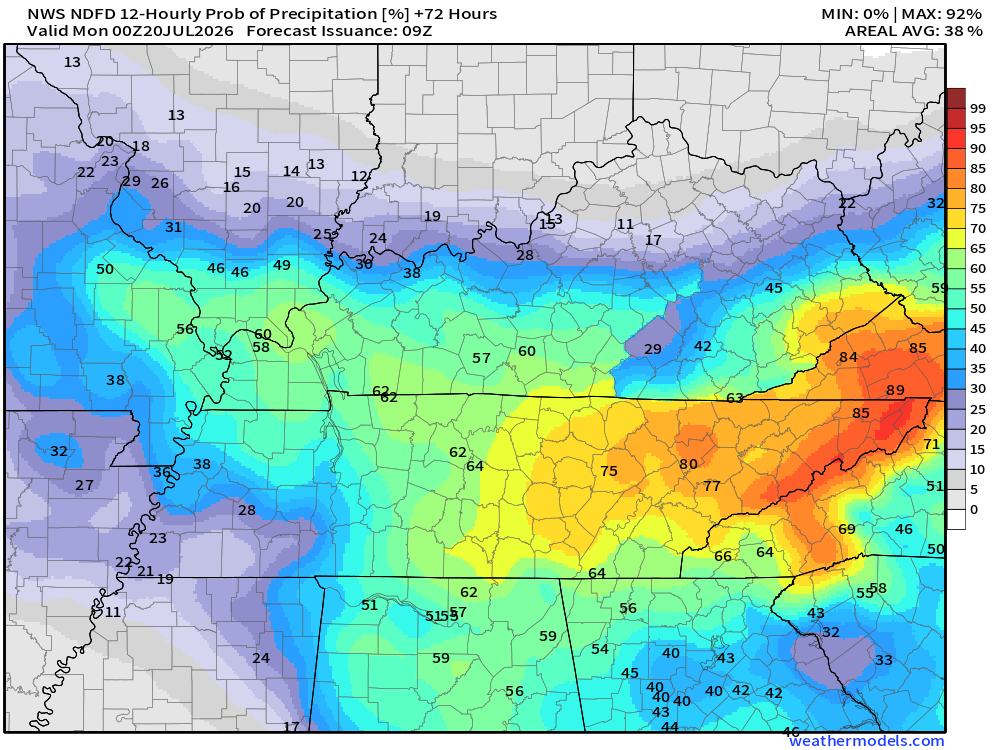
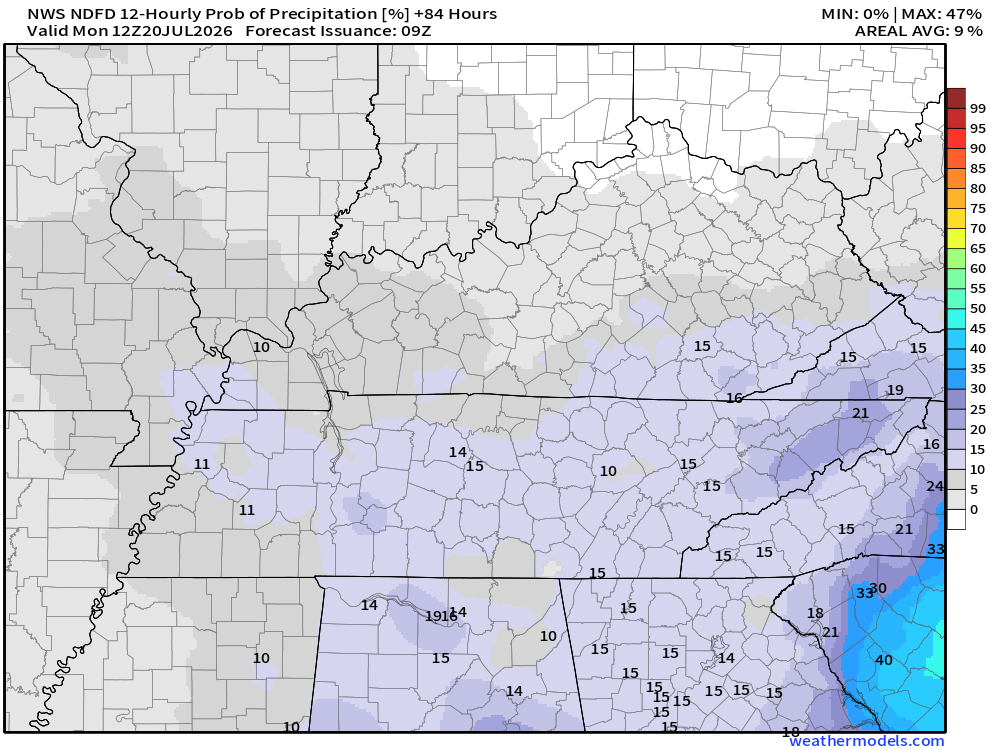
Let’s look at the four-day rain probability maps. What is the % chance of rain?
These maps are broken down into 12-hour time periods.
* Remember, a 20% chance of rain during the summer months does not mean that it will not rain. It means there will be a few thunderstorms on the radar.
Double-click maps to enlarge them.
Friday
.
.
.


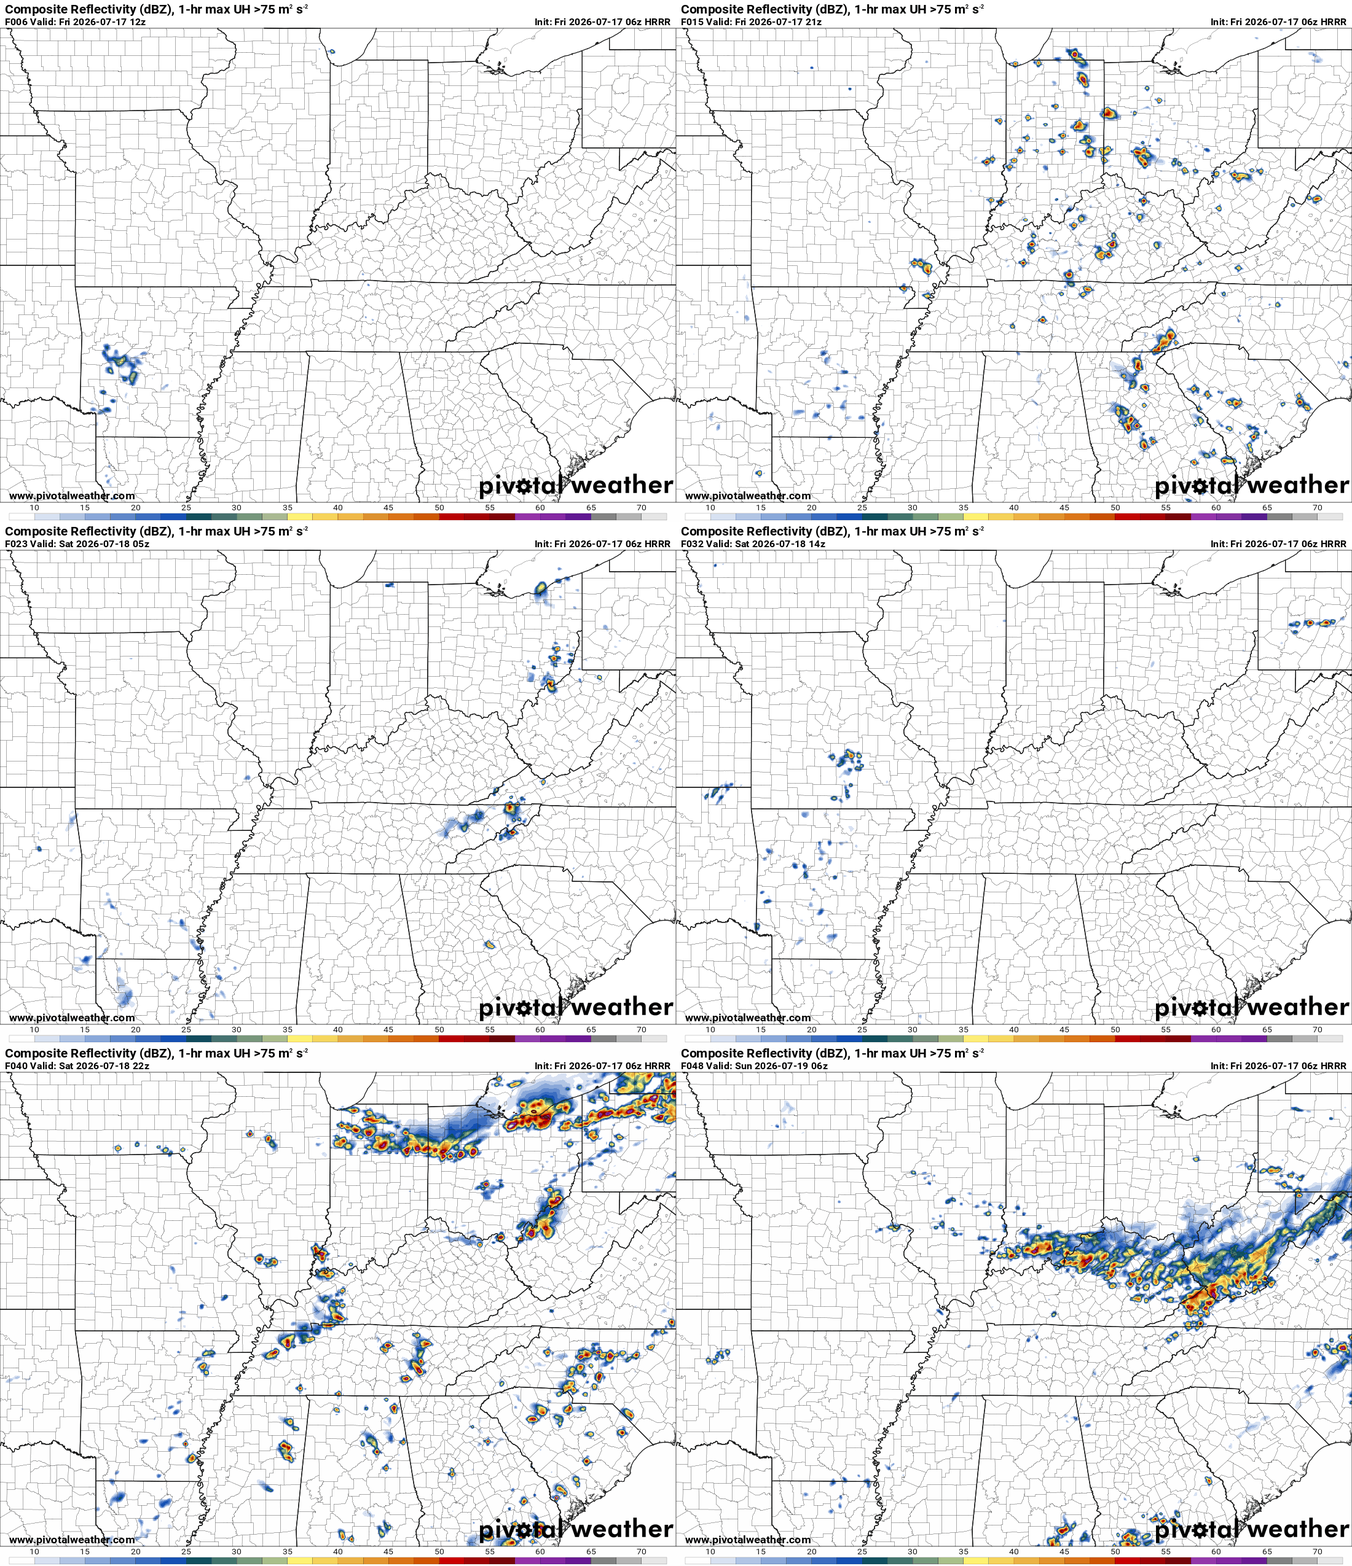
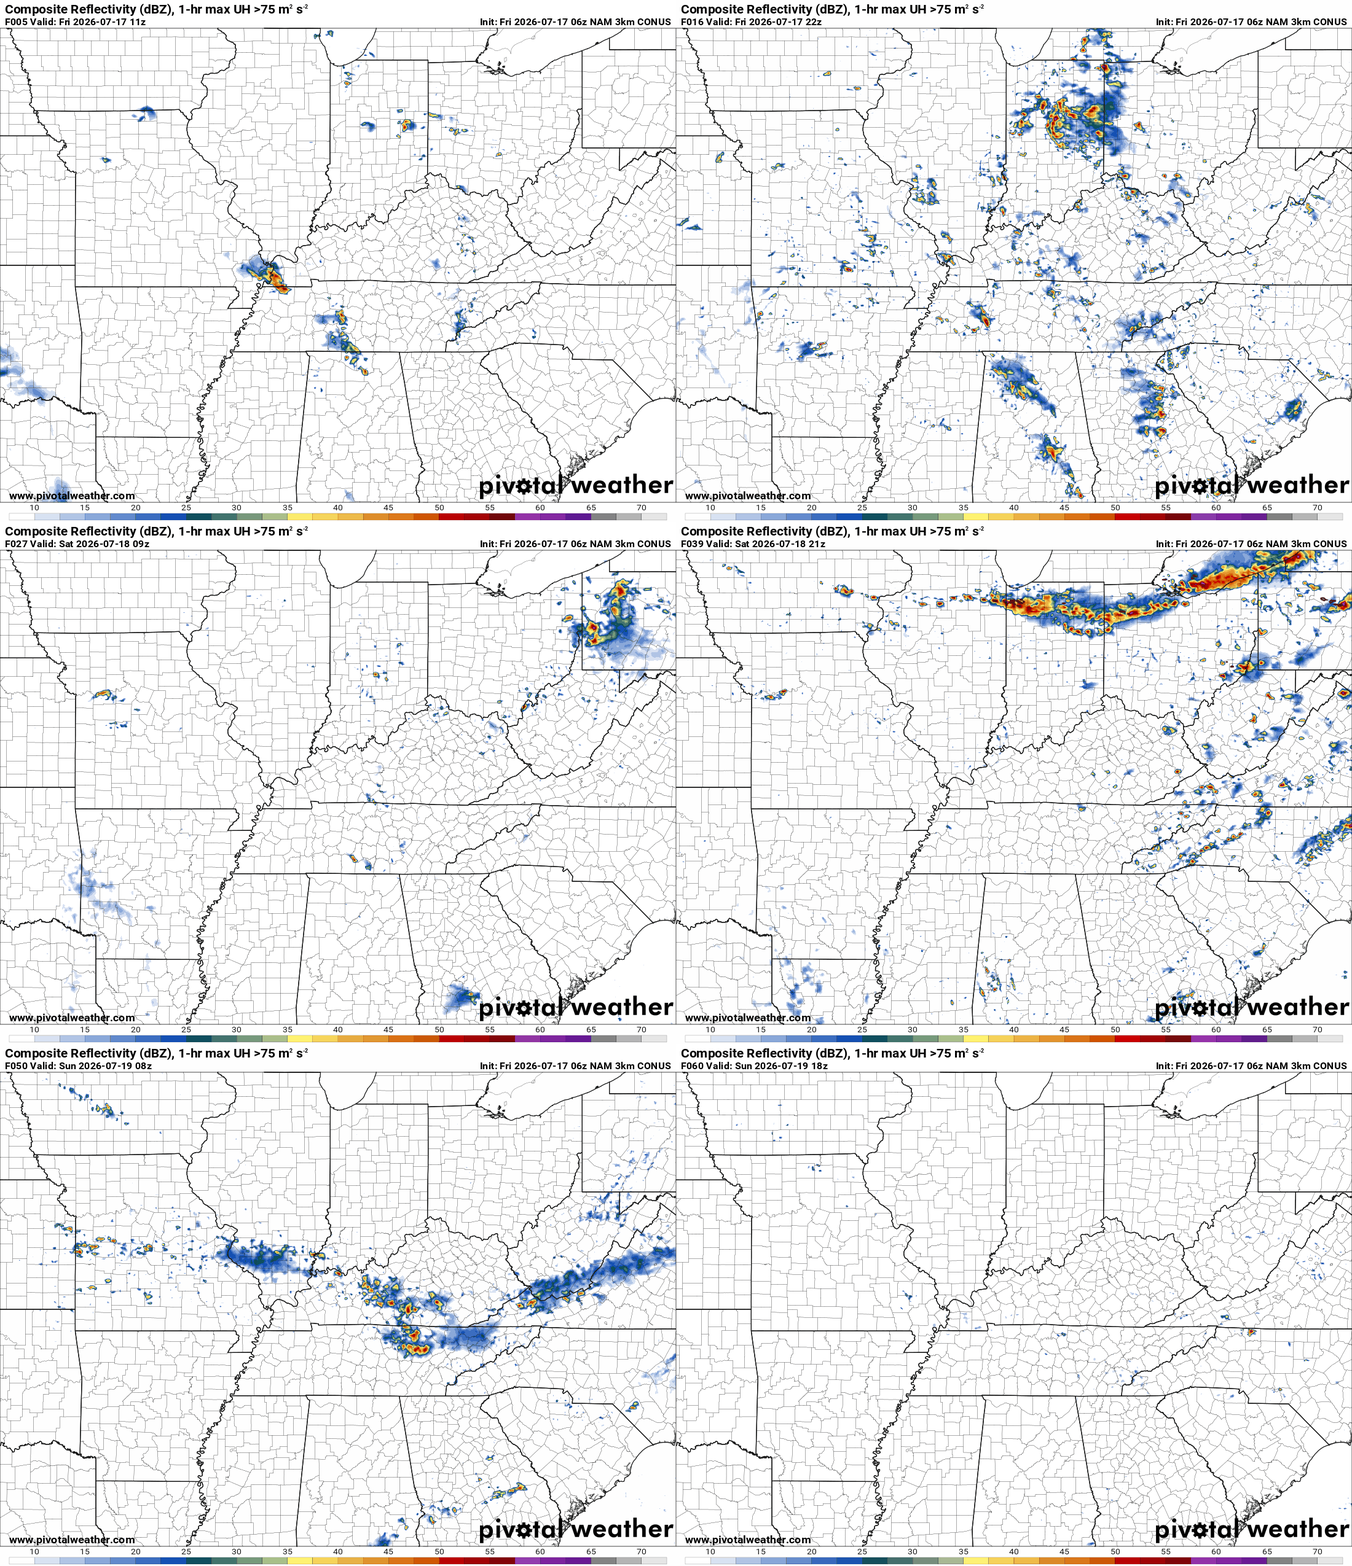
* Future-cast radars are rarely exactly right. Take the general idea from this animation. These models do their best to forecast where precipitation will develop and move. In the end, they are a model.
The timestamp (upper left) is in Zulu. 12z=7 am. 18z=1 pm. 00z=7 pm.
Green is rain. Yellow is moderate rain. Orange and red indicate locally heavy rain.
Double-click the animation to enlarge it.
Hrrr Model
.
NAM 3K Model
Models won’t pick up pop-up storms all that well.
..
.
Click here if you would like to return to the top of the page.
.Average high temperatures for this time of the year are around 90 degrees.
Average low temperatures for this time of the year are around 70 degrees.
Average precipitation during this time period ranges from 1.00″ to 1.20″
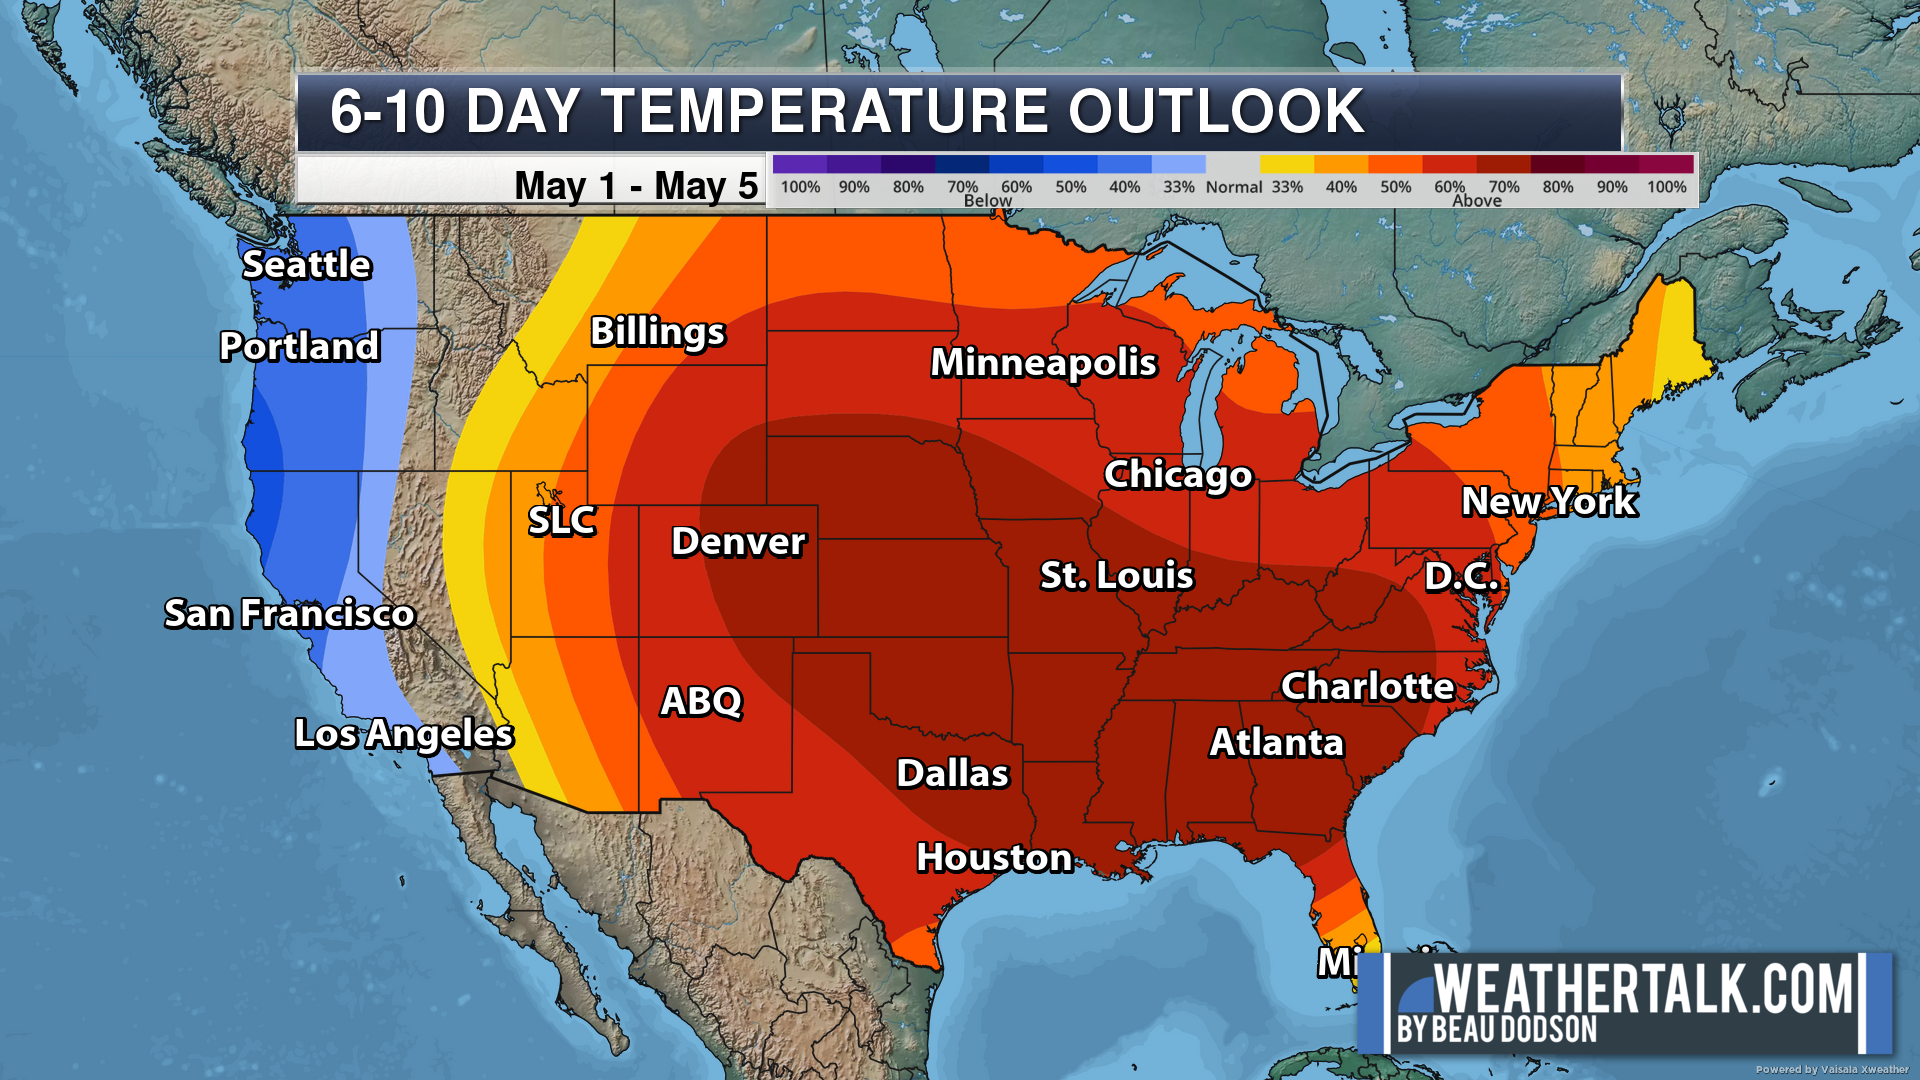
Six to Ten Day Outlook.
Blue is below average. Red is above average. The no color zone represents equal chances.
Average highs for this time of the year are in the lower 60s. Average lows for this time of the year are in the lower 40s.
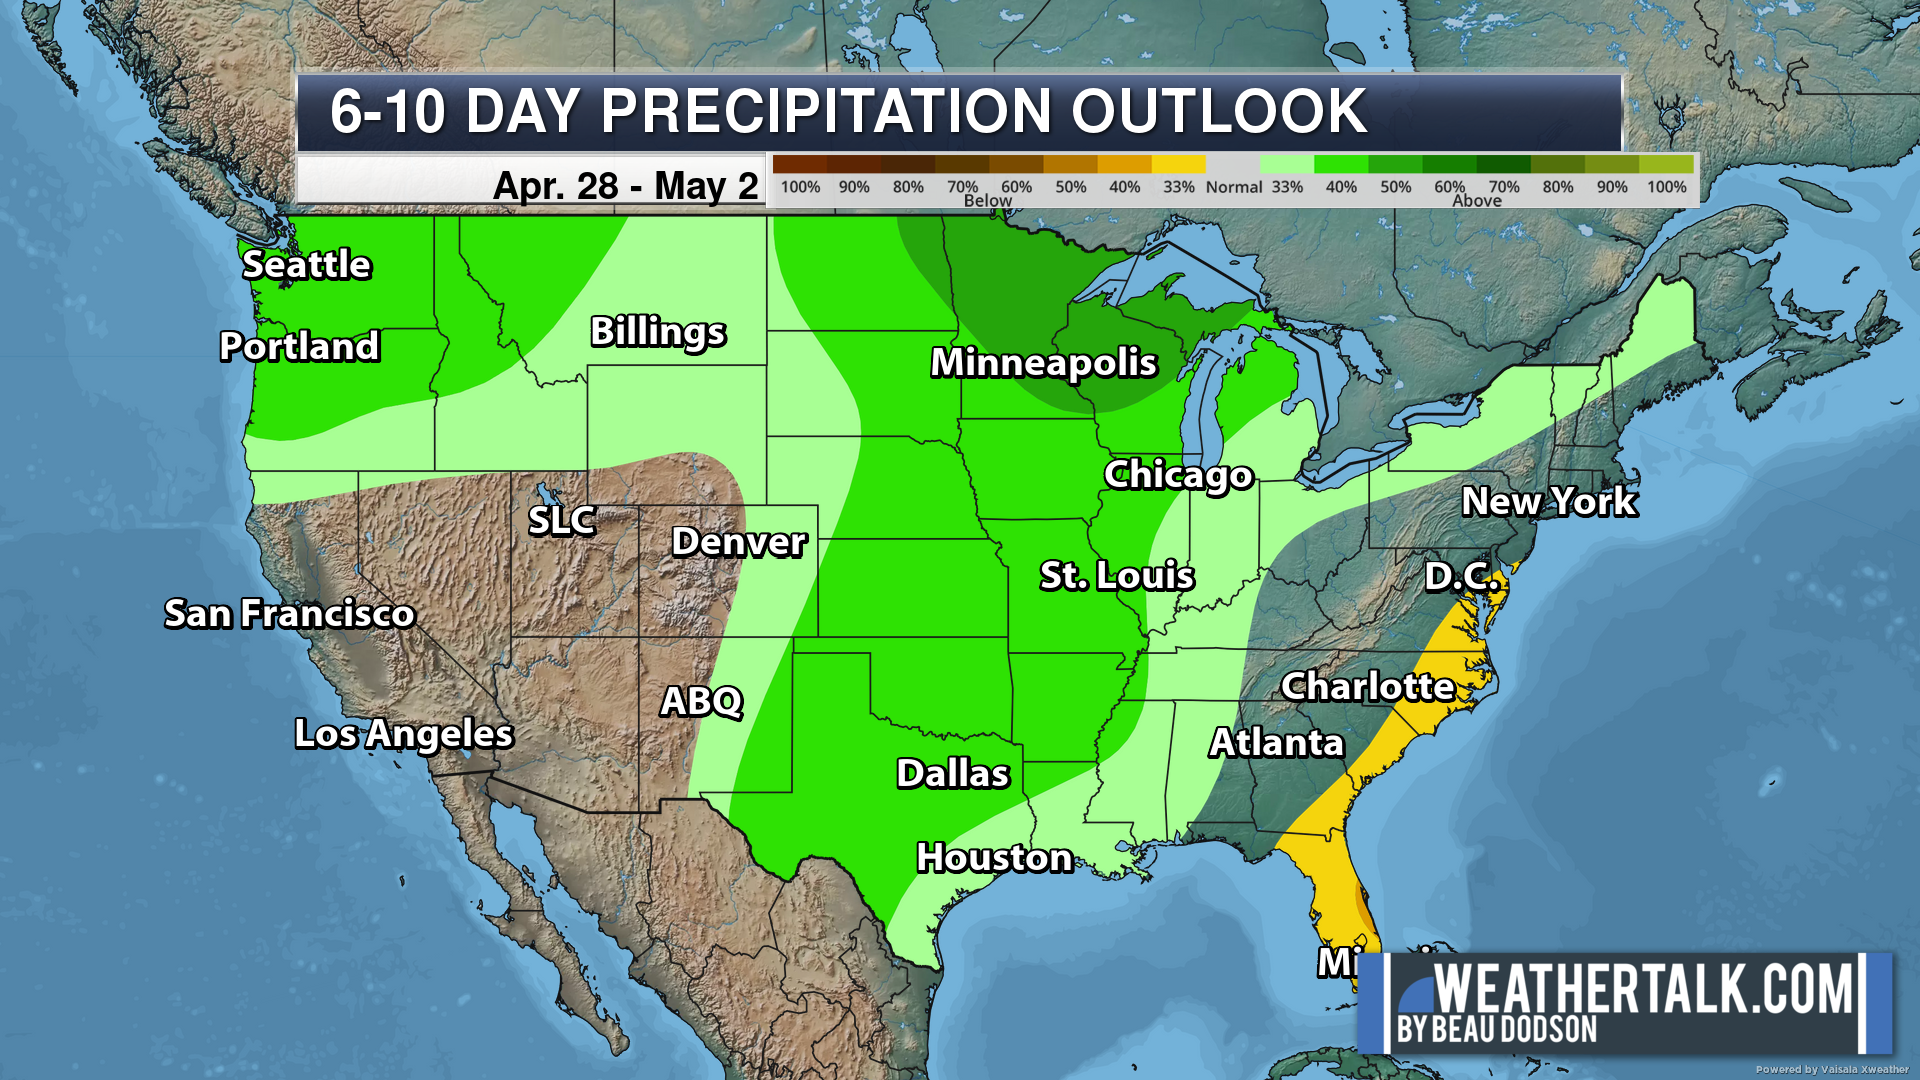
Green is above average precipitation. Yellow and brown favors below-average precipitation. Average precipitation for this time of the year is around one inch per week.
Average low temperatures for this time of the year are around 70 degrees.
Average precipitation during this time period ranges from 1.00″ to 1.30″
.
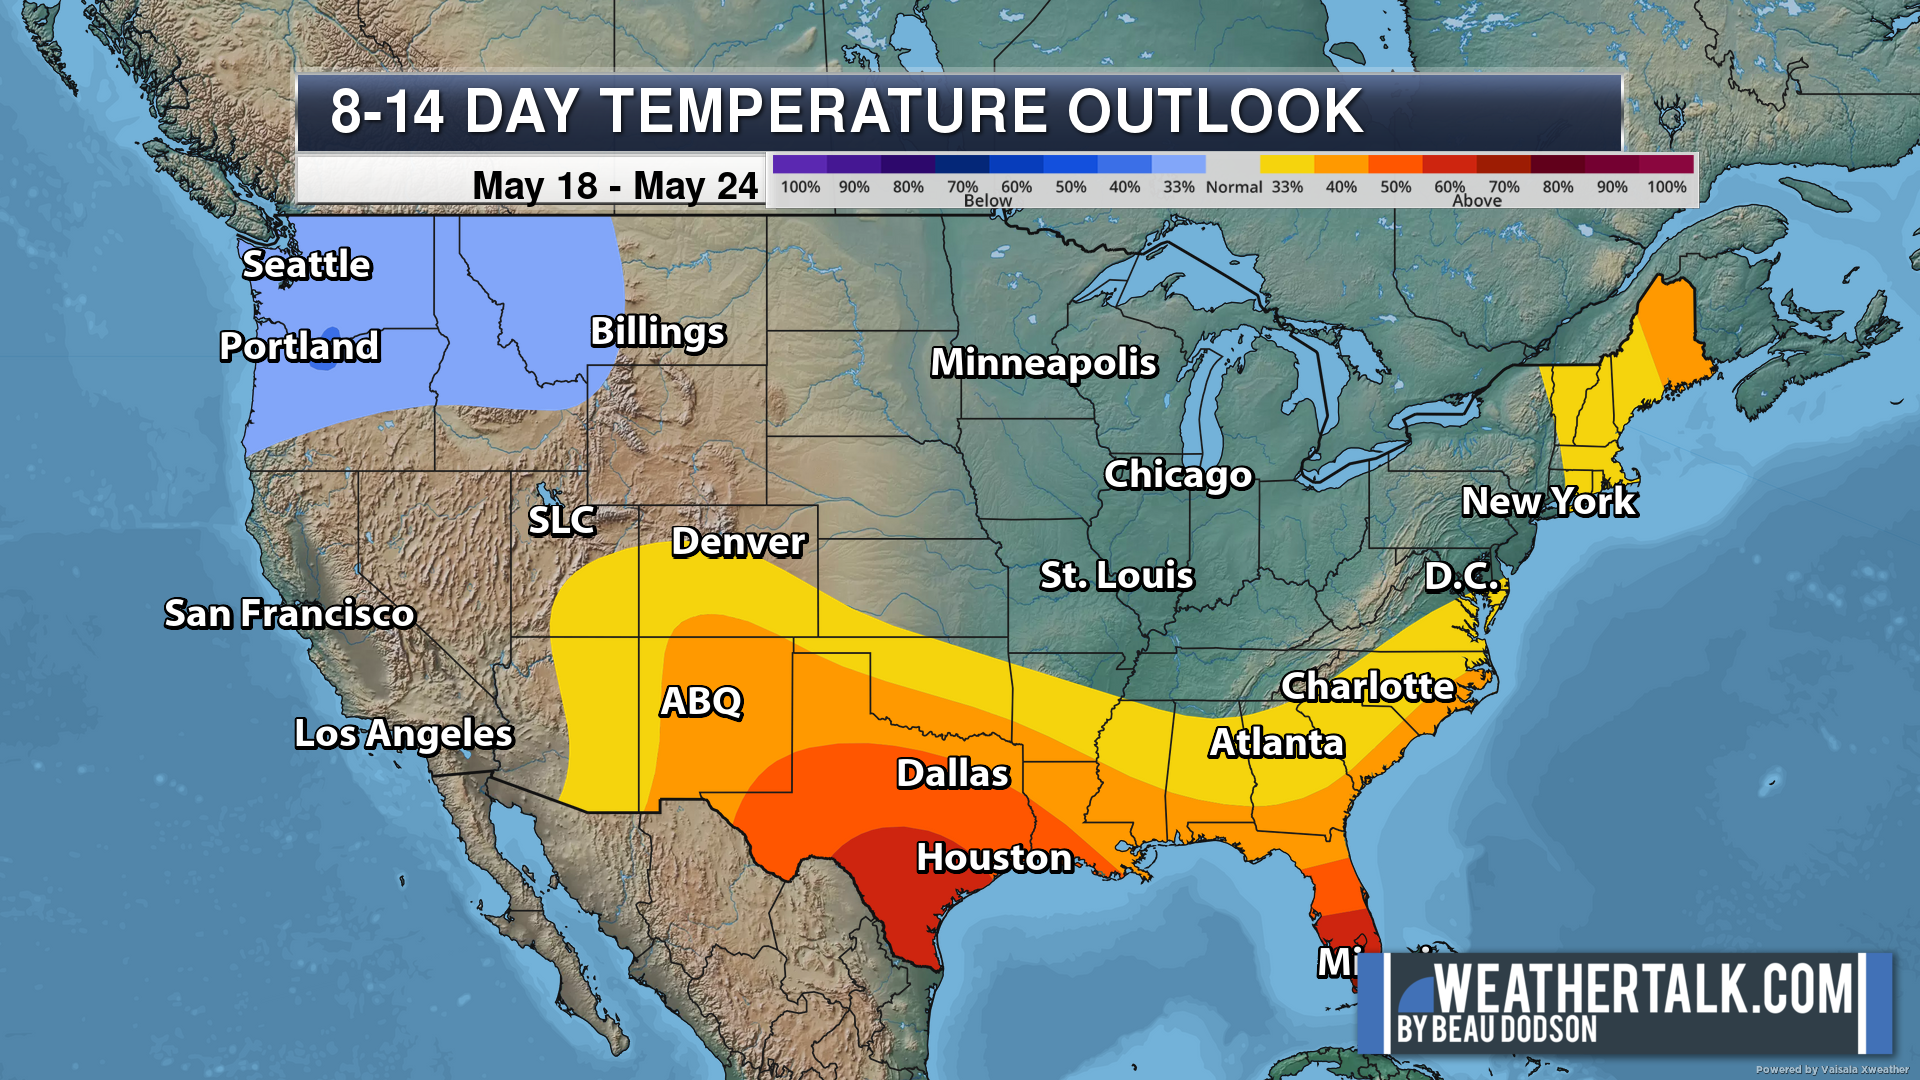
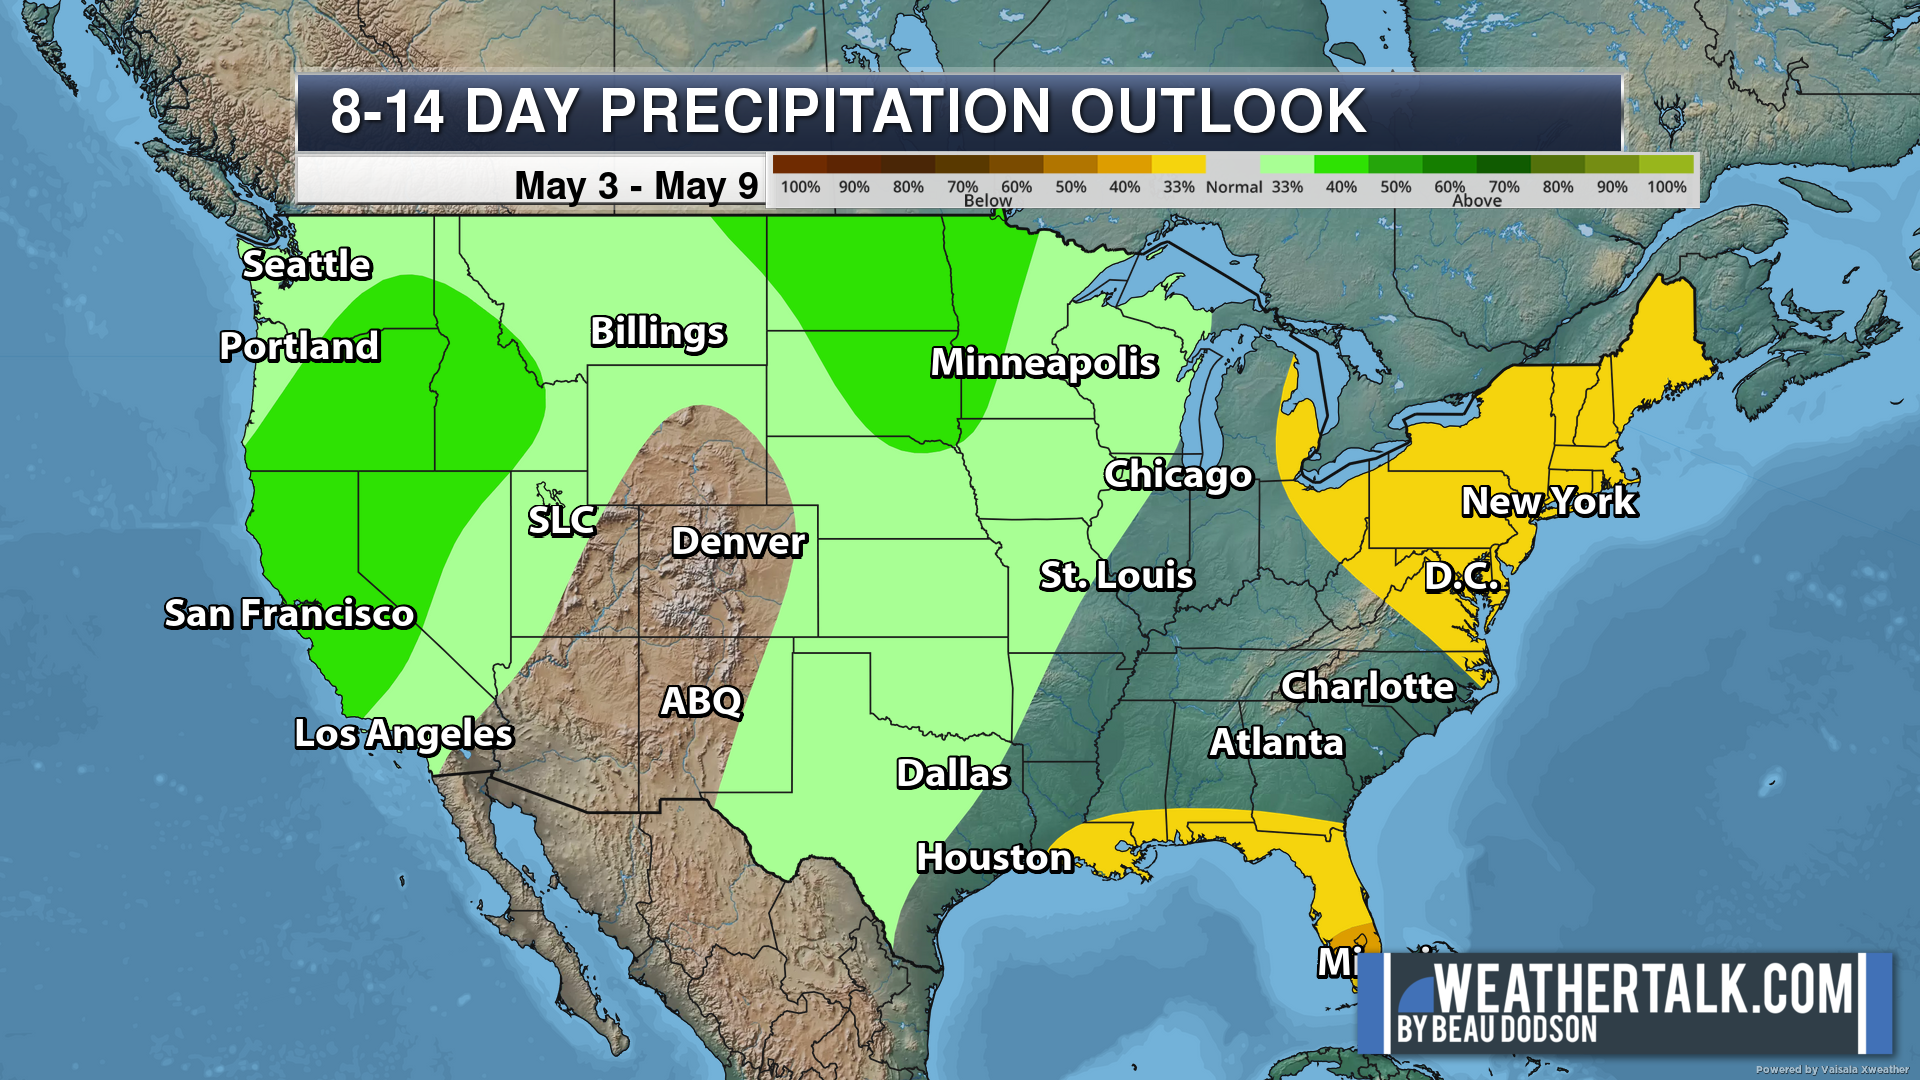
Eight to Fourteen Day Outlook.
Blue is below average. Red is above average. The no color zone represents equal chances.
Green is above average precipitation. Yellow and brown favors below average precipitation. Average precipitation for this time of the year is around one inch per week.
.

Radars and Lightning Data
Interactive-city-view radars. Clickable watches and warnings.
https://wtalk.co/B3XHASFZ
Old legacy radar site (some of you like it better)
https://weatherobservatory.com/weather-radar.htm
If the radar is not updating then try another one. If a radar does not appear to be refreshing then hit Ctrl F5. You may also try restarting your browser.
Backup radar site in case the above one is not working.
https://weathertalk.com/morani
Regional Radar
https://imagery.weathertalk.com/prx/RadarLoop.mp4
** NEW ** Zoom radar with chaser tracking abilities!
ZoomRadar
Lightning Data (zoom in and out of your local area)
https://wtalk.co/WJ3SN5UZ
Not working? Email me at beaudodson@usawx.com

Live lightning data: Click here.
Real time lightning data (another one) https://map.blitzortung.org/#5.02/37.95/-86.99
.
.
We have a new service to complement your www.weathertalk.com subscription. This does NOT replace www.weathertalk.com It is simply another tool for you to receive severe weather information.
.
https://weathercallservices.com/beau-dodson-weather
Want to receive the daily forecast/other products on your Beau Dodson Weather app?
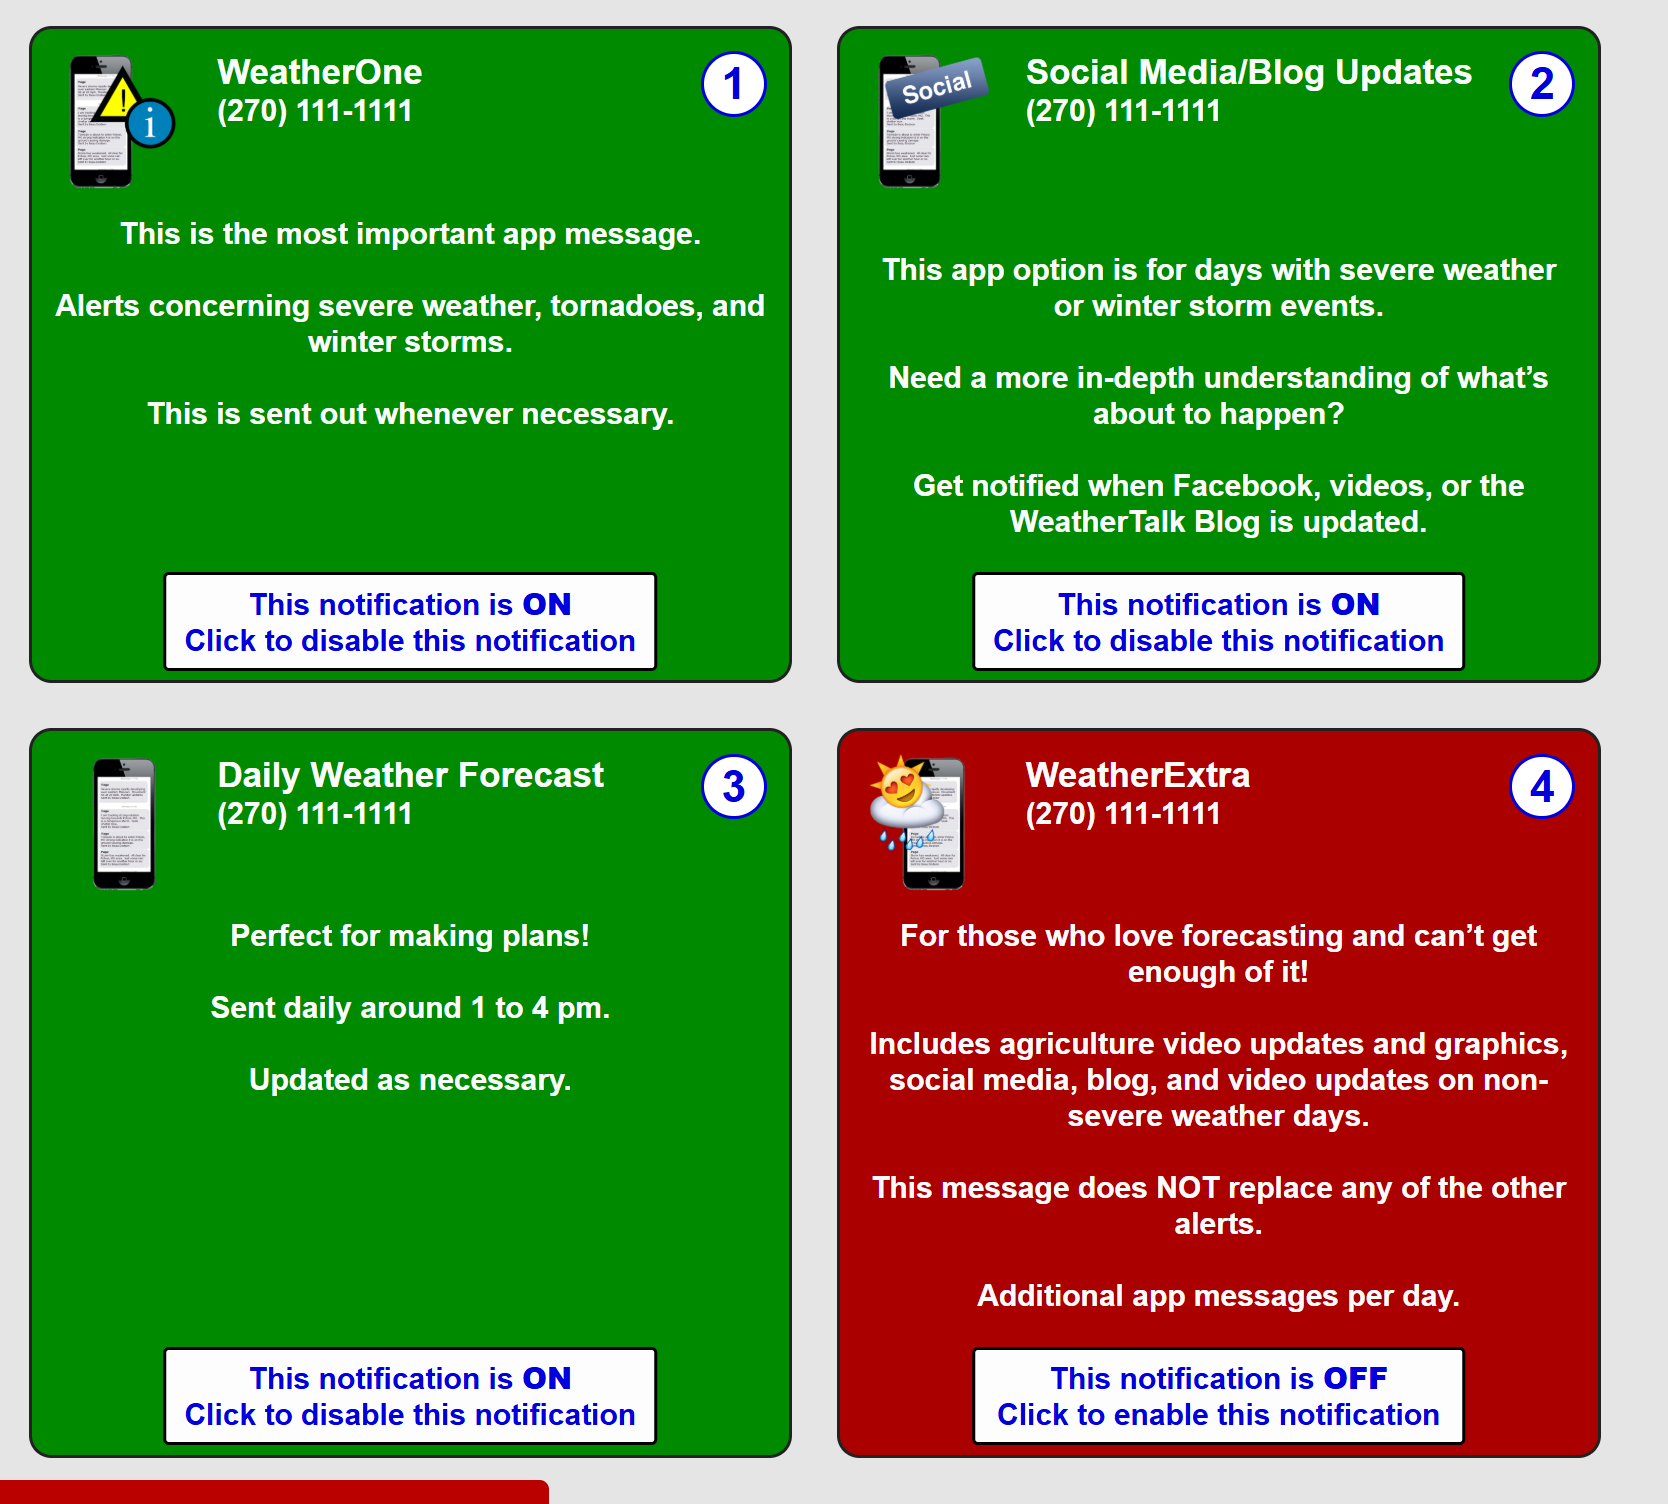
Did you know you have four options in your www.weathertalk.com account
You will then receive these via your Beau Dodson Weather app.
Just log into your www.weathertalk.com account
Click the NOTIFICATION SETTINGS TAB
Then, turn them on (green) and off (red)
🌪️ Number 1 is the most important one. Severe alerts, tornado alerts, and so on.
Number 2 is the daily video, blog, livestream alerts, and severe weather Facebook threads on severe days or winter storm days.
Number 3 is the daily forecast. I send that out every day during the afternoon hours. It is the seven-day forecast, hazardous weather outlook, fire outlook, and more.
Number 4 is to receive the daily video, blog, and other content on NON-severe weather days (every day without severe threats in other words)
GREEN IS ON
RED IS OFF
Want to add more products to your Beau Dodson Weather App?
Receive daily videos, weather blog updates on normal weather days and severe weather and winter storm days, your county by county weather forecast, and more!
Here is how to do add those additional products to your app notification settings!
The app is for subscribers. Subscribe at www.weathertalk.com/welcome then go to your app store and search for WeatherTalk
Subscribers, PLEASE USE THE APP. ATT and Verizon are not reliable during severe weather. They are delaying text messages.
The app is under WeatherTalk in the app store.

Apple users click here

Android users click here
