Hello, everyone
I know how much each one of you loves winter (okay not all of you). I wanted to take a little bit of time and try to explain some of the products you will see on my Facebook, Twitter, and blog posts.
Most of you know me quite well. We can have a lot of fun with the weather. But, there are times when we need to buckle down and tackle inclement weather. My goal is to make the communication as simple as possible. My goal is to give you and your family timely and accurate information so you can decide how to best prepare for a winter weather event.
The goal is to use plain English. Simple language. Simple graphics. There is no reason to bombard you with a dozen different color coded advisory/watch/warning graphics. Often times with confusing language. If you have to ask me to explain something further then I am not doing my job.
What you care about is
1. Where
2. What
3. When
4. How confident am I
I will review and explain the following items (in the order they appear on the page)
1. My forecast coverage area
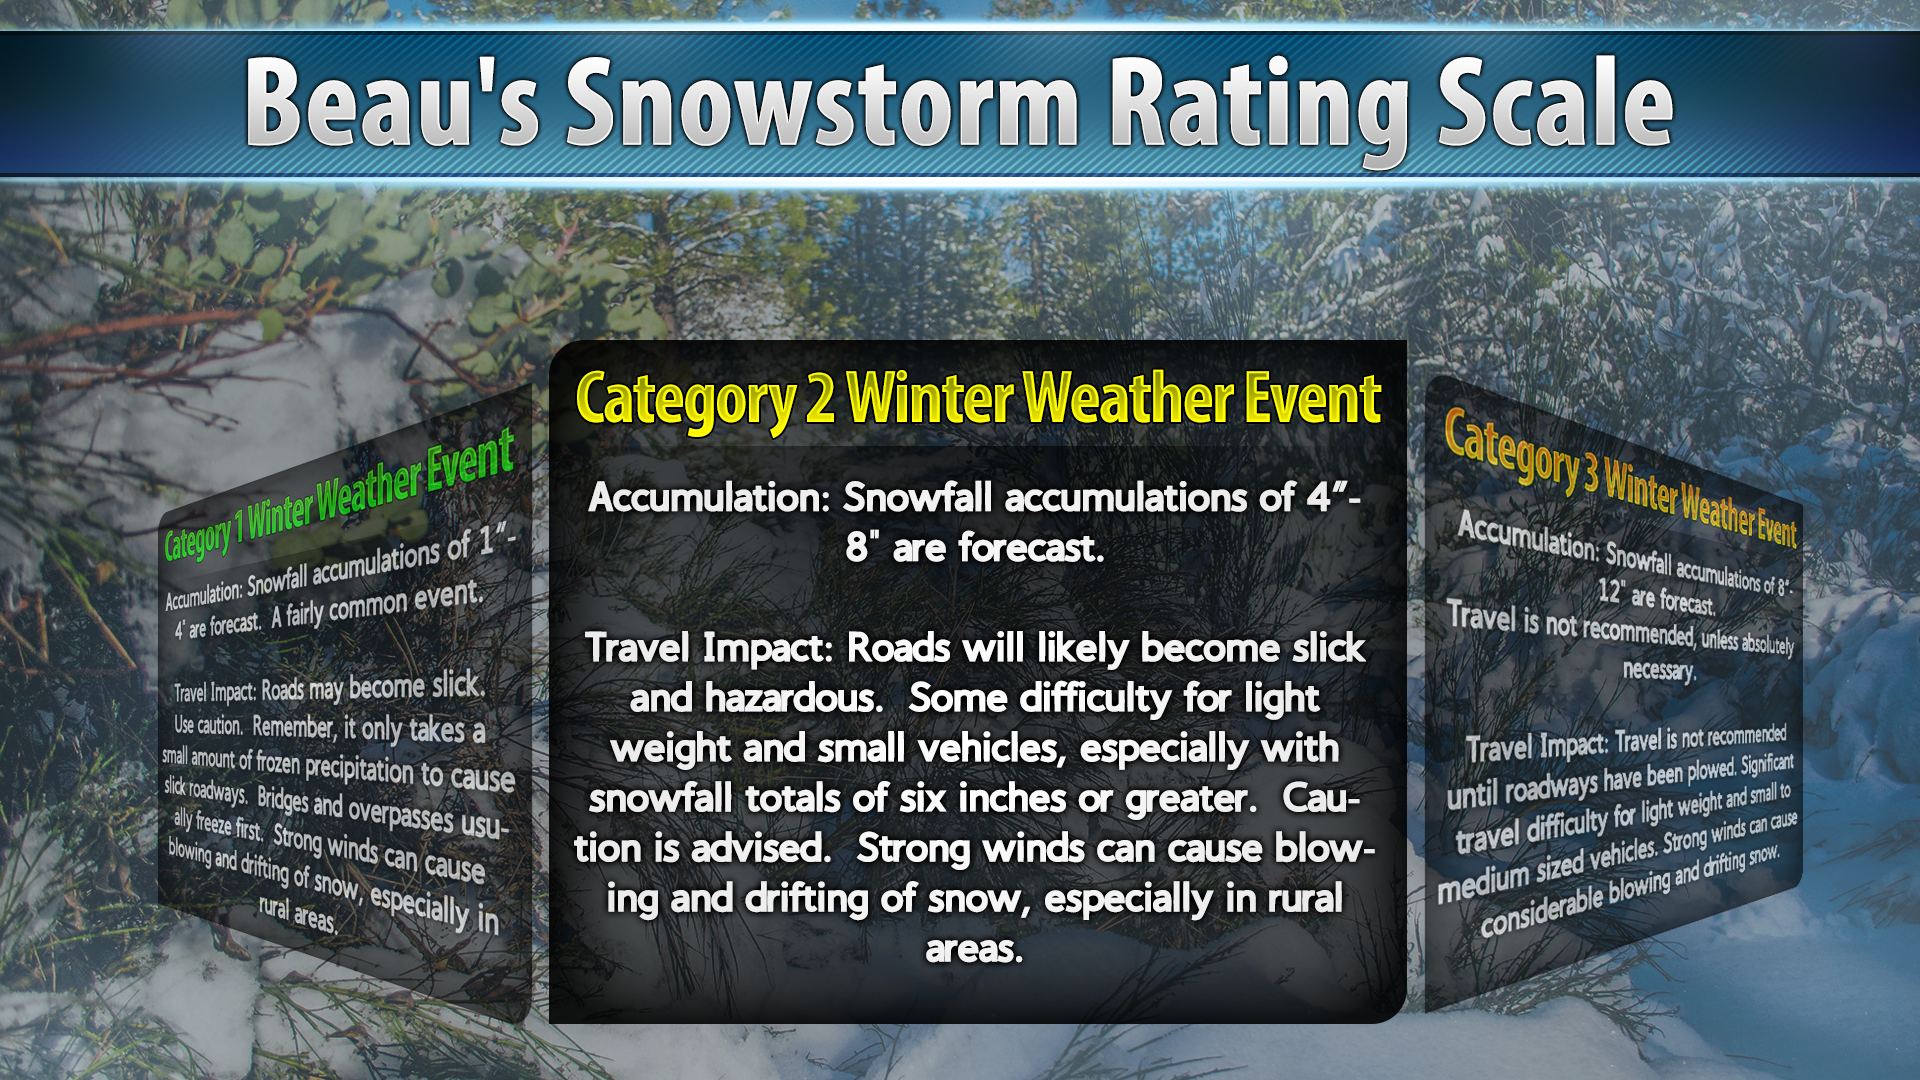
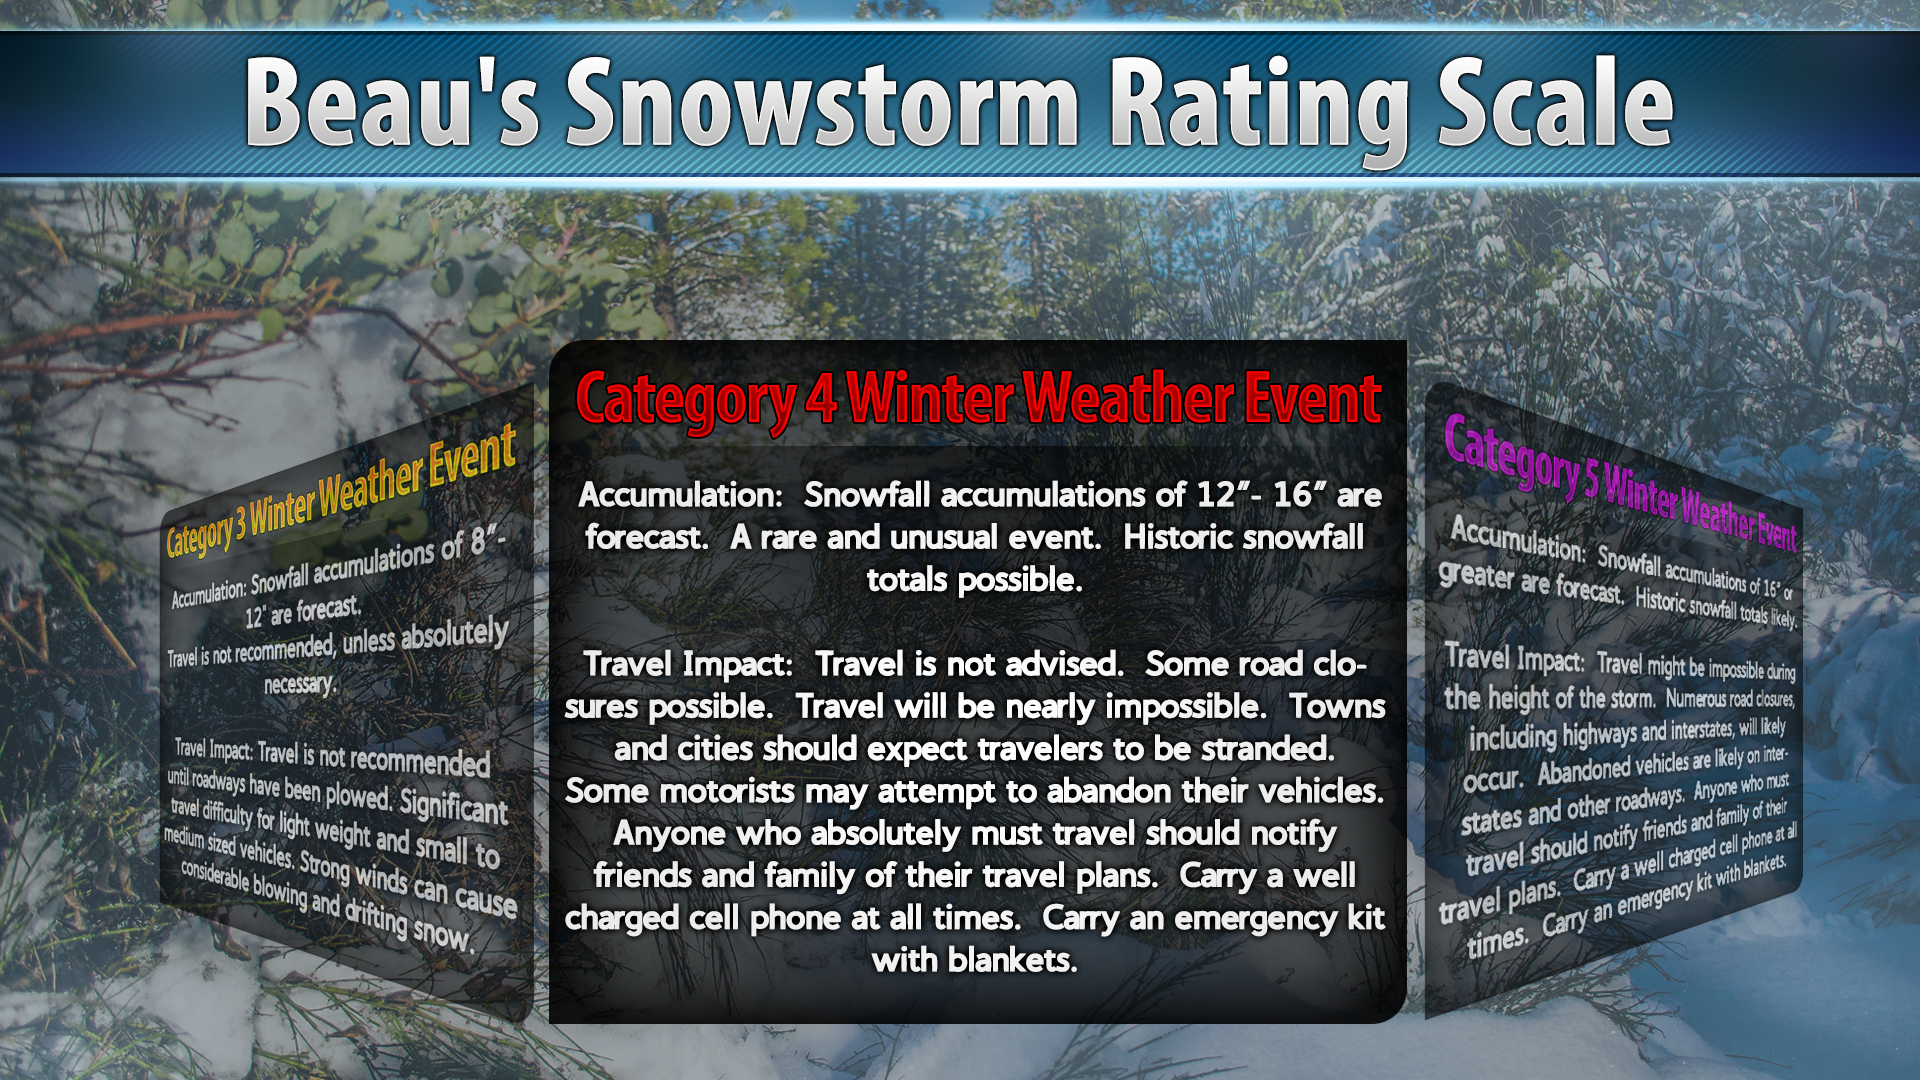
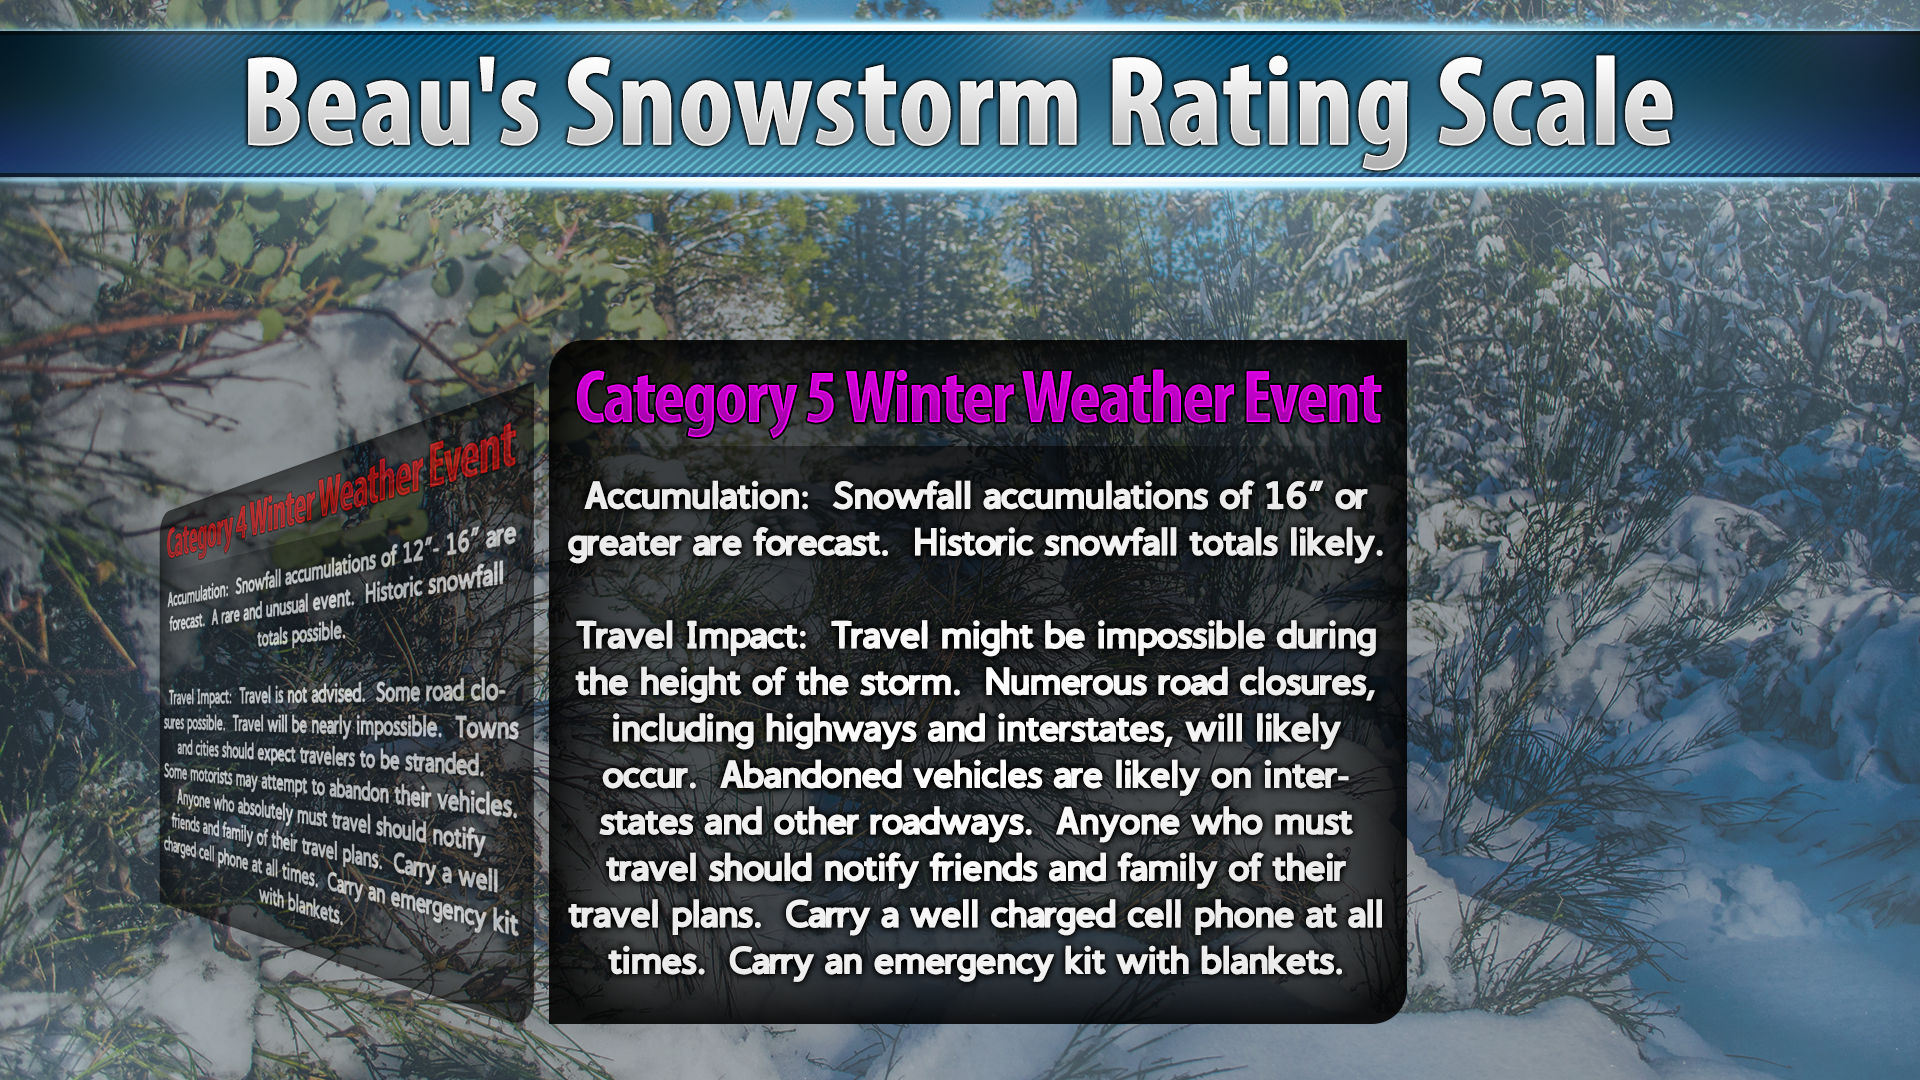
2. Beau’s Snowstorm Rating Scale
3. Winter Weather Aware Day’s
4. The “over – under” snowman graphics
5. What the heck is Milk and Cookies with Beau?
6. Check the latest forecast! Always, always, always check back for updates. Winter storms evolve over time. It is rare that the original forecast verifies. If you want an accurate forecast then you must keep checking back for the most up to date information.
7. How I word my forecast information vs the National Weather Service products
8. Other graphics that you might see me post via social media
As you know, I don’t always do things according to the book. Sometimes that does get me in trouble with other forecasters. But, I listen to all of you and respond accordingly. I know what most of you like. I am also always open to suggestions.
I give you MY forecast. I don’t rip and read other peoples forecasts. I didn’t go to school or study weather for the past 36 years to read you a forecast prepared by someone else. You laugh at that, but there are forecasters who do just that.
These are my goals for the upcoming winter season:
1. I try to bring you the most accurate information possible. So do all local forecasters. But, with that said, my forecast does not always agree with the local National Weather Service. My forecast does not always agree with other local media forecasters. I do, however, try to bring as much continuity to the table as possible. If there are discrepancies in my forecast vs the National Weather Service forecast (or others) then I will explain the differences. Nobody has a monopoly on getting the forecast right every single time. Sometimes my forecast is incorrect. Sometimes their forecast is incorrect. Sometimes we are all on the same weather page and a Kumbaya moment occurs. We have a lot of great forecasters in our region – utilize them.
2. I try to make the forecast easy to understand. Keep in mind that winter storm forecasting is far from an exact science. Perhaps one day it will be. Uncertainty is always going to be part of the process when it comes to forecasting how much snow or ice is going to fall at your house.
3. My goal is to not scare you. Weather is scary enough – no need to add to the drama. No reason to “hype” events. I bring you the information and you decide what to do with the information.
4. My goal is to inform you. This means that I occasionally have to think outside of the box. Thus, you see the graphics I have developed to help you understand the weather that is expected to impact you and your family. I also try to make it fun for the school kids that read my Facebook page and blog. I know several teachers use the information to teach their kids about meteorology.
5. My goal is make the weather interactive. A new way of communicating information. Weather should be a conversation between you and the forecaster. There is at least one local forecaster that has started using Google Hangouts to communicate with their viewers. I think this is a GREAT idea! This is 2014 not 1999. My goal is to make myself available to you for questions and answers. Keep in mind that I volunteer my time, as a community service, to bring you this information. It costs approximately $550 a month to keep the radars, websites, and data streaming. I actually have a (click here)–> page where you can donate to help sponsor the information. You can even subscribe and make a small monthly donation. PayPal allows you to do this (click the make this recurring monthly). If 100 people donated $5 a month then that would cover all expenses. Some of you run businesses and I know this forecast information helps save you money.
Let’s dig right in (not a snow pun)
My forecast coverage area
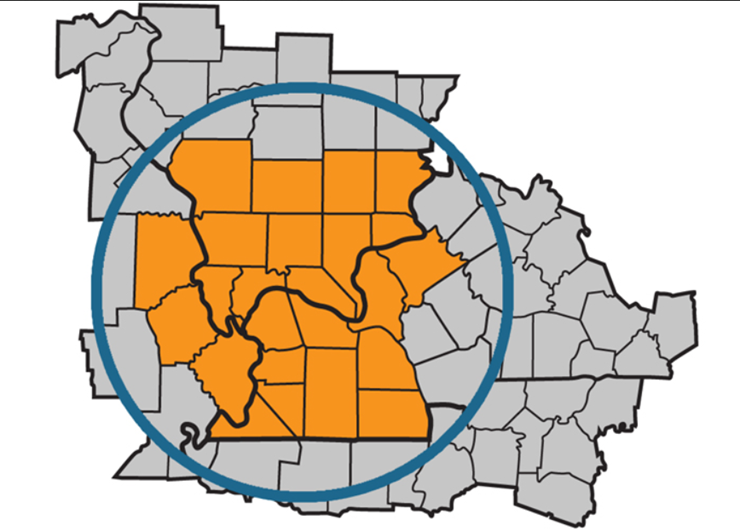
This is my forecast area (the counties in orange). You can determine if your county is on the map. Typically I will mention areas outside of the map as well. But, this is the area I focus on. If you live outside of these counties then you are always welcome to ask me a question. I try to answer all the questions to the best of my ability. Of course, everyone asking me “how much snow will fall in their backyard” is not all that helpful. I try to cover those questions in the forecast and the graphics. So, always check before you ask.
All winter storms are not the same!
Let me say right off the bat that some of this regions higher death tolls (from winter weather events) have not occurred from blizzards, heavy snow, or big ice storms. They actually have occurred during light freezing rain events.
What is the difference between cold rain and freezing rain?
Great question! A cold rain does not instantly freeze on surfaces. Freezing rain is actually a meteorological term for rain that falls when temperatures are at or below 32 degrees. When the droplet of water hits a tree branch, power line, sidewalk, roadway, bridges, or other surfaces it instantly freezes. Freezing rain is what causes ice storms. Our big ice storm in 2008 and 2009 occurred because of freezing rain.
Why do light freezing rain events cause so many deaths? This is because people tend to underestimate the hazard. They look out the window and don’t see a foot of snow or they don’t see huge amounts of sleet or ice. In simple terms – overconfidence. Vehicles can not drive on pure ice. Road conditions are considered extremely dangerous when freezing rain is falling. If road temperatures are at or below 32 degrees then they will quickly become an ice skating rink.
Light freezing rain or freezing drizzle can glaze everything from sidewalks to roadways. It is deceptive because it appears to be wet payment. Instead it is ice. Some people call this black ice.
During a freezing rain event, your first step outside of the house could be a doozy. Some of you know exactly what I mean. Most of us have friends that have broken bones because of a thin layer of ice on their front steps, sidewalks, or decks.
The Beau’s Snowstorm Rating Scale does not take these events into account. Those events will be handled differently. I will clearly state that the concern is glazing. I always mention that these events tend to cause a high number of accidents and vehicle fatalities.
Let’s get right to the graphics that you might see on the blog and Facebook page. Keep in mind that other forecasters have their own graphics. Everyone brings something unique to the weather table. This is what I bring…
Beau’s Snowstorm Rating Scale!
These are the graphics you will see on the Beau Dodson Weather Facebook page, Twitter (I can be found under Beau Dodson) and the Weather Talk blog.
Each image is fairly straight forward. I will tell you what can be expected from the winter weather event. Accumulation (how much snow is expected to fall) and travel impacts. I also mention the historic nature of the event. You will see that the category 4 and 5 storms are rare. If you love lots of snow then keep an eye out for the category 4 and 5 storms (you won’t see those very often – but hey, keep hope alive).
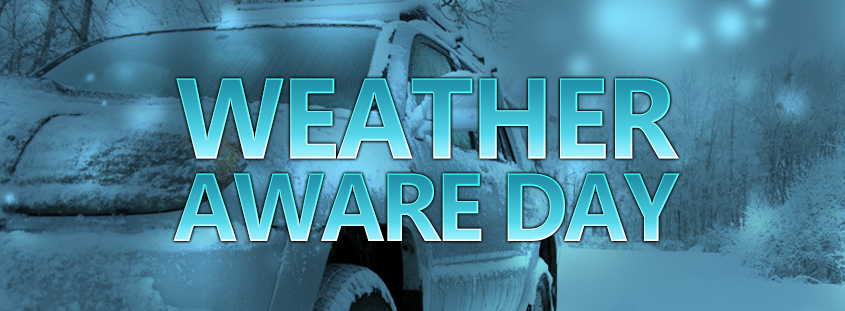
Facebook Cover Photo
During a winter storm you will notice that my Facebook cover photo will change to the graphic below. This graphic simply means that we are expecting a winter precipitation event (snow, sleet, or freezing rain) within the next 48-72 hours.
A Weather Aware Day – that means we should just be aware that weather conditions are about to change. Check back frequently for the latest forecast details.
Beau’s Over-Under Snowman Forecast Graphics!
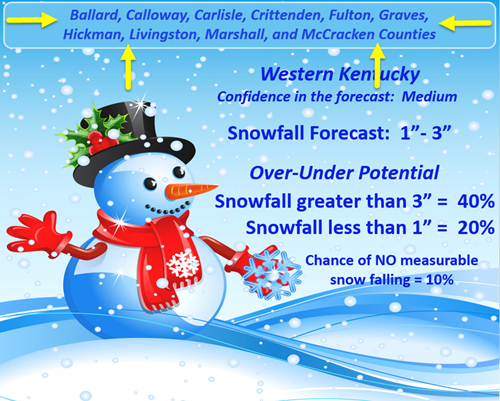
You will noticed the following information on the graphic:
1. State and counties covered
2. Confidence level
3. Snowfall forecast (what I am actually forecasting to fall)
4. The over/under potential
5. Odds of no snow or winter precipitation falling
Counties covered: If you see your county listed then you are considered in the forecast.
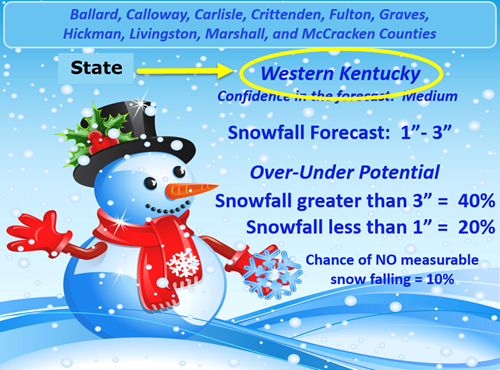
The second part of the graphic will tell you whether the forecast is for Southeast Missouri, Southern Illinois, or Western Kentucky.
Confidence Levels
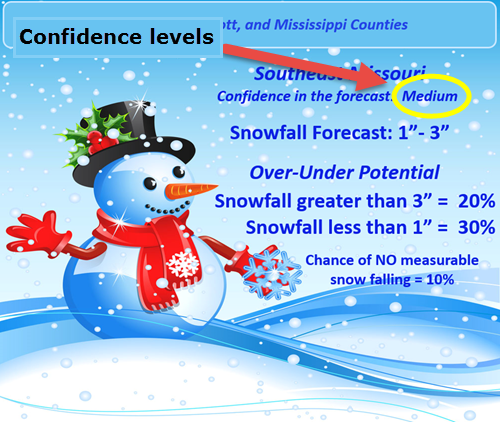
The third part of these graphics will tell you my confidence level in the forecast. The confidence levels are as follows
1. Low: Confidence is low. A 10%-30% chance of the forecast verifying. Major/significant changes are possible in the forecast. Check back for updated information.
2. Medium: A greater than 50/50 chance of the forecast verifying. Some changes or adjustments may still be needed in the forecast. Plan for the forecast to verify.
3. High: A near certain forecast. An 80%-100% chance of the forecast verifying.
This is where you find the confidence levels
The Forecast:
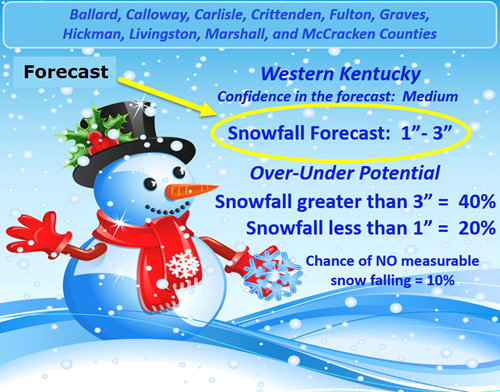
The fourth part of the graphic is the actual forecast. These numbers represent what I am forecasting to fall over the general area.
The Over-Under Potential:
This is the tricky part of the forecast graphic. First off, these numbers do NOT have to add up to 100. These numbers tell you whether or not the storm might produce more snow than expected. These numbers also tell you whether or not I think the storm might produce less snow than expected.
These numbers should give you an idea of what I am thinking. I will give you some examples below. Let me say, I am not a huge fan of probabilities. But, sometimes you gotta do what you gotta do.
A typical winter storm forecast
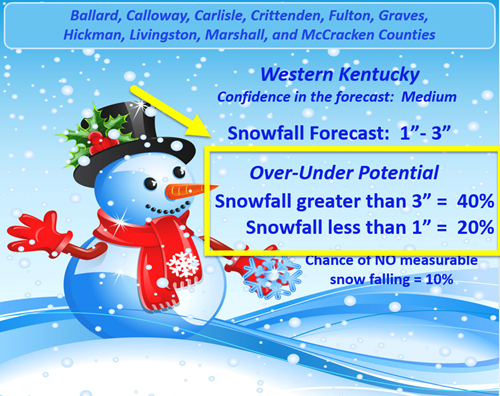
Snowfall Forecast (part of the graphic) 1″-3″
That means that I am expecting most locations to pick up 1″ to 3″ of snow. Easy enough!
The Over-Under Potential part of the graphic
If the graphic states…
Snowfall greater than 3″ = 40%
What does that mean?
That means that there is a 40% chance that some locations (in the counties mentioned) will exceed 3″. Most snow storms have bands of heavier snow. Sometimes these bands can produce a lot more snow. When I am forecasting a banding event then you will notice these probability numbers will go up.
Snowfall less than 1″ = 20%
What does that mean?
That means that there is a 20% chance that the storm will produce less than 1″ in the county outline area. Notice that I am more confident the storm will produce more than 3″ of snow vs less than 1″ of snow.
Chance of NO measurable snow falling.
The fifth part of the graphic is the Chance of NO measurable snow falling. This will tell you how great the risk is for this storm to be a bust. A busted forecast means a forecast didn’t verify. A meteorologists worst nightmare. People in these parts take their snow seriously.
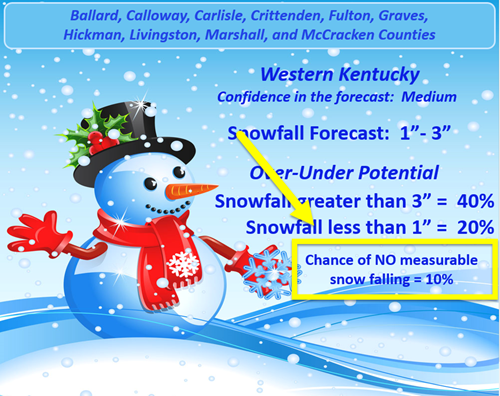
Now (I know you snow lovers will hate this part of the graphic) the Chance of NO measurable snow falling. On this particular graphic I placed the odds at 10%. That means that I am confident this storm is going to produce 1″ to 3″ of snow. That means that I believe this storm won’t be a bust. The 10% probability is a very low number.
If the graphic indicated a 40% chance of NO measurable snow falling, then you snow lovers might have something to worry about. A 40% chance of no snow falling would be a high number (as probabilities go).
With significant winter storms you might notice that I will add categories such as…
Snowfall over 6″ = 30%
Snowfall over 8″ = 20%
Snowfall over 12″ = 10%
You get the idea. Each successive number should be lower than the one above it.
I hope you understand the probability numbers. They represent an important part of my forecast. It is extremely difficult to forecast snow in our region. If you understand the probabilities then that helps me out quite a bit. It should help you be better prepared, as well.
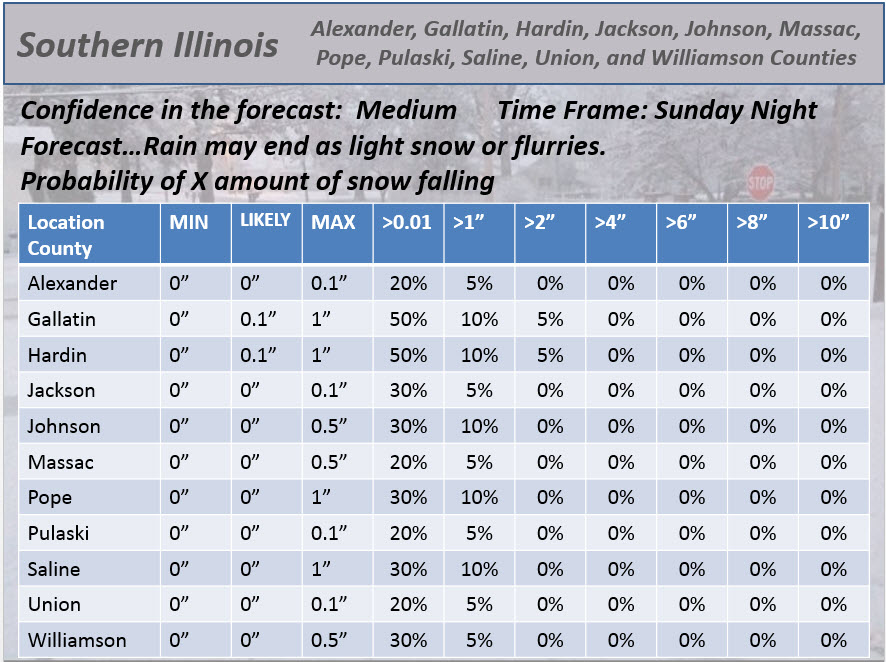
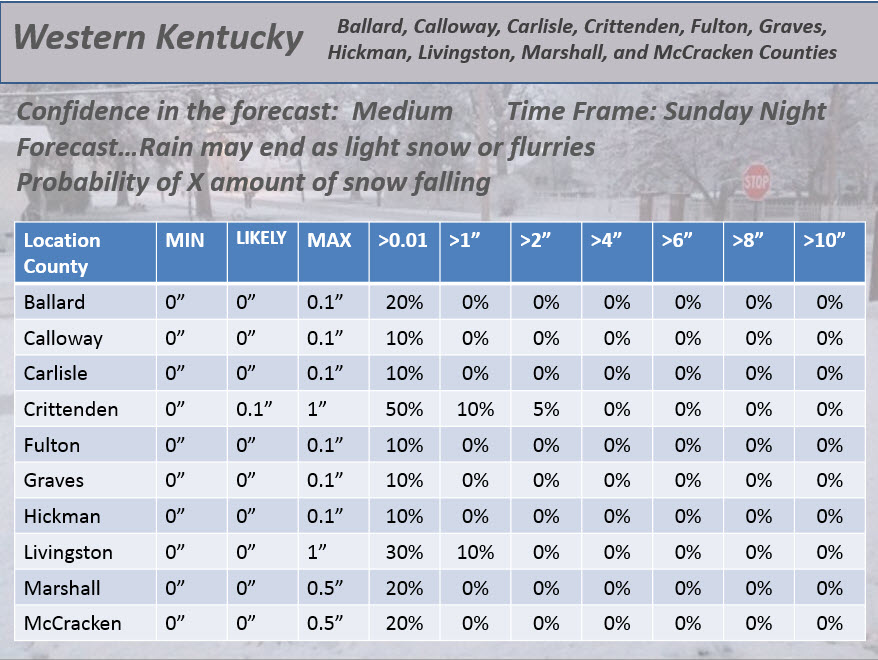
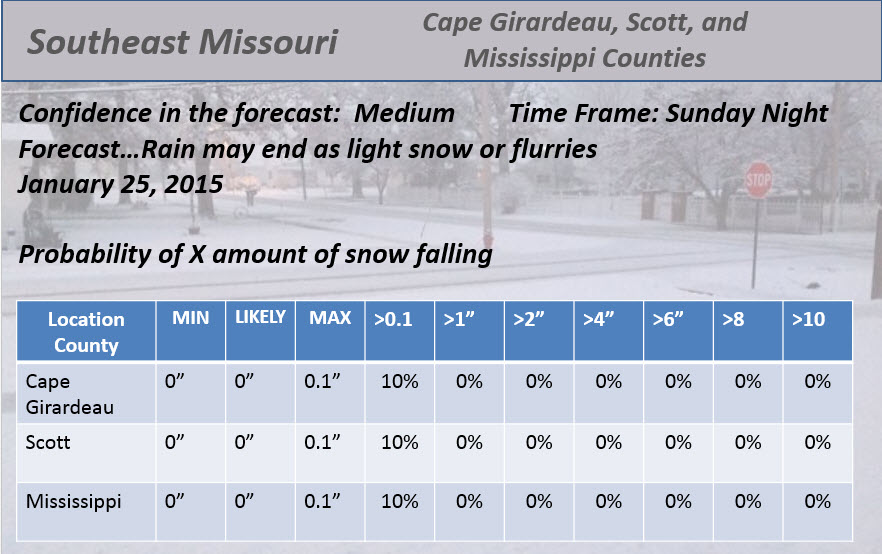
You may also see these probability tables. Depending on the situation and the storm.
These type of charts will give you the probability of X amount of snow falling at your location. The minimum is the least amount expected to fall (it does not always have to be zero). The LIKELY indicates what is expected/forecast. The max is the most snow that could fall with each system.
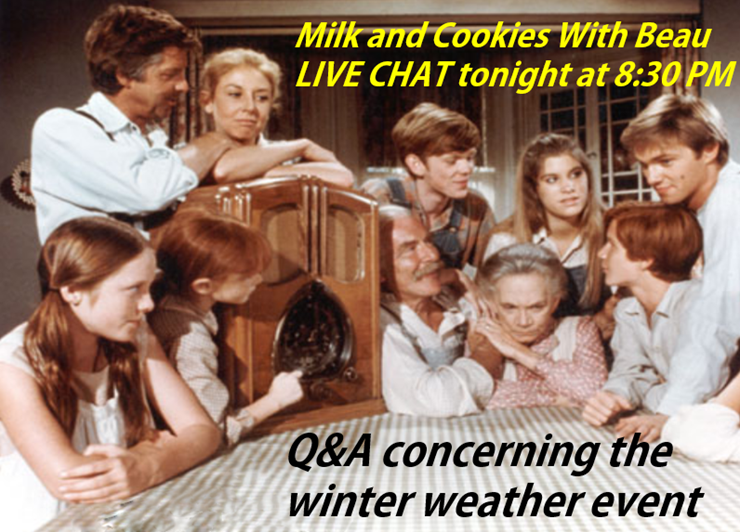
What the heck is “Milk and Cookies with Beau”
This actually started last year. It was the snowiest and coldest winter that our region has experienced in a long time. If you like snow and cold then you loved last winter.
Milk and cookies with Beau are held a few nights before a winter weather event. Usually around 8:30 pm. I will start a thread on my Facebook weather page. I will post the latest model data, my latest forecast thoughts, and open the floor for questions and answers from all of you. A thread is simply a post where you can add comments or replies. Every post on my Facebook page is also known as a thread.
A lot of people like to ask how much snow is going to fall in their town. I am okay with that, but always check to make sure that I have not already answered that question. Also check my graphics. If I have placed 1″-3″ over your county or the county next to you then that answers your question. I can’t get more specific than that.
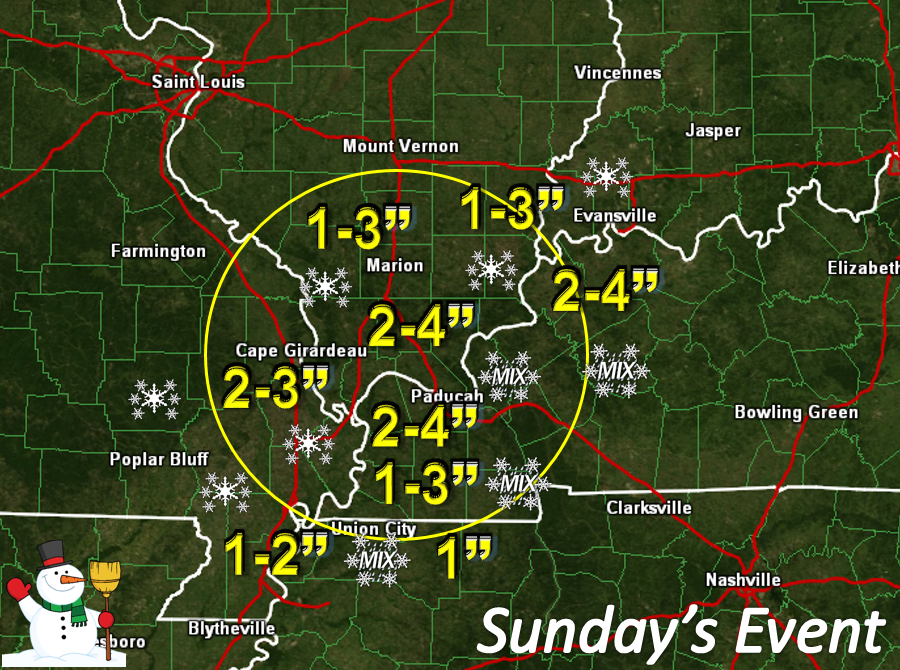
Typical forecast graphic below (see your county in there or see something close to you? Then that is your forecast numbers)
From this graphic you can infer that I am forecasting the highest amounts to be along and near the Ohio River. You see that I am forecasting smaller amounts north and south of that line.
You also notice that some of the snow icons have the word MIX in them. A mix would include freezing rain or sleet. Generally speaking, a mix usually cuts down on snowfall totals. Sleet does not normally accumulate as much as snow.
Check back for the latest update. This is extremely important!
This is probably one of the greatest mistakes that the public makes when it comes to a winter storm forecast. They take one forecast and run with it. If it is Monday and someone is telling you that a winter storm is likely to produce 3″-6″ of snow on Wednesday then you should probably take that forecast with a grain of salt. Accurate forecasters will not tell you how much snow will fall days in advance. This gives forecasters a bad name. But, remember not all forecasters are the same.
You will notice that some forecasters are constantly changing their forecast graphics. You check your weather app at 6 am and see that 3″-6″ of snow is forecast. You check back at 5 pm and see that 1″-3″ of snow is forecast. You check your weather app again and it says that only 1″ of snow is forecast. Forecast fail! Grrrrr
I try to hold off until 24 hours before an event before giving you forecast numbers. Yes, I might tell you on Monday that a significant winter storm is likely to impact our region on Wednesday, but I won’t tell you numbers. I am not the only local forecaster who feels this way. In my opinion, this is the best way to approach winter storm forecasting.
If you are looking for those pretty long range snowfall maps that show up in your Twitter or Facebook feed DAYS in advance of a winter storm then you have come to the wrong location. It is my policy to educate the public that these type of maps do a disservice to everyone involved. RARELY do snowfall maps days in advance verify. Thus, there is no point in posting them all over Twitter and Facebook.
Of course you are always going to get a feel for the forecast from my Facebook page and blog. If a major winter storm is going to produce significant amounts of snow or ice then I will let you know before the 24 hour window. I will build up to the forecast with each passing day.
Four days in advance I might tell you that a developing winter storm might impact our region.
Three days in advance I will start to up the wording and concern (if the storm appears that it will verify).
Two days in advance I will start giving you a general idea of what to expect.
One day before the event I will show you what to expect in each of the different counties. This is when you can expect specific forecast numbers.
During the 2009 ice storm event I gave the public more than 7 days advance notice. That event had a lot of confidence surrounding it.
You can also check the extended forecast part of the blog. This is where I discuss what might occur down the road. Anything past day 4 or 5 is considered an extended forecast.
Always check back for updated forecasts. It is not uncommon for a forecast to change a number of times as a winter storm moves into our region. This is even more true when our region ends up on the dreaded 32 degree line. We can experience rain, freezing rain, sleet and snow all within short distances of each other. I know most of you are familiar with the dreaded 32 degree line. Want to pull your hair out forecasting a storm? Try to forecast where the freezing line will be placed in our region during a winter weather event.
I have witnessed forecasts change dramatically the day of an event. That means that forecasters messed up hours in advance of a winter storm. It happens.
Never count your snowflakes until they hatch – errrrr fall. You can quote me on that.
How I word winter weather forecasts versus how the National Weather Service words their winter weather forecasts.
The National Weather Service has a lot of winter weather products. What is a winter weather product?
Examples of winter weather products from the National Weather Service (they have or are trying to get rid of some of these – they have actually cut down on them from years past)
Winter storm watch
Winter storm warning
Blowing or drifting snow advisory
Blizzard warning
Snow advisory
Winter weather advisory
Freezing rain advisory
Ice storm warning
Heavy Snow Warning
High wind warning
Wind chill warning
Wind chill advisory
Frost advisory
Freeze watch
Freeze warning

Exactly my feeling.
Let me say that we have an excellent National Weather Service Office located in Paducah, Kentucky. Great team of forecasters. I utilize their products just about every single day. I encourage you to check out their web site. I also encourage you to have a NOAA Weather Radio. The NOAA Weather Radio products are issued by our local NWS Office.
There are better ways to communicate winter weather products. The National Weather Service is actually working on this problem. But, like all government agencies it does take time to get from point A to B. I know many NWS meteorologists would love to tinker with the way their products are worded. Unfortunately, they are not allowed to do that. Maybe one day?
I like to simplify everything in life. I know most of you like to cut to the chase, as well.
A typical National Weather Service winter storm warning looks like this
PLEASE FORGIVE ALL THE CAPS – they are not yelling at you! This is how the National Weather Service releases their products (another item they might change in the near future – crossing fingers)
URGENT - WINTER WEATHER MESSAGE
NATIONAL WEATHER SERVICE BURLINGTON VT
300 PM EST MON DEC 8 2014

NYZ028-VTZ001>005-007-091000-
/O.UPG.KBTV.WS.A.0007.141209T1200Z-141210T2200Z/
/O.NEW.KBTV.WS.W.0007.141209T1600Z-141210T2200Z/
EASTERN CLINTON-GRAND ISLE-WESTERN FRANKLIN-ORLEANS-ESSEX-
WESTERN CHITTENDEN-CALEDONIA-
INCLUDING THE CITIES OF...PLATTSBURGH...ALBURGH...SOUTH HERO...
ST. ALBANS...NEWPORT...ISLAND POND...BURLINGTON...ST. JOHNSBURY
300 PM EST MON DEC 8 2014

...WINTER STORM WARNING IN EFFECT FROM 11 AM TUESDAY TO 5 PM EST
WEDNESDAY...

THE NATIONAL WEATHER SERVICE IN BURLINGTON HAS ISSUED A WINTER
STORM WARNING FOR HEAVY SNOW...WHICH IS IN EFFECT FROM 11 AM
TUESDAY TO 5 PM EST WEDNESDAY. THE WINTER STORM WATCH IS NO LONGER
IN EFFECT.

* LOCATIONS...THE NORTHERN CHAMPLAIN VALLEY OF VERMONT AND NEW
  YORK...AS WELL AS THE NORTHEAST KINGDOM OF VERMONT.

* HAZARD TYPES...HEAVY WET SNOW AND MIXED PRECIPITATION.

* ACCUMULATIONS...6 TO 10 INCHES OF HEAVY DENSE SNOW...ALONG WITH
  AROUND A TRACE OF ICE.

* MAXIMUM SNOWFALL RATE...UP TO 1 INCH PER HOUR...MAINLY TUESDAY
  AFTERNOON THROUGH MIDNIGHT.

* TIMING...LIGHT SNOW WILL SPREAD FROM SOUTH TO NORTH ACROSS THE
  AREA TUESDAY AND BECOME HEAVY DURING THE AFTERNOON AND EVENING
  HOURS. HEAVY SNOW WILL LIGHTEN EARLY WEDNESDAY MORNING BUT
  CONTINUE THROUGH THE DAY...MIXING WITH RAIN AND SLEET AT TIMES
  ESPECIALLY ACROSS VERMONT.

* IMPACTS...TRAVEL CONDITIONS WILL BECOME DIFFICULT DUE TO SNOW
  COVERED ROADS AND VISIBILITIES WILL DROP SHARPLY IN THE HEAVY
  SNOW. IN ADDITION...THE WEIGHT OF THE SNOW AND SLEET MAY ALSO
  LEAD TO POSSIBLE POWER OUTAGES.

* WINDS...NORTH 10 TO 20 MPH WITH GUSTS UP TO 30 MPH.

* TEMPERATURES...HIGHS IN THE LOWER TO MID 30S...AND LOWS IN THE
  UPPER 20S TO LOWER 30S.

* VISIBILITIES...REDUCED TO A QUARTER OF A MILE AT TIMES TUESDAY
  NIGHT.

PRECAUTIONARY/PREPAREDNESS ACTIONS...

A WINTER STORM WARNING FOR HEAVY SNOW MEANS SEVERE WINTER WEATHER
CONDITIONS ARE EXPECTED OR OCCURRING.  SIGNIFICANT AMOUNTS OF SNOW
ARE FORECAST THAT WILL MAKE TRAVEL DANGEROUS. ONLY TRAVEL IN AN
EMERGENCY. IF YOU MUST TRAVEL...KEEP AN EXTRA
FLASHLIGHT...FOOD...AND WATER IN YOUR VEHICLE IN CASE OF AN
EMERGENCY.

PLEASE STAY TUNED TO NOAA WEATHER RADIO...YOUR LOCAL MEDIA...OR
GO TO WWW.WEATHER.GOV/BURLINGTON FOR FURTHER UPDATES ON THIS
WEATHER SITUATION.

&&

$$
And there you have it! Did that hurt your eyes? Yes, mine too.
This is how I like to word the forecast for all of you (below)
The National Weather Service advises caution for snow from Tuesday morning through Wednesday afternoon.
Timing – from 11 AM Tuesday until 5 PM Wednesday
Main impact – moderate to heavy snow will create slick road conditions.
Accumulation – Total accumulation of 6 to 10 inches of snow can be expected. Pockets of higher amounts possible.
Other impacts – Heavy wet snow will be difficult to shovel. Use caution. In addition to the snow we are expecting strong winds. Winds may gust above 30 mph at times.
Easy enough, right?
If you want to read the official National Weather Service products, then I usually do post a link to those. Again, I just like to simplify the information for you and your family. The National Weather Service will go into more detail.
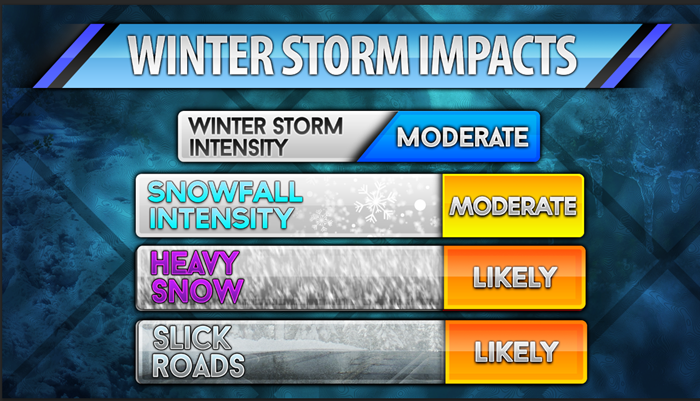
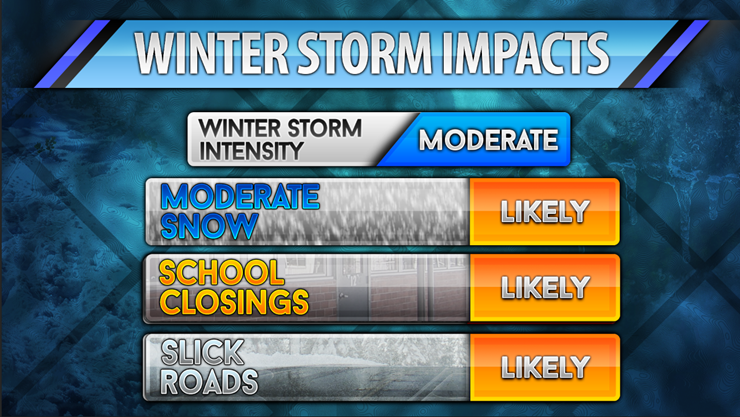
You may also notice that I will occasionally post graphics on Facebook and Twitter that look like the ones below.
They are self explanatory (I think they are – if not then just ask me in the Facebook thread)
OR
So, that is it! Are you prepared for the upcoming winter? I hope so! I am sure we will spend plenty of nights drinking some hot cocoa and watching the weather data stream in.
No matter what nature throws at us this winter let’s have a safe one! Use care during each weather event, as always.
– Beau Dodson


