.
Click one of the links below to take you directly to that section
Do you have any suggestions or comments? Email me at beaudodson@usawx.com
.
.
into www.weathertalk.com and then click the payment tab. Thank you
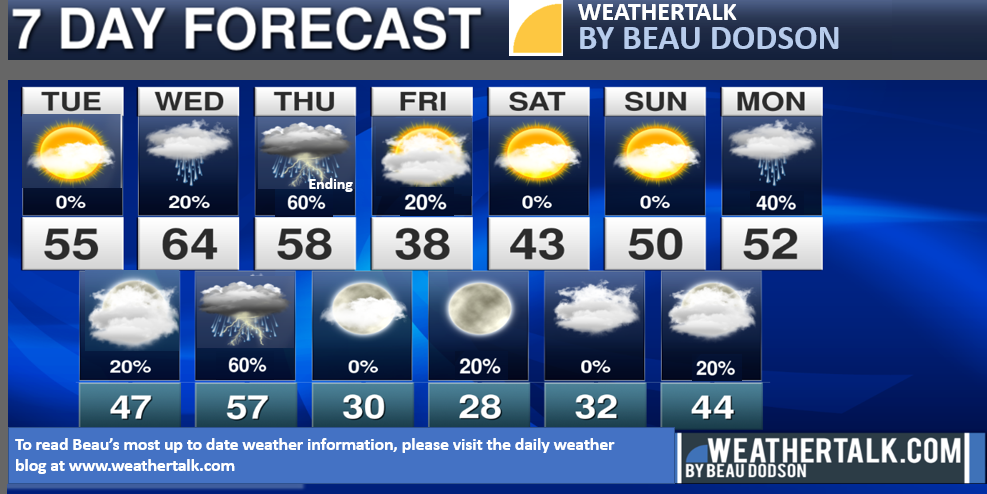
Seven-day forecast for southeast Missouri, southern Illinois, western Kentucky, and western Tennessee.
This is a BLEND for the region. Scroll down to see the region by region forecast.
THE FORECAST IS GOING TO VARY FROM LOCATION TO LOCATION. Scroll down to see the region by region forecast.
Also see Beau Dodson Weather app for that video and that is also where you can find the Missouri Valley, Ohio Valley, and the long range video.
48-hour forecast
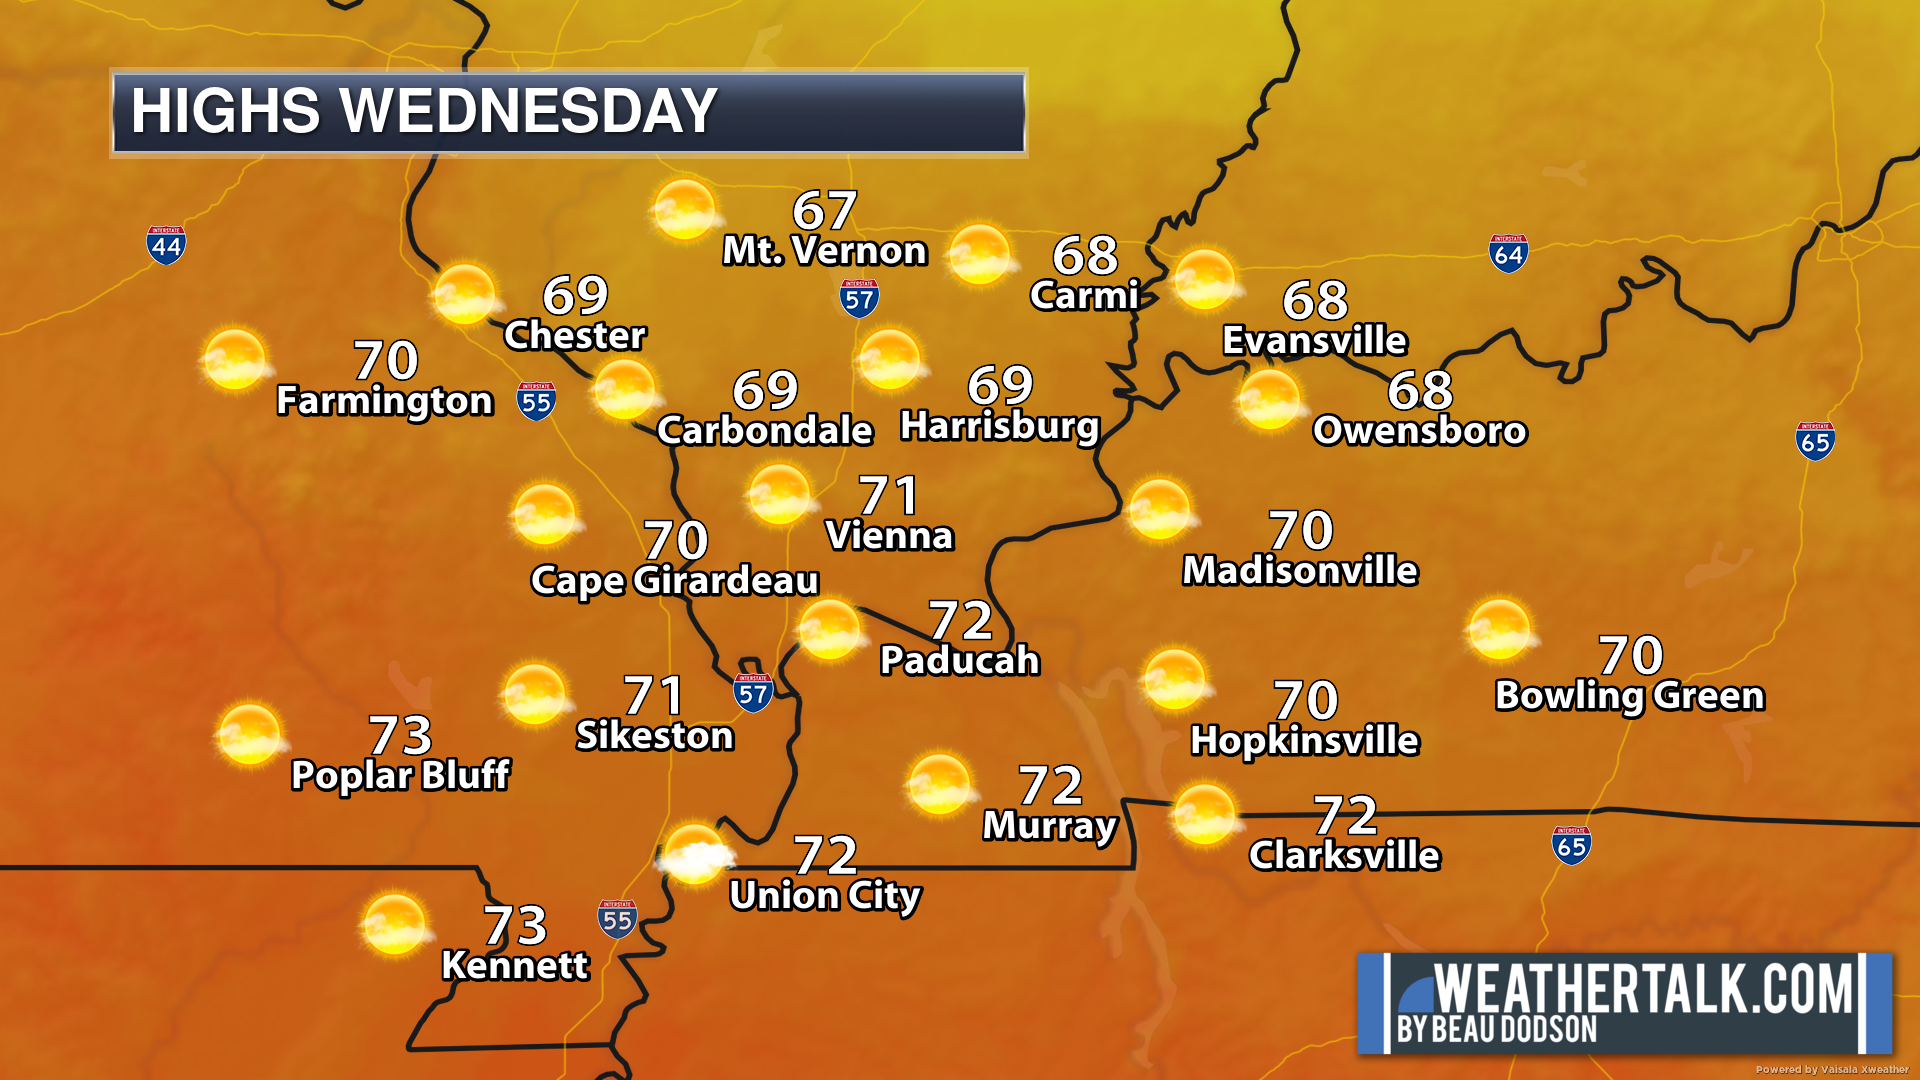
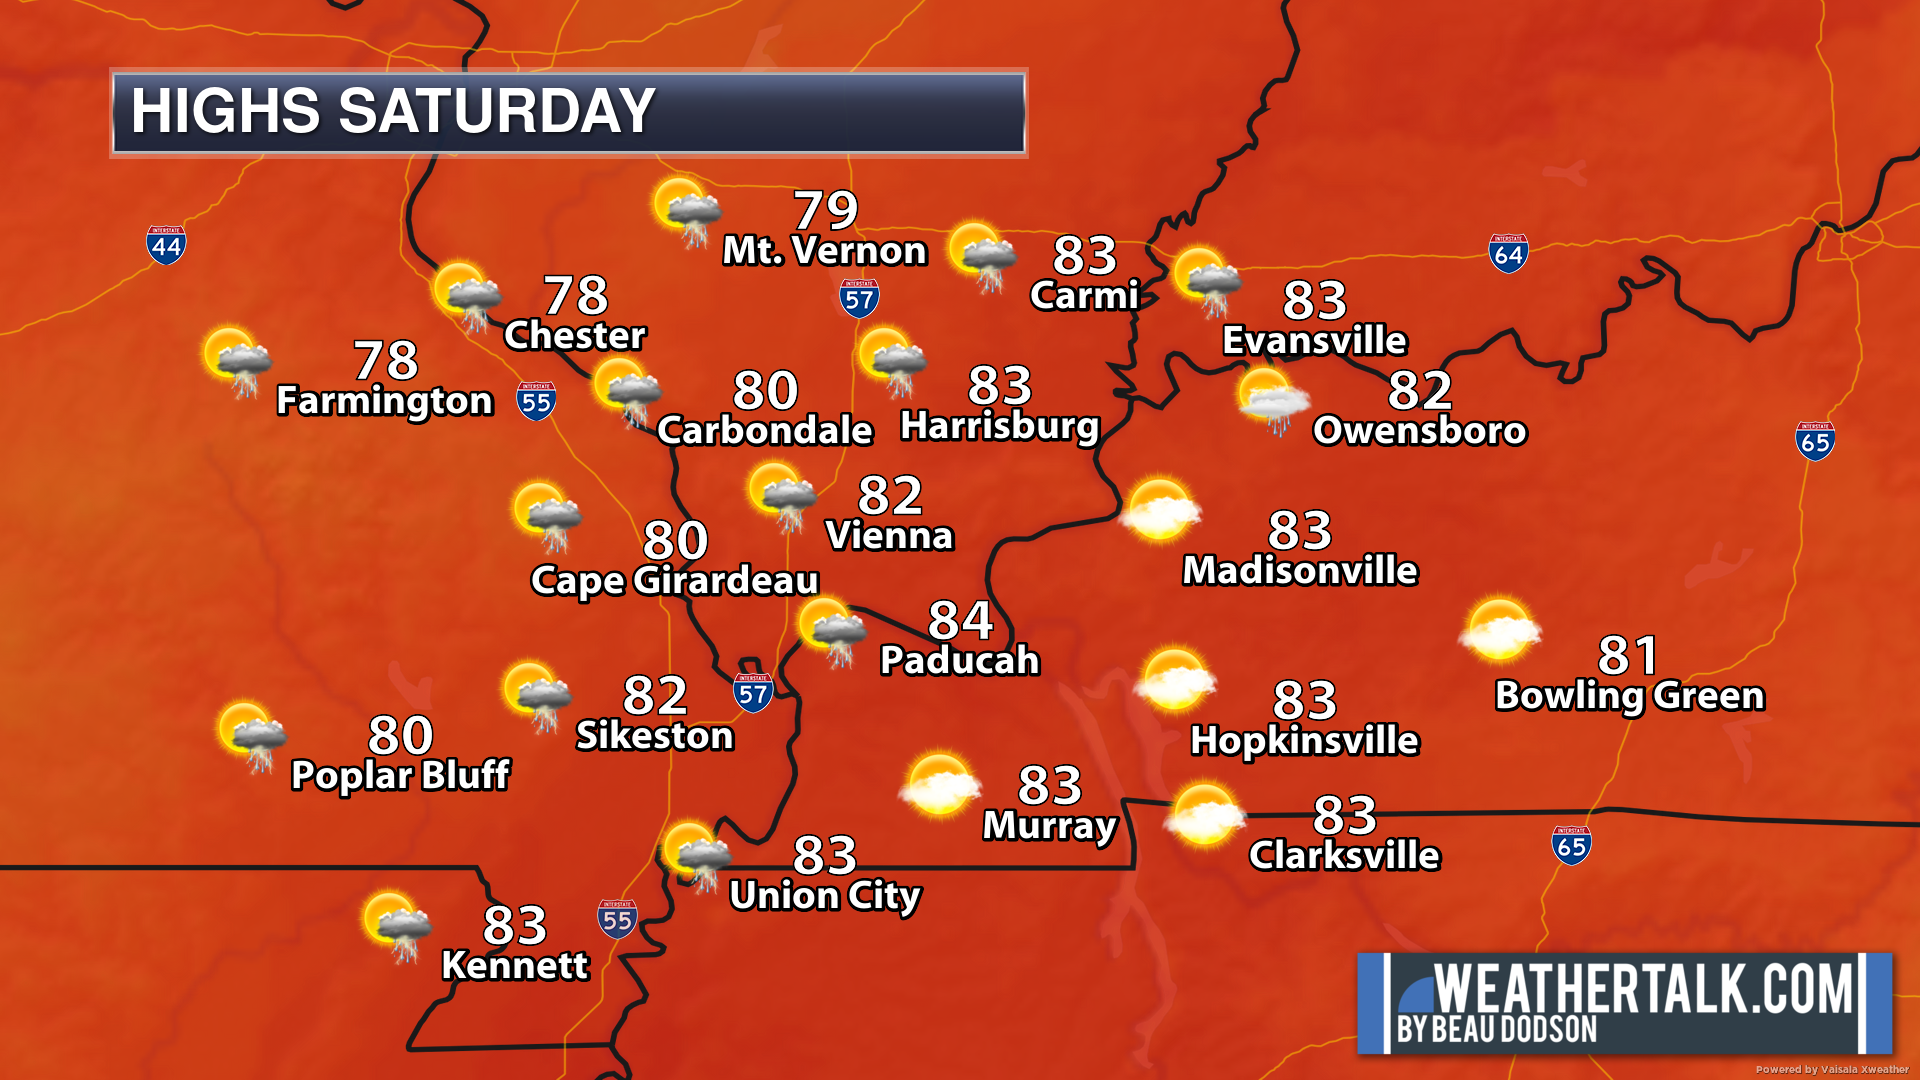
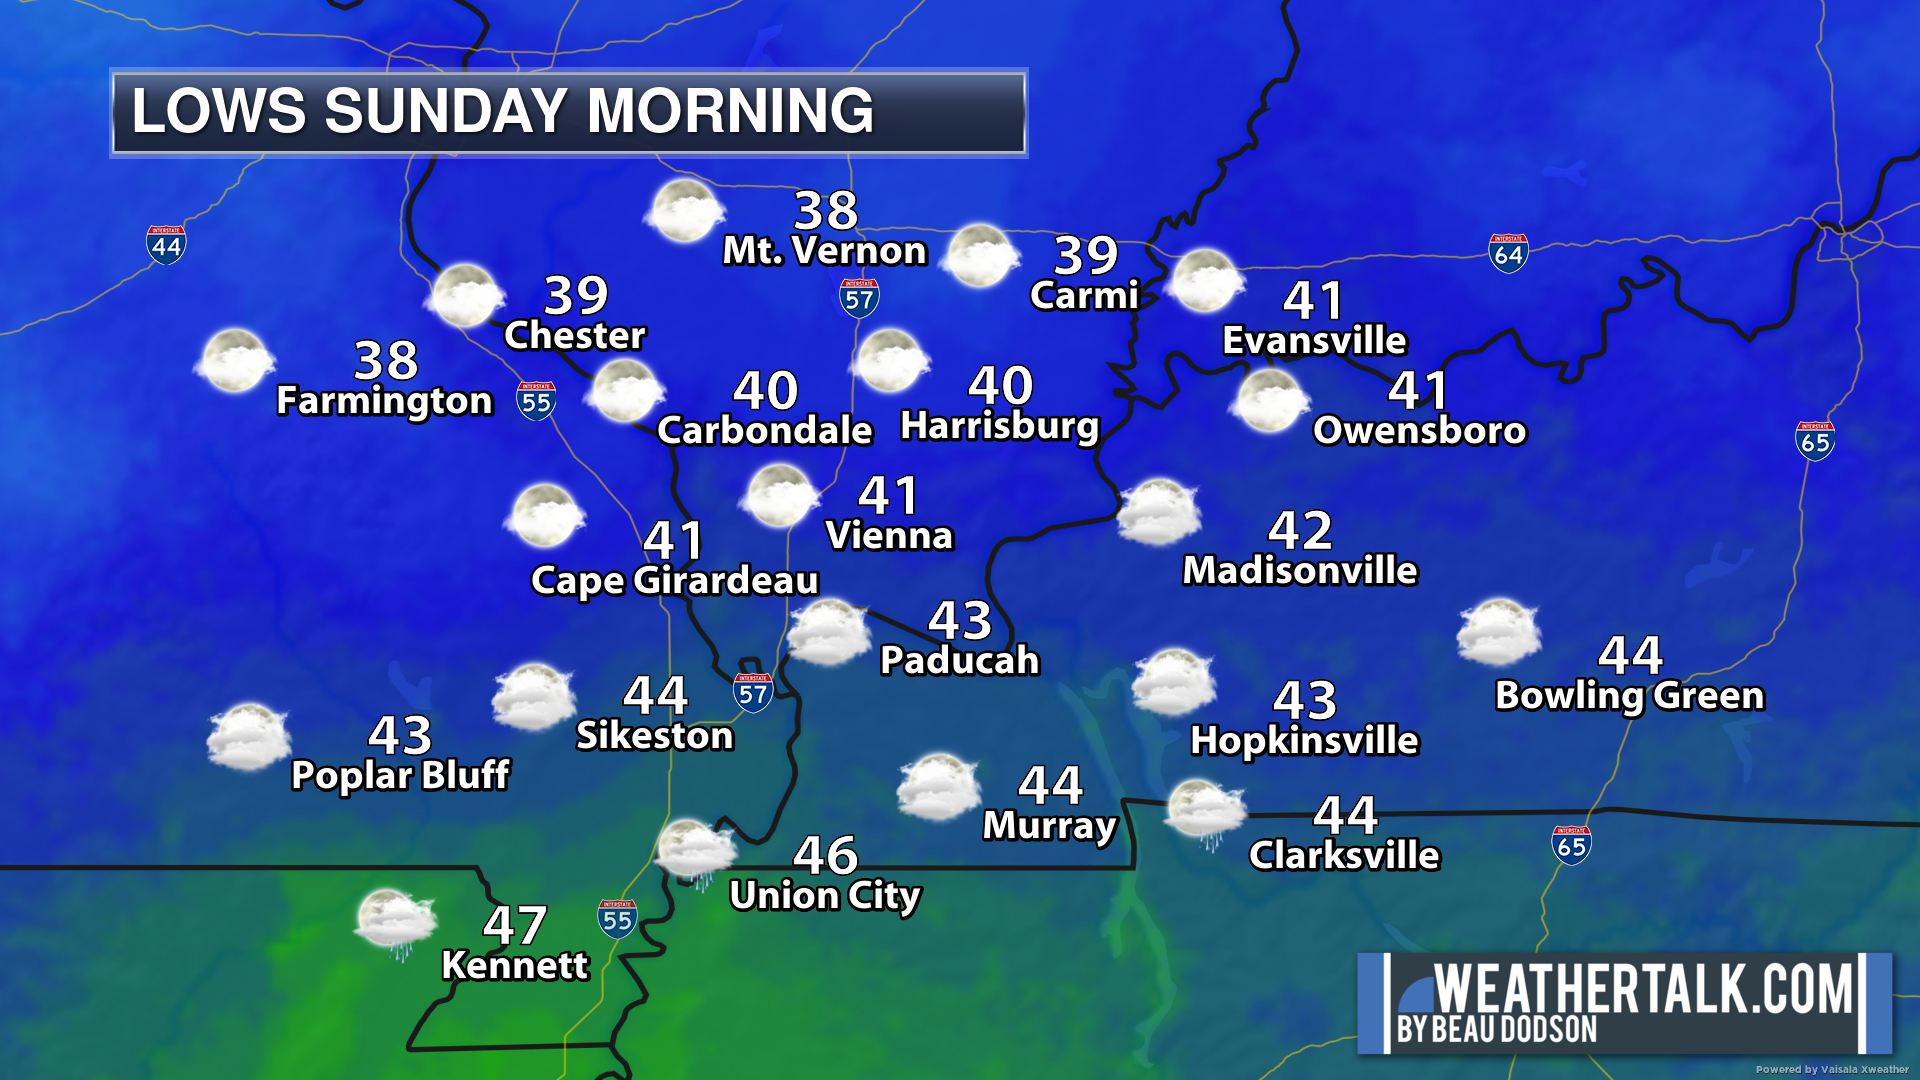
.

.
Tuesday to Tuesday
1. Is lightning in the forecast? Yes. There is a chance of lightning Wednesday night into Thursday morning.
2. Are severe thunderstorms in the forecast? Possible. Some storms could be intense Wednesday night into early Thursday morning. The primary concern will be quarter size hail. A small risk of high winds. There is a low level risk of damaging wind. The tornado risk is even lower.
3. Is flash flooding in the forecast? No.
4. Will the wind chill dip below 10 degrees? No.
5. Is measurable snow and/or sleet in the forecast? No.
6. Is freezing rain/ice in the forecast? No.
Freezing rain is rain that falls and instantly freezes on objects such as trees and power lines
6. Will the heat index exceed 100 degrees? No.
.
.
Tuesday, January 10, 2023
Confidence in the forecast? High Confidence
Tuesday Forecast: Morning clouds. Becoming partly sunny.
What is the chance of precipitation?
Far northern southeast Missouri ~ 0%
Southeast Missouri ~ 0%
The Missouri Bootheel ~ 0%
I-64 Corridor of southern Illinois ~ 0%
Southern Illinois ~ 0%
Extreme southern Illinois (southern seven counties) ~ 0%
Far western Kentucky ~ 0%
The Pennyrile area of western KY ~ 0%
Northwest Kentucky (near Indiana border) ~ 0%
Northwest Tennessee ~ 0%
Coverage of precipitation:
Timing of the precipitation:
Temperature range:
Far northern southeast Missouri ~ 54° to 56°
Southeast Missouri ~ 54° to 56°
The Missouri Bootheel ~ 56° to 58°
I-64 Corridor of southern Illinois ~54° to 56°
Southern Illinois ~54° to 56°
Extreme southern Illinois (southern seven counties) ~ 56° to 58°
Far western Kentucky ~ 54° to 58°
The Pennyrile area of western KY ~ 54° to 56°
Northwest Kentucky (near Indiana border) ~ 53° to 56°
Northwest Tennessee ~ 56° to 58°
Winds will be from this direction: Southwest 6 to 12 mph
Wind chill or heat index (feels like) temperature forecast: 50° to 56°
What impacts are anticipated from the weather?
Should I cancel my outdoor plans? No
UV Index: 2. Low.
Sunrise: 7:09 AM
Sunset: 4:56 PM
.
Tuesday night Forecast: Partly cloudy. Patchy fog and drizzle.
What is the chance of precipitation?
Far northern southeast Missouri ~ 20%
Southeast Missouri ~ 20%
The Missouri Bootheel ~ 20%
I-64 Corridor of southern Illinois ~ 20%
Southern Illinois ~ 20%
Extreme southern Illinois (southern seven counties) ~ 20%
Far western Kentucky ~ 20%
The Pennyrile area of western KY ~ 20%
Northwest Kentucky (near Indiana border) ~ 20%
Northwest Tennessee ~ 20%
Coverage of precipitation: Scattered
Timing of the precipitation: After 10 PM
Temperature range:
Far northern southeast Missouri ~ 40° to 45°
Southeast Missouri ~ 42° to 45°
The Missouri Bootheel ~ 44° to 48°
I-64 Corridor of southern Illinois ~ 40° to 44°
Southern Illinois ~ 44° to 46°
Extreme southern Illinois (southern seven counties) ~ 44° to 46°
Far western Kentucky ~ 44° to468°
The Pennyrile area of western KY ~ 43° to 46°
Northwest Kentucky (near Indiana border) ~ 43° to 46°
Northwest Tennessee ~ 44° to 46°
Winds will be from this direction: South southeast 5 to 10 mph
Wind chill or heat index (feels like) temperature forecast: 40° to 45°
What impacts are anticipated from the weather? Lower visibility in fog. Wet roadways.
Should I cancel my outdoor plans? No
Moonrise: 8:27 PM
Moonset: 9:40 AM
The phase of the moon: Waning Gibbous
.
Wednesday, January 11, 2023
Confidence in the forecast? Medium Confidence
Wednesday Forecast: Increasing clouds. Patchy morning fog. A chance of a light shower.
What is the chance of precipitation?
Far northern southeast Missouri ~ 20%
Southeast Missouri ~ 20%
The Missouri Bootheel ~ 20%
I-64 Corridor of southern Illinois ~ 20%
Southern Illinois ~ 20%
Extreme southern Illinois (southern seven counties) ~ 20%
Far western Kentucky ~ 20%
The Pennyrile area of western KY ~ 20%
Northwest Kentucky (near Indiana border) ~ 20%
Northwest Tennessee ~ 20%
Coverage of precipitation: Isolated
Timing of the precipitation: After 2 PM
Temperature range:
Far northern southeast Missouri ~ 56° to 60°
Southeast Missouri ~ 58° to 62°
The Missouri Bootheel ~ 58° to 62°
I-64 Corridor of southern Illinois ~ 56° to 60°
Southern Illinois ~ 58° to 62°
Extreme southern Illinois (southern seven counties) ~ 58° to 62°
Far western Kentucky ~ 58° to 62°
The Pennyrile area of western KY ~58° to 62°
Northwest Kentucky (near Indiana border) ~ 58° to 62°
Northwest Tennessee ~58° to 62°
Winds will be from this direction: South southeast 5 to 10 mph
Wind chill or heat index (feels like) temperature forecast: 55° to 60°
What impacts are anticipated from the weather? Wet roadways.
Should I cancel my outdoor plans? No
UV Index: 2. Low.
Sunrise: 7:08 AM
Sunset: 4:57 PM
.
Wednesday night Forecast: Increasing clouds. A chance of showers and thunderstorms. Increasing chances late at night. Windy, at times. Some storms could produce hail and gusty wind.
What is the chance of precipitation?
Far northern southeast Missouri ~ 60%
Southeast Missouri ~ 60%
The Missouri Bootheel ~ 60%
I-64 Corridor of southern Illinois ~ 60%
Southern Illinois ~ 60%
Extreme southern Illinois (southern seven counties) ~ 60%
Far western Kentucky ~ 60%
The Pennyrile area of western KY ~60%
Northwest Kentucky (near Indiana border) ~ 60%
Northwest Tennessee ~ 60%
Coverage of precipitation: Scattered
Timing of the precipitation: Increasing chances overnight.
Temperature range:
Far northern southeast Missouri ~ 40° to 42°
Southeast Missouri ~ 40° to 44°
The Missouri Bootheel ~ 48° to 50°
I-64 Corridor of southern Illinois ~ 40° to 44°
Southern Illinois ~ 44° to 48°
Extreme southern Illinois (southern seven counties) ~ 44° to 48°
Far western Kentucky ~ 46° to 48°
The Pennyrile area of western KY ~ 48° to 52°
Northwest Kentucky (near Indiana border) ~ 45° to 48°
Northwest Tennessee ~ 52° to 55°
Winds will be from this direction: Southeast 7 to 14 mph becoming south 10 to 25 mph with higher gusts.
Wind chill or heat index (feels like) temperature forecast: 35° to 50°
What impacts are anticipated from the weather? Wet roadways. Lightning. Hail and gusty wind.
Should I cancel my outdoor plans? No, but monitor the Beau Dodson Weather Radars.
Moonrise: 9:27 PM
Moonset: 10:05 AM
The phase of the moon: Waning Gibbous
.
Thursday, January 12, 2023
Confidence in the forecast? Medium Confidence
Thursday Forecast: Mostly cloudy. Showers and thunderstorms likely. Decreasing coverage through the day. Turning colder with falling temperatures. Windy. Some of the morning storms could produce hail.
What is the chance of precipitation?
Far northern southeast Missouri ~ 30%
Southeast Missouri ~ 40%
The Missouri Bootheel ~ 40%
I-64 Corridor of southern Illinois ~ 60%
Southern Illinois ~ 60%
Extreme southern Illinois (southern seven counties) ~ 60%
Far western Kentucky ~ 60%
The Pennyrile area of western KY ~ 60%
Northwest Kentucky (near Indiana border) ~ 60%
Northwest Tennessee ~ 60%
Coverage of precipitation: Scattered early in the day. Decreasing coverage.
Timing of the precipitation: Decreasing coverage west to east during the morning.
Temperature range:
Far northern southeast Missouri ~ 44° to 46°
Southeast Missouri ~ 46° to 50°
The Missouri Bootheel ~ 50° to 52°
I-64 Corridor of southern Illinois ~ 46° to 48°
Southern Illinois ~ 48° to 54°
Extreme southern Illinois (southern seven counties) ~ 50° to 55°
Far western Kentucky ~ 52° to 55°
The Pennyrile area of western KY ~ 52° to 55°
Northwest Kentucky (near Indiana border) ~ 52° to 55°
Northwest Tennessee ~ 53° to 56°
Winds will be from this direction: South becoming west northwest 10 to 25 mph. Gusty.
Wind chill or heat index (feels like) temperature forecast: 38° to 48°
What impacts are anticipated from the weather? Wet roadways. Lightning. Some storms could produce hail early in the day.
Should I cancel my outdoor plans? Have a plan B and monitor the Beau Dodson Weather radars.
UV Index: 2. Low.
Sunrise: 7:08 AM
Sunset: 4:58 PM
.
Thursday night Forecast:
What is the chance of precipitation? Mostly cloudy. A slight chance of snow flurries. Colder.
Far northern southeast Missouri ~10%
Southeast Missouri ~ 10%
The Missouri Bootheel ~ 10%
I-64 Corridor of southern Illinois ~ 30%
Southern Illinois ~ 30%
Extreme southern Illinois (southern seven counties) ~ 30%
Far western Kentucky ~ 30%
The Pennyrile area of western KY ~ 30%
Northwest Kentucky (near Indiana border) ~ 30%
Northwest Tennessee ~ 10%
Coverage of precipitation: Isolated
Timing of the precipitation: Any given point of time.
Temperature range:
Far northern southeast Missouri ~ 26° to 30°
Southeast Missouri ~ 26° to 30°
The Missouri Bootheel ~ 30° to 32°
I-64 Corridor of southern Illinois ~ 28° to 32°
Southern Illinois ~ 30° to 34°
Extreme southern Illinois (southern seven counties) ~ 32° to 34°
Far western Kentucky ~ 32° to 34°
The Pennyrile area of western KY ~ 32° to 34°
Northwest Kentucky (near Indiana border) ~ 32° to 34°
Northwest Tennessee ~ 32° to 34°
Winds will be from this direction: Northwest 10 to 20 mph. Gusty.
Wind chill or heat index (feels like) temperature forecast: 24° to 28°
What impacts are anticipated from the weather?
Should I cancel my outdoor plans? No
Moonrise: 10:25 PM
Moonset: 10:29 AM
The phase of the moon: Waning Gibbous
.
Friday, January 13, 2023
Confidence in the forecast? High Confidence
Friday Forecast: Partly cloudy. More clouds over the eastern half of the region vs the western half. A chance of snow flurries.
What is the chance of precipitation?
Far northern southeast Missouri ~ 10%
Southeast Missouri ~ 10%
The Missouri Bootheel ~ 10%
I-64 Corridor of southern Illinois ~ 30%
Southern Illinois ~ 30%
Extreme southern Illinois (southern seven counties) ~ 30%
Far western Kentucky ~ 20%
The Pennyrile area of western KY ~ 30%
Northwest Kentucky (near Indiana border) ~ 30%
Northwest Tennessee ~ 10%
Coverage of precipitation: Scattered
Timing of the precipitation: Any given point of time
Temperature range:
Far northern southeast Missouri ~ 34° to 38°
Southeast Missouri ~ 35° to 38°
The Missouri Bootheel ~ 38° to 42°
I-64 Corridor of southern Illinois ~ 34° to 38°
Southern Illinois ~ 34° to 38°
Extreme southern Illinois (southern seven counties) ~ 36° to 38°
Far western Kentucky ~ 36° to 40°
The Pennyrile area of western KY ~ 38° to 40°
Northwest Kentucky (near Indiana border) ~ 38° to 40°
Northwest Tennessee ~ 38° to 40°
Winds will be from this direction: Northwest 10 to 20 mph. Gusty.
Wind chill or heat index (feels like) temperature forecast: 30° to 35°
What impacts are anticipated from the weather?
Should I cancel my outdoor plans? No
UV Index: 2. Low.
Sunrise: 7:09 AM
Sunset: 4:59 PM
.
Friday night Forecast:
What is the chance of precipitation? Decreasing clouds overnight.
Far northern southeast Missouri ~ 0%
Southeast Missouri ~ 0%
The Missouri Bootheel ~ 0%
I-64 Corridor of southern Illinois ~ 0%
Southern Illinois ~ 0%
Extreme southern Illinois (southern seven counties) ~ 0%
Far western Kentucky ~ 0%
The Pennyrile area of western KY ~ 0%
Northwest Kentucky (near Indiana border) ~ 0%
Northwest Tennessee ~ 0%
Coverage of precipitation:
Timing of the precipitation:
Temperature range:
Far northern southeast Missouri ~ 20° to 24°
Southeast Missouri ~ 20° to 24°
The Missouri Bootheel ~ 22° to 25°
I-64 Corridor of southern Illinois ~ 20° to 24°
Southern Illinois ~ 22° to 24°
Extreme southern Illinois (southern seven counties) ~ 22° to 25°
Far western Kentucky ~ 22° to 24°
The Pennyrile area of western KY ~ 22° to 24°
Northwest Kentucky (near Indiana border) ~ 22° to 24°
Northwest Tennessee ~ 22° to 25°
Winds will be from this direction: North northwest 7 to 14 mph.
Wind chill or heat index (feels like) temperature forecast: 20° to 25°
What impacts are anticipated from the weather?
Should I cancel my outdoor plans? No
Moonrise: 11:26 PM
Moonset: 10:53 AM
The phase of the moon: Waning Gibbous
.
Saturday, January 14, 2023
Confidence in the forecast? Medium Confidence
Saturday Forecast: Mostly sunny.
What is the chance of precipitation?
Far northern southeast Missouri ~ 0%
Southeast Missouri ~ 0%
The Missouri Bootheel ~ 0%
I-64 Corridor of southern Illinois ~ 0%
Southern Illinois ~ 0%
Extreme southern Illinois (southern seven counties) ~ 0%
Far western Kentucky ~ 0%
The Pennyrile area of western KY ~ 0%
Northwest Kentucky (near Indiana border) ~ 0%
Northwest Tennessee ~ 0%
Coverage of precipitation:
Timing of the precipitation:
Temperature range:
Far northern southeast Missouri ~ 42° to 44°
Southeast Missouri ~ 43° to 46°
The Missouri Bootheel ~ 44° to 48°
I-64 Corridor of southern Illinois ~ 42° to 44°
Southern Illinois ~ 43° to 46°
Extreme southern Illinois (southern seven counties) ~ 43° to 46°
Far western Kentucky ~ 44° to 46°
The Pennyrile area of western KY ~ 44° to 46°
Northwest Kentucky (near Indiana border) ~ 44° to 46°
Northwest Tennessee ~ 44° to 48°
Winds will be from this direction: North northwest 6 to 12 mph
Wind chill or heat index (feels like) temperature forecast: 42° to 46°
What impacts are anticipated from the weather?
Should I cancel my outdoor plans? No
UV Index: 2. Low.
Sunrise: 7:09 AM
Sunset: 5:00 PM
.
Saturday night Forecast:
What is the chance of precipitation? Becoming partly cloudy.
Far northern southeast Missouri ~ 0%
Southeast Missouri ~ 0%
The Missouri Bootheel ~ 0%
I-64 Corridor of southern Illinois ~ 0%
Southern Illinois ~ 0%
Extreme southern Illinois (southern seven counties) ~ 0%
Far western Kentucky ~ 0%
The Pennyrile area of western KY ~ 0%
Northwest Kentucky (near Indiana border) ~ 0%
Northwest Tennessee ~ 0%
Coverage of precipitation:
Timing of the precipitation:
Temperature range:
Far northern southeast Missouri ~ 28° to 30°
Southeast Missouri ~ 30° to 34°
The Missouri Bootheel ~ 30° to 34°
I-64 Corridor of southern Illinois ~ 30° to 34°
Southern Illinois ~ 30° to 34°
Extreme southern Illinois (southern seven counties) ~ 30° to 34°
Far western Kentucky ~ 30° to 34°
The Pennyrile area of western KY ~ 30° to 34°
Northwest Kentucky (near Indiana border) ~ 30° to 34°
Northwest Tennessee ~ 30° to 34°
Winds will be from this direction:
Wind chill or heat index (feels like) temperature forecast: 26° to 34°
What impacts are anticipated from the weather?
Should I cancel my outdoor plans? No
Moonrise: : PM
Moonset: 11:16 AM
The phase of the moon: Last Quarter
.
Sunday, January 15, 2023
Confidence in the forecast? Medium Confidence
Sunday Forecast: Increasing clouds.
What is the chance of precipitation?
Far northern southeast Missouri ~ 0%
Southeast Missouri ~ 0%
The Missouri Bootheel ~ 0%
I-64 Corridor of southern Illinois ~ 0%
Southern Illinois ~ 0%
Extreme southern Illinois (southern seven counties) ~ 0%
Far western Kentucky ~ 0%
The Pennyrile area of western KY ~ 0%
Northwest Kentucky (near Indiana border) ~ 0%
Northwest Tennessee ~ 0%
Coverage of precipitation:
Timing of the precipitation:
Temperature range:
Far northern southeast Missouri ~ 50° to 55°
Southeast Missouri ~ 50° to 55°
The Missouri Bootheel ~ 50° to 55°
I-64 Corridor of southern Illinois ~ 50° to 55°
Southern Illinois ~ 50° to 55°
Extreme southern Illinois (southern seven counties) ~ 50° to 55°
Far western Kentucky ~ 50° to 55°
The Pennyrile area of western KY ~ 50° to 55°
Northwest Kentucky (near Indiana border) ~ 50° to 55°
Northwest Tennessee ~ 50° to 55°
Winds will be from this direction: South 6 to 12 mph.
Wind chill or heat index (feels like) temperature forecast: 50° to 55°
What impacts are anticipated from the weather?
Should I cancel my outdoor plans? No
UV Index: 2. Low.
Sunrise: 7:08 AM
Sunset: 5:01 PM
.
Sunday night Forecast:
What is the chance of precipitation? Mostly cloudy. A chance of a light shower.
Far northern southeast Missouri ~ 20%
Southeast Missouri ~ 20%
The Missouri Bootheel ~ 20%
I-64 Corridor of southern Illinois ~ 20%
Southern Illinois ~ 20%
Extreme southern Illinois (southern seven counties) ~ 20%
Far western Kentucky ~ 20%
The Pennyrile area of western KY ~ 20%
Northwest Kentucky (near Indiana border) ~ 02%
Northwest Tennessee ~ 20%
Coverage of precipitation: Widely scattered
Timing of the precipitation:
Temperature range:
Far northern southeast Missouri ~ 40° to 44°
Southeast Missouri ~ 40° to 44°
The Missouri Bootheel ~ 40° to 44°
I-64 Corridor of southern Illinois ~ 40° to 44°
Southern Illinois ~ 40° to 44°
Extreme southern Illinois (southern seven counties) ~ 40° to 44°
Far western Kentucky ~ 40° to 44°
The Pennyrile area of western KY ~ 40° to 44°
Northwest Kentucky (near Indiana border) ~ 40° to 44°
Northwest Tennessee ~ 40° to 44°
Winds will be from this direction: South 7 to 14 mph.
Wind chill or heat index (feels like) temperature forecast: 38° to 42°
What impacts are anticipated from the weather? Wet roadways.
Should I cancel my outdoor plans? No
Moonrise: 12:27 PM
Moonset: 11:41 AM
The phase of the moon: Waning Crescent
.
..![]()
** The farming portion of the blog has been moved further down. Scroll down to the weekly temperature and precipitation outlook. You will find the farming and long range graphics there. **
Click the tab below.
![]()
![]()
Click here if you would like to return to the top of the page.
.
Click here if you would like to return to the top of the page.
This outlook covers southeast Missouri, southern Illinois, western Kentucky, and far northwest Tennessee.
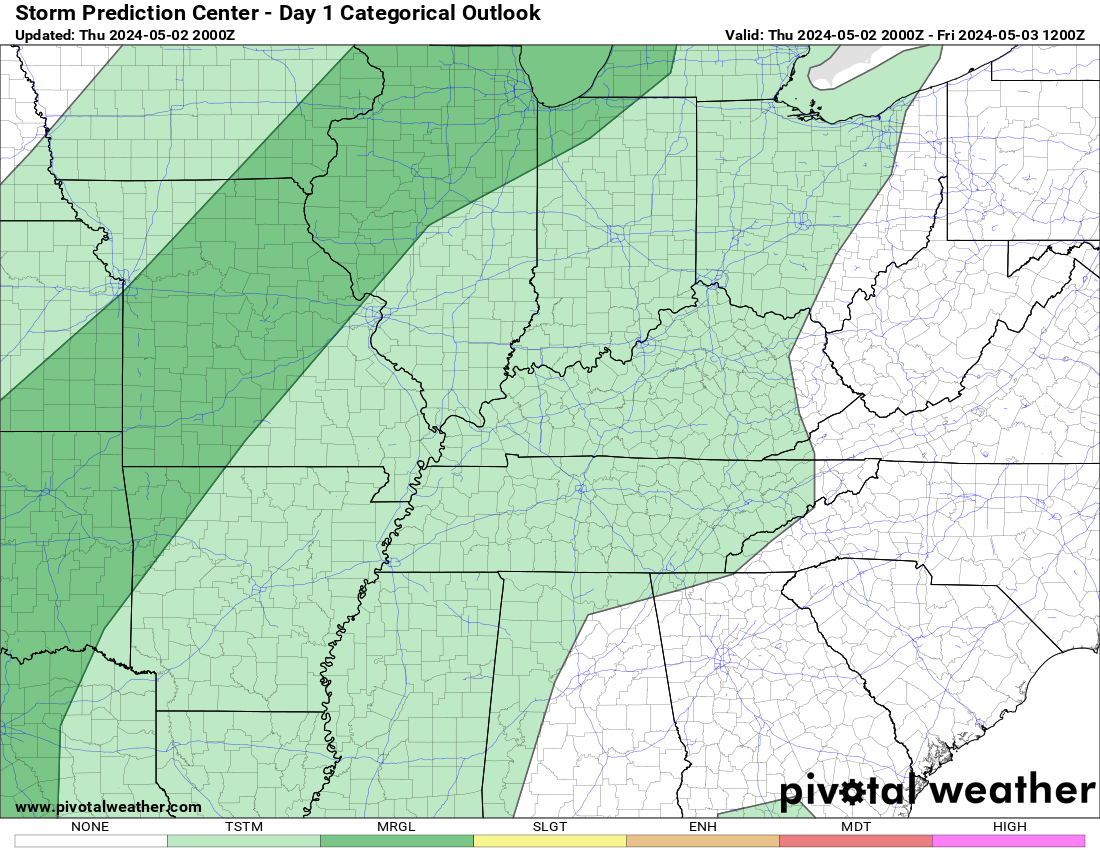
Today through January 12th: There is a low level risk of severe weather Wednesday night and Thursday morning. The primary concern will be hail and gusty wind. This is not an overly impressive set-up, but there is just enough instability for at least a hail risk. Hail up to the size of quarters will be possible.
The risk of damaging wind and tornadoes is low. The SPC did mention the potential, but overall everyone believes the risk for that is low. I will monitor it.
.
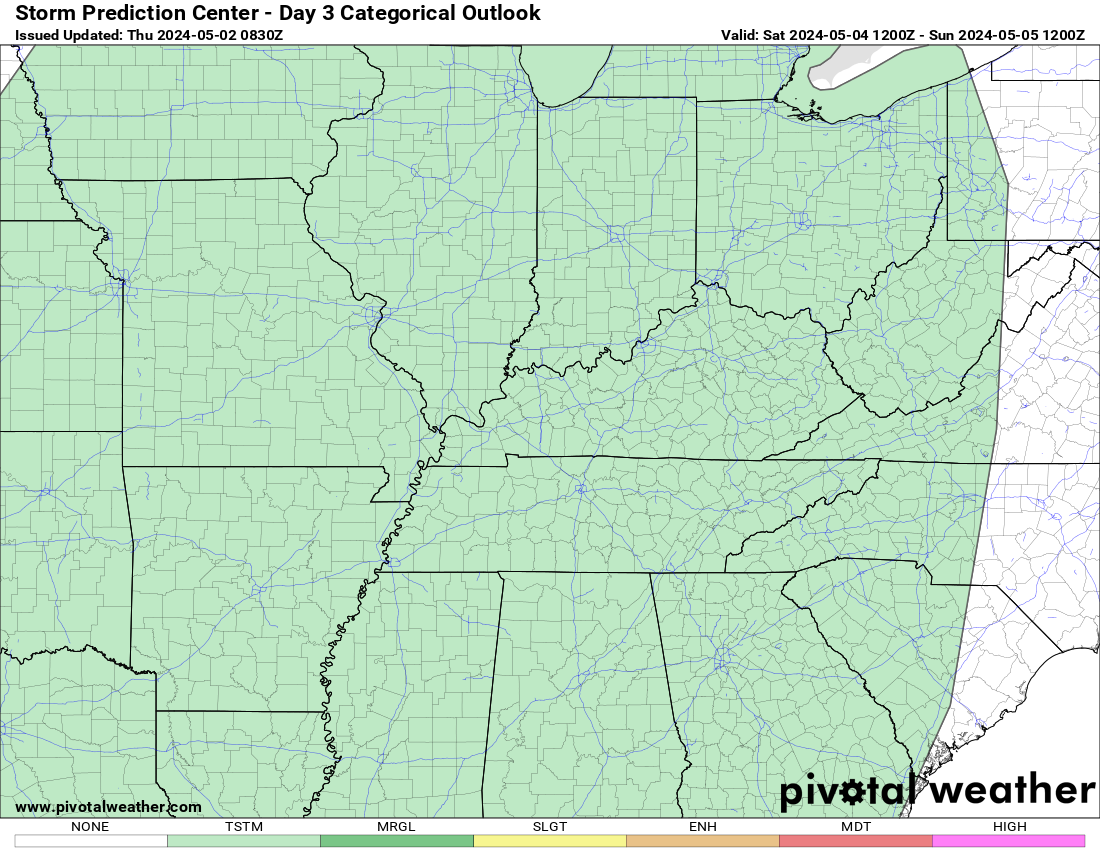
Today’s Storm Prediction Center’s Severe Weather Outlook
Light green is where thunderstorms may occur but should be below severe levels.
Dark green is a level one risk. Yellow is a level two risk. Orange is a level three (enhanced) risk. Red is a level four (moderate) risk. Pink is a level five (high) risk.
One is the lowest risk. Five is the highest risk.
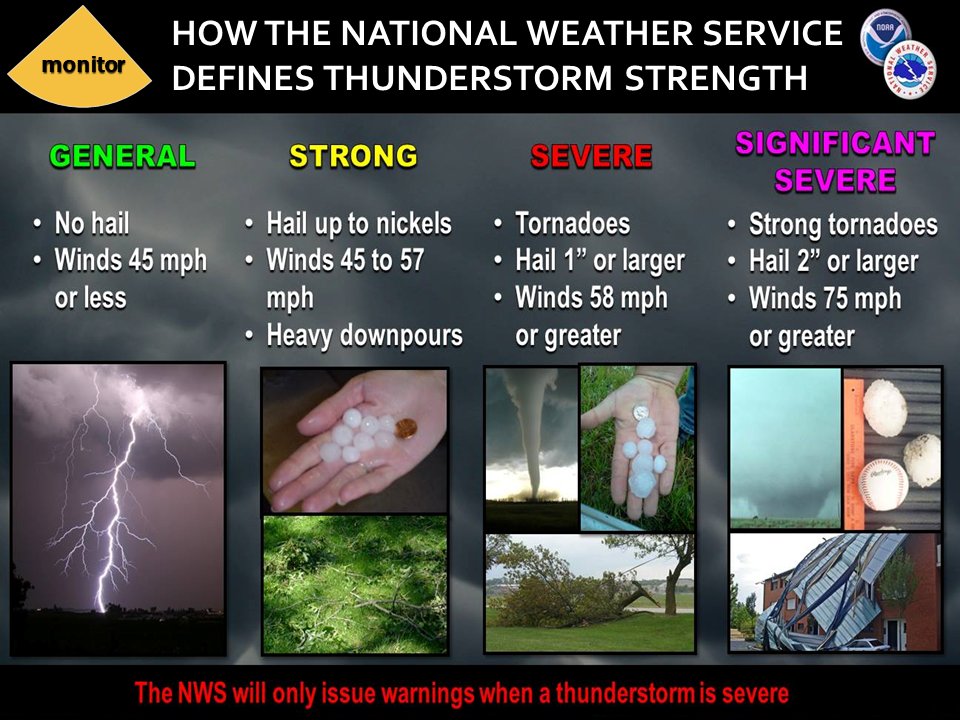
A severe storm is one that produces 58 mph wind or higher, quarter size hail, and/or a tornado.
Explanation of tables. Click here.
.
Tornado Probability Outlook
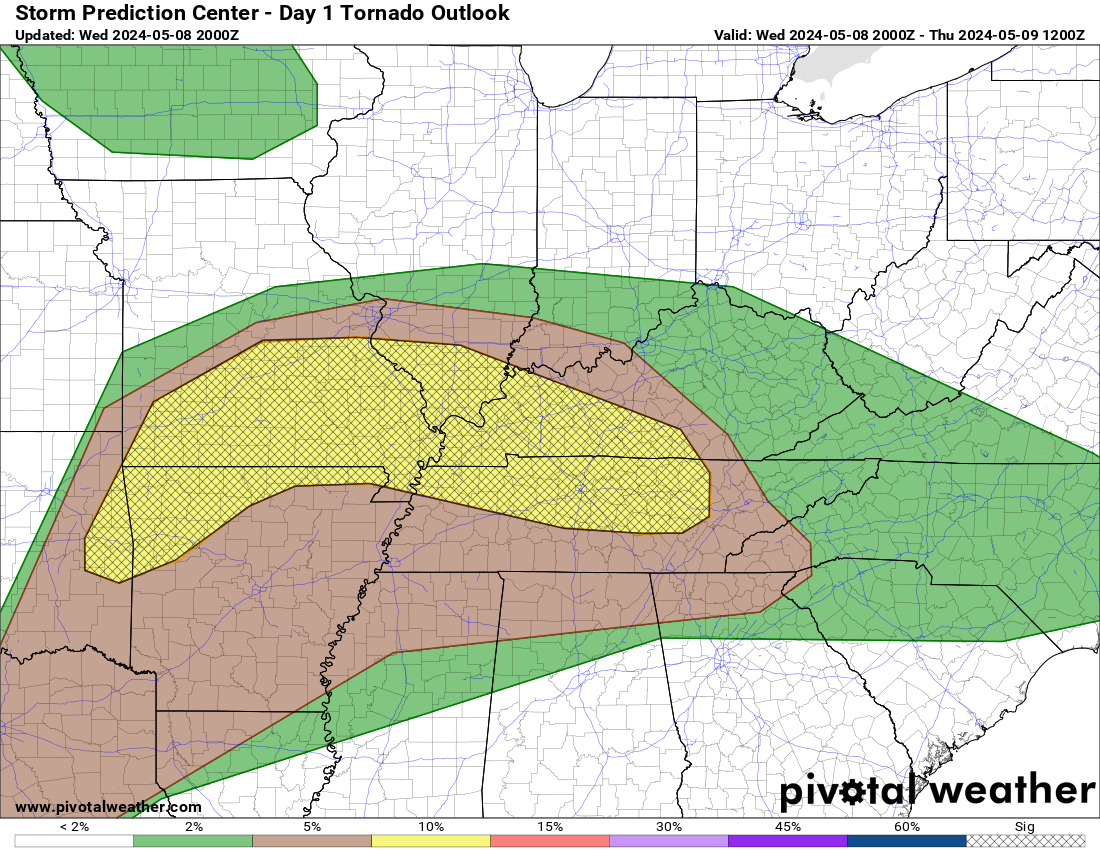
.
Damaging Wind Probability Outlook
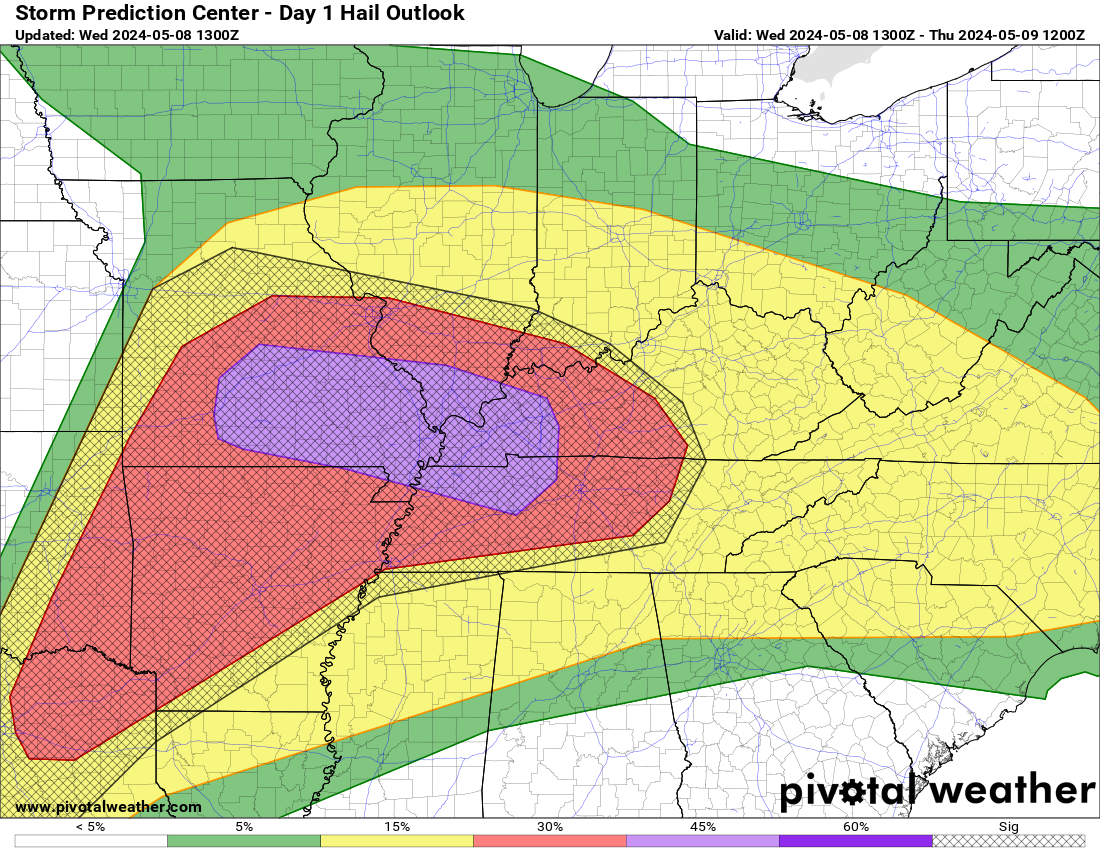
.
Large Hail Probability Outlook
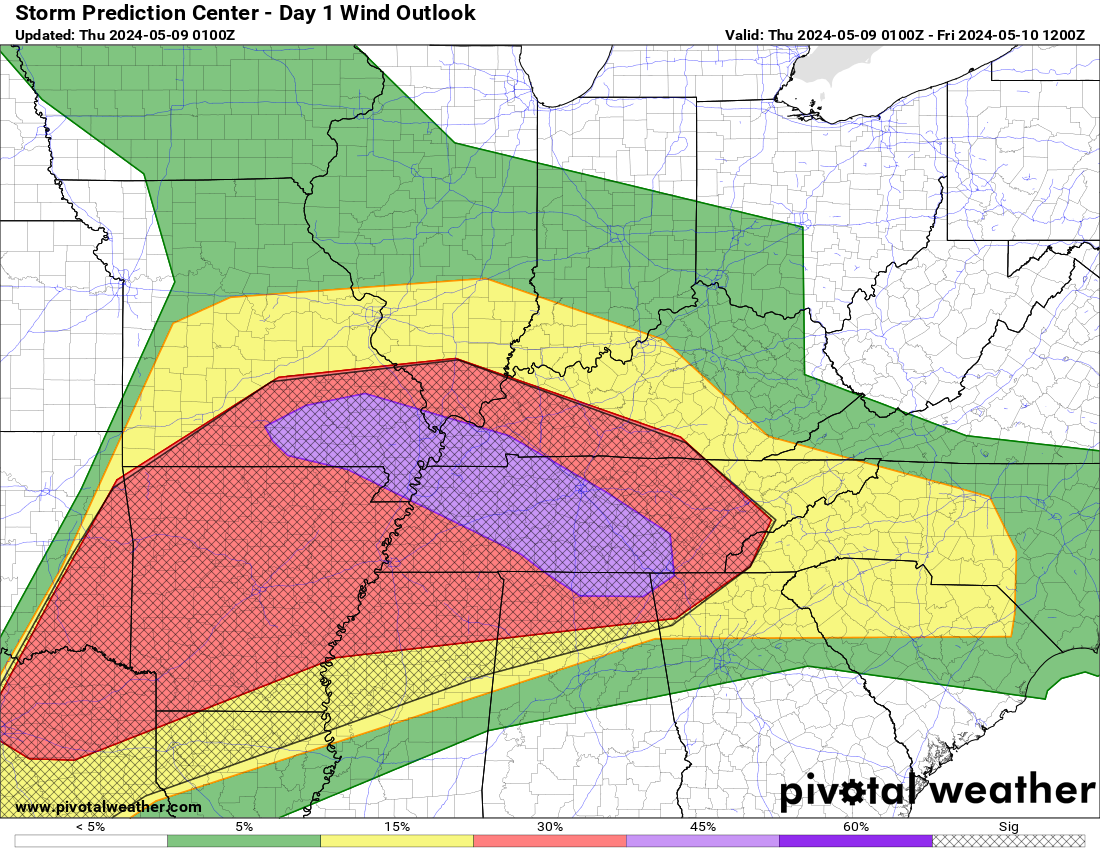
.
Tomorrow’s severe weather outlook.
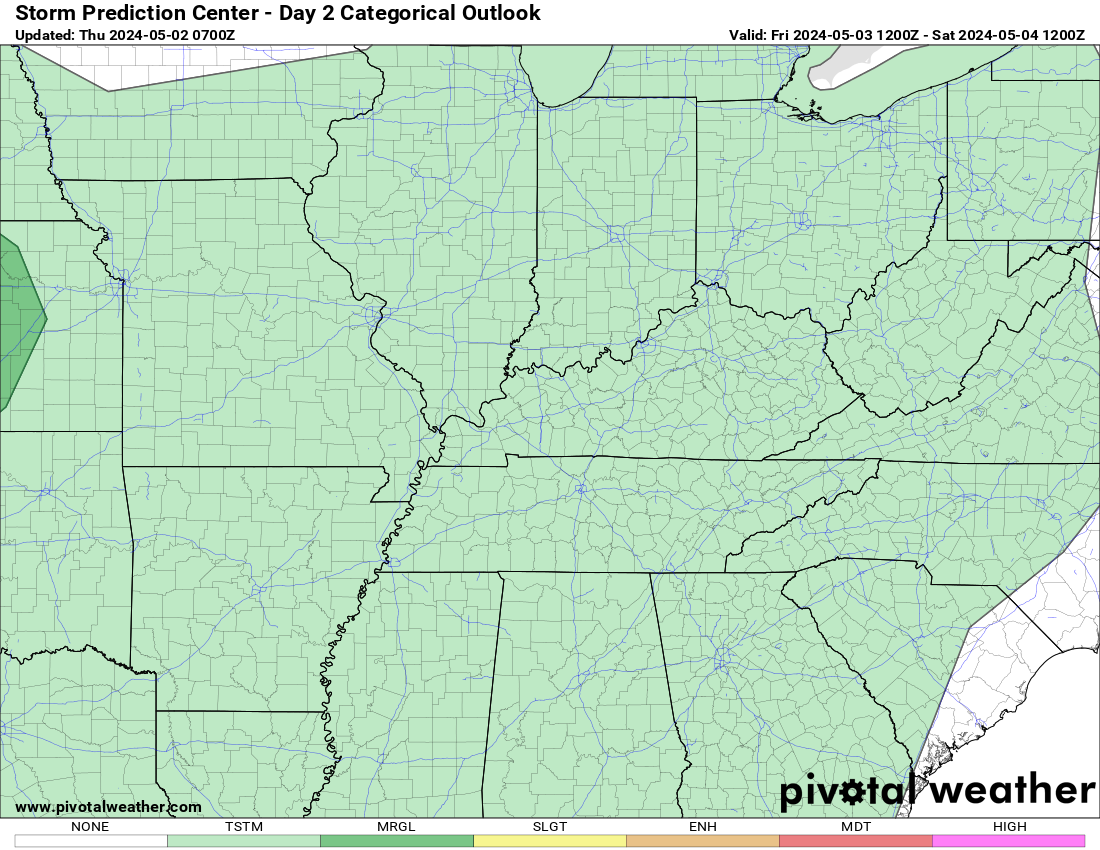
.
Day Three Severe Weather Outlook
.

.
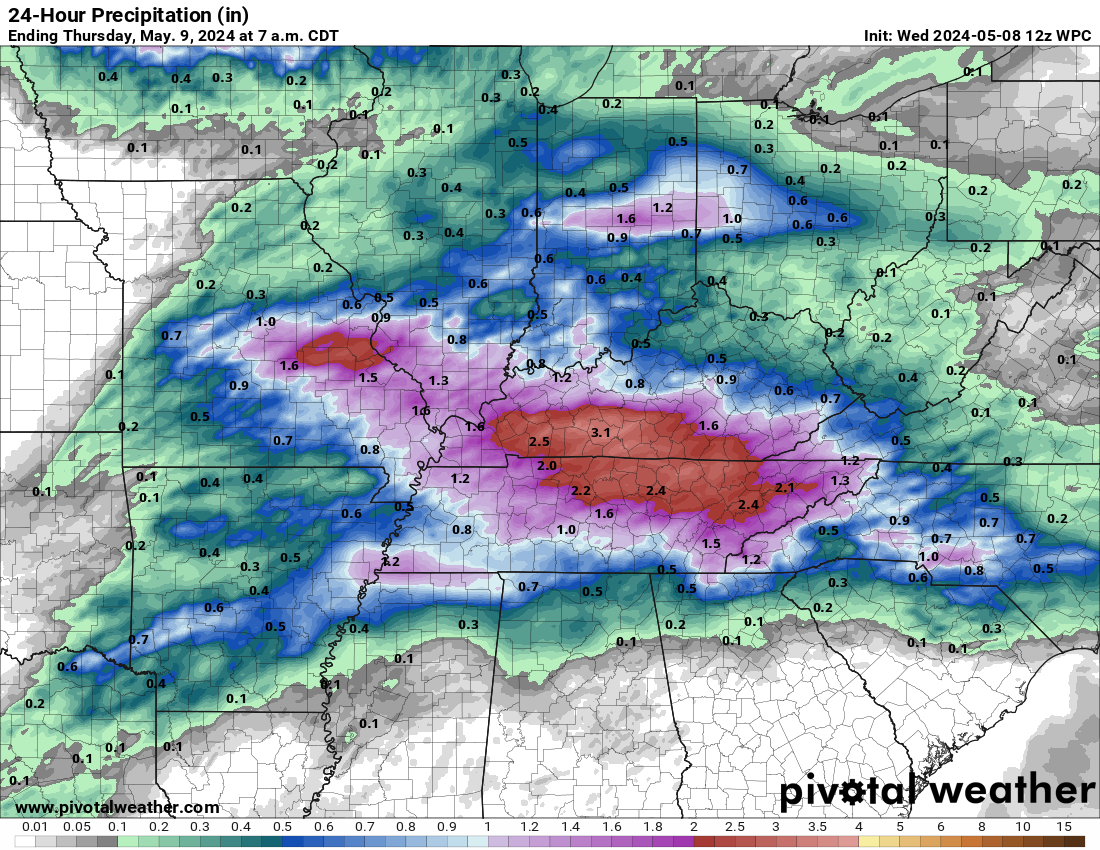
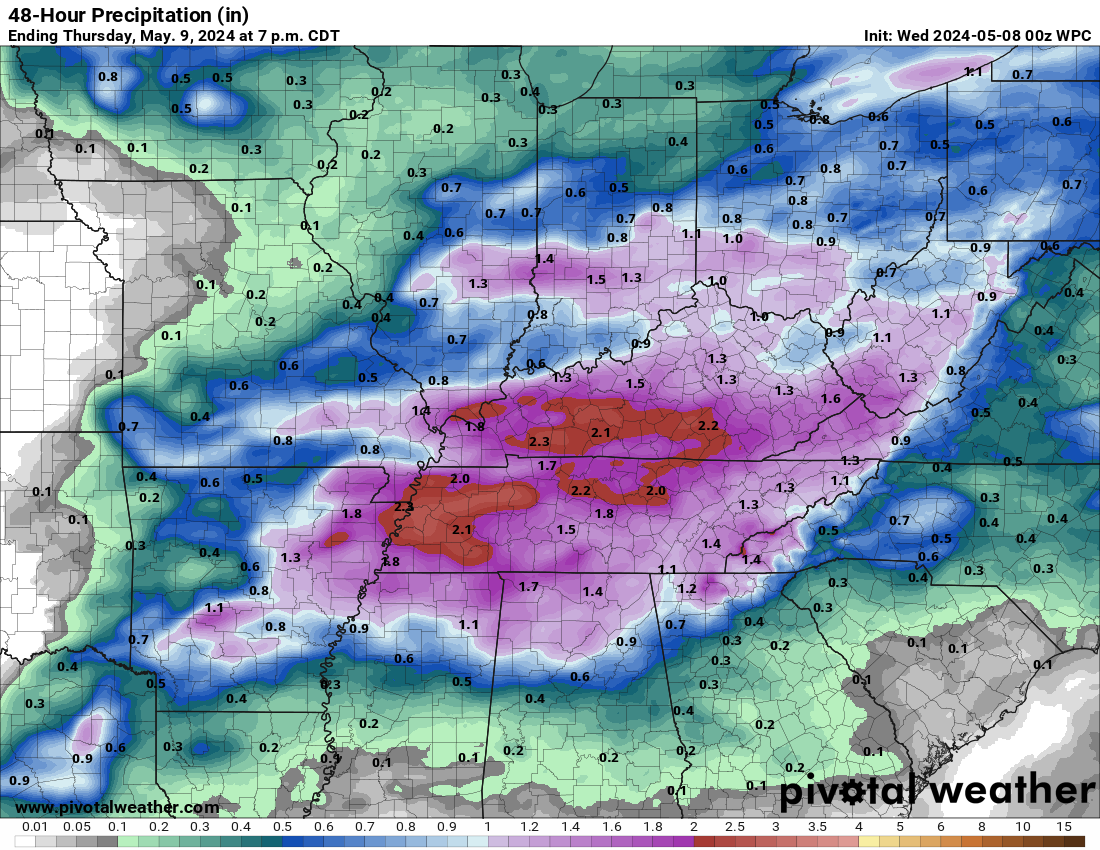
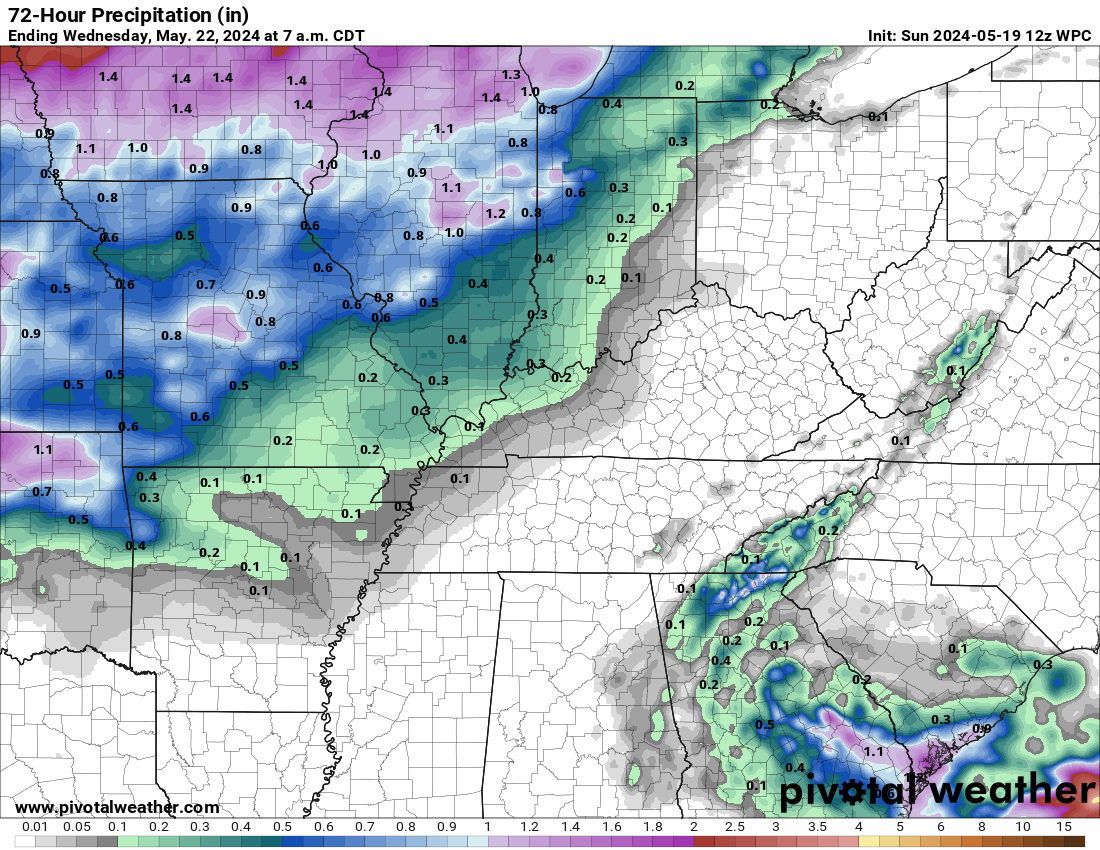
The images below are from NOAA’s Weather Prediction Center.
24-hour precipitation outlook..
 .
.
.
48-hour precipitation outlook.
.
.
72-hour precipitation outlook.
.
.
Weather Discussion
-
- Calm weather today.
- Drizzle possible tonight with fog.
- Rain chances ramp up Wednesday night into Thursday. A few thunderstorms.
- A chance of hail Wednesday night into Thursday morning. I can’t rule out some severe thunderstorm warnings, because of hail. The wind damage and tornado risk is low.
- Parade of systems.
Weather advice:
Hail is possible Wednesday night into Thursday morning. Monitor updates.
Current Weather Discussion
We are waking up to calm weather across the region. There are no weather concerns today or this evening.
Overnight, some patchy fog and drizzle should develop in response to warm southerly winds in front of our next storm system. Use care while driving.
Wednesday will be the in-between weather day. Increasing clouds with only a slight chance of a light shower.
A deepening area of low pressure will form well to our west and begin to move in our direction Wednesday and Wednesday night.
This will cause southerly winds to increase and become gustier as we move into Wednesday night.
Wednesday and Wednesday night will be mild because of the southerly winds.
Warme and moist air will stream northward ahead of the cold front Wednesday night.
This will set the stage for the developemnt of showers and embedded thunderstorms.
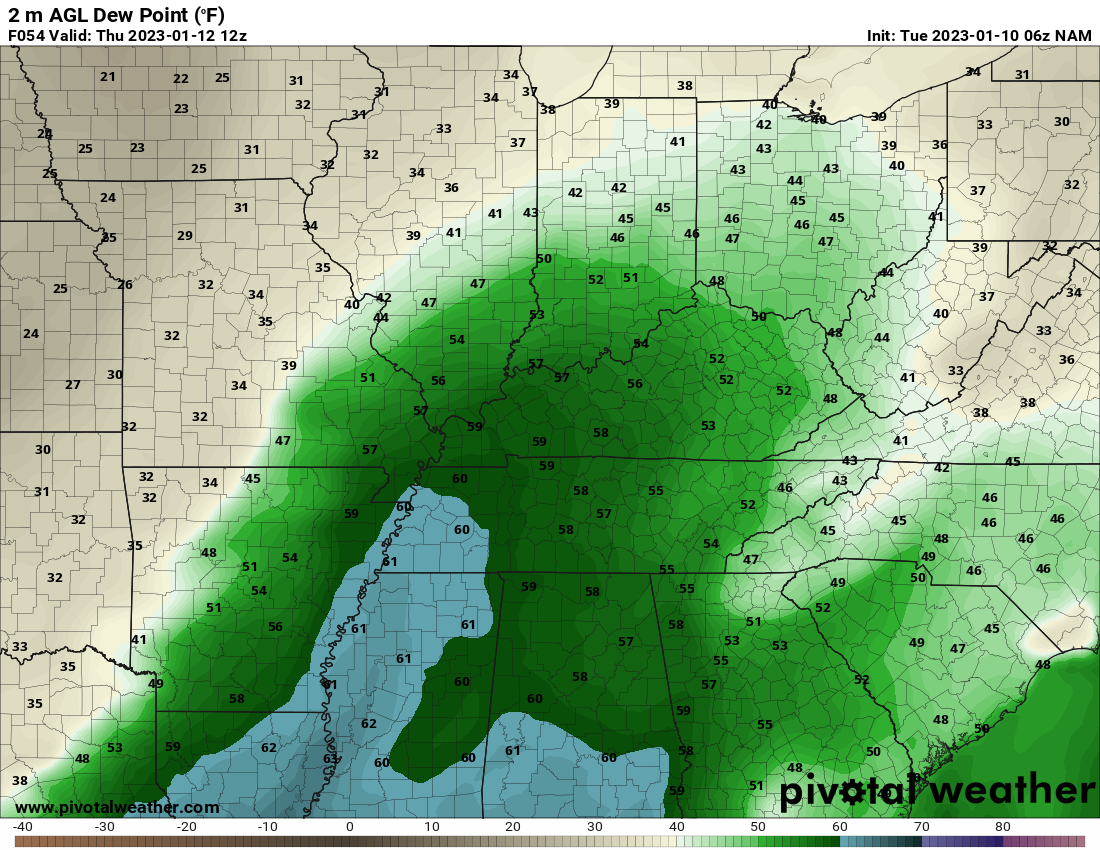
Thankfully, dew points won’t be all that high. Dew point is a measure of moisture.
Dew point map. You can see the higher dew points mainly to our south in southwest Tennessee, eastern Arkansas, and Mississippi.
Typically, during January, when I start thinking about severe weather, I look for dew points in the 58+ range. This system will likely struggle to reach that number. It isn’t impossible, but it will be a bit of a struggle.
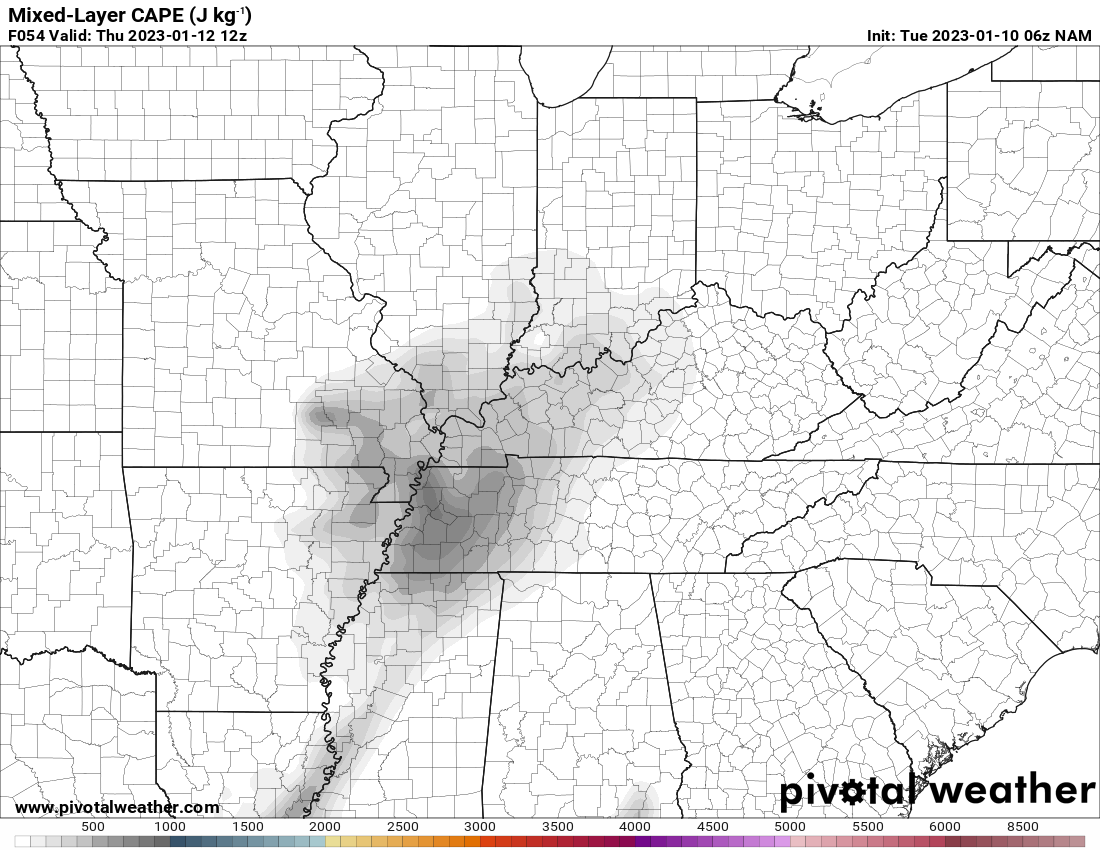
There will be some CAPE, at least aloft. CAPE is energy that thunderstorms feed off of.
Here is a map showing mixed layer CAPE. Surface based CAPE is when we start to worry about damaging wind and tornadoes.
The Storm Prediction Center does include us in a small risk of wind damage and tornadoes (mainly our far southern counties). I think this is a stretch to expect tornadoes. But, I suppose we will need to keep an eye on it.
Most of this CAPE will be elevated.
This elevated CAPE will cause thunderstorms to develop late Wednesday night and Thursday morning. Some of these thunderstorms could become severe with hail being the primary concern.
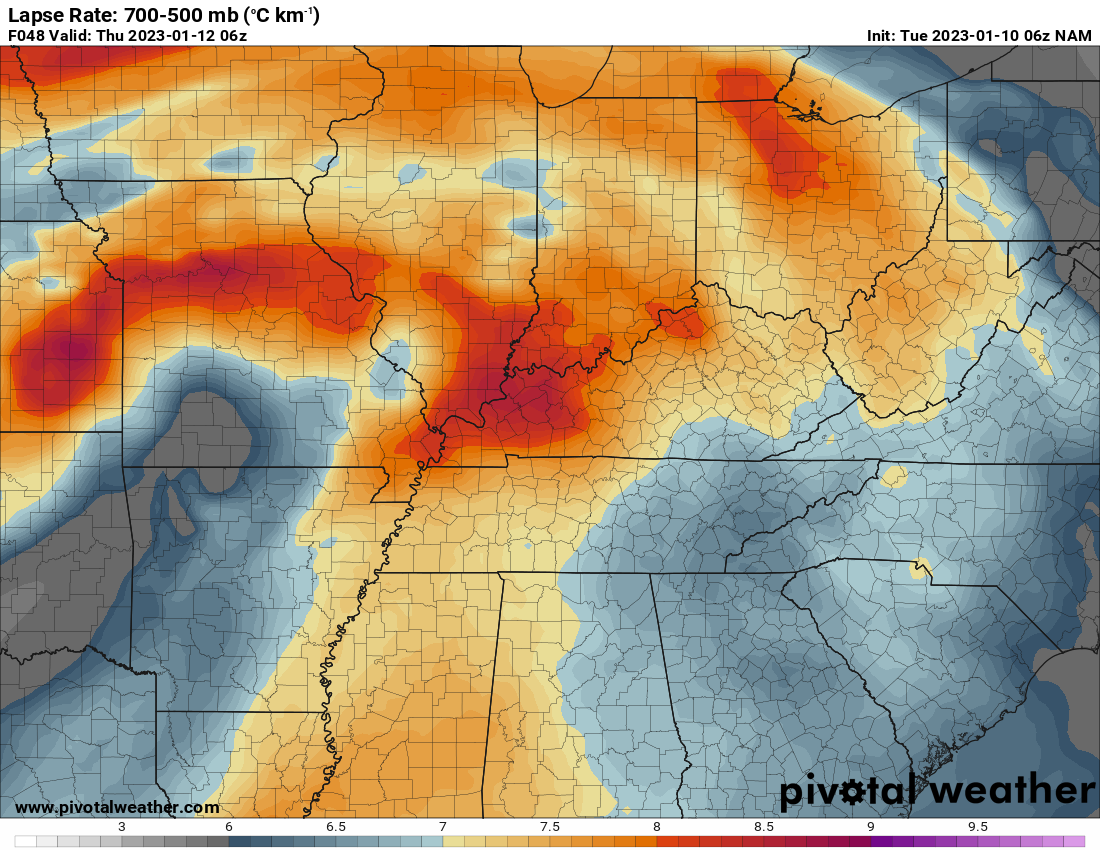
Lapse rates will be high late Wednesday night into Thursday morning. What are lapse rates. Click here.
The lapse rate is the change in temperature divided by the change in height. Lapse rates are important to weather forecasting since they help assess the (in)stability of layers in the troposphere. A higher number of lapse rate indicates a greater cooling with height. The typical situation is to have a lapse rate in which the temperature is decreasing with height but the temperature can increase with height such as with the case of an inversion. An inversion lapse rate can be indicated with a negative sign or a qualifier saying the temperature is increasing with height. A temperature increase with height is a very stable lapse rate in that layer.
Those deep red colors are decent lapse rates. That is a signal for hail.
I had been saying the risk of severe weather appeared to be minimal, but the latest guidance indicates at least a hail threat. I usually don’t send out app messages for hail late at night, because there is nothing you can do.
The action would be t move your car into the gararge or carport. So, this is your heads up concerning the hail risk (I will send out an app message, as well). Just not late at night!
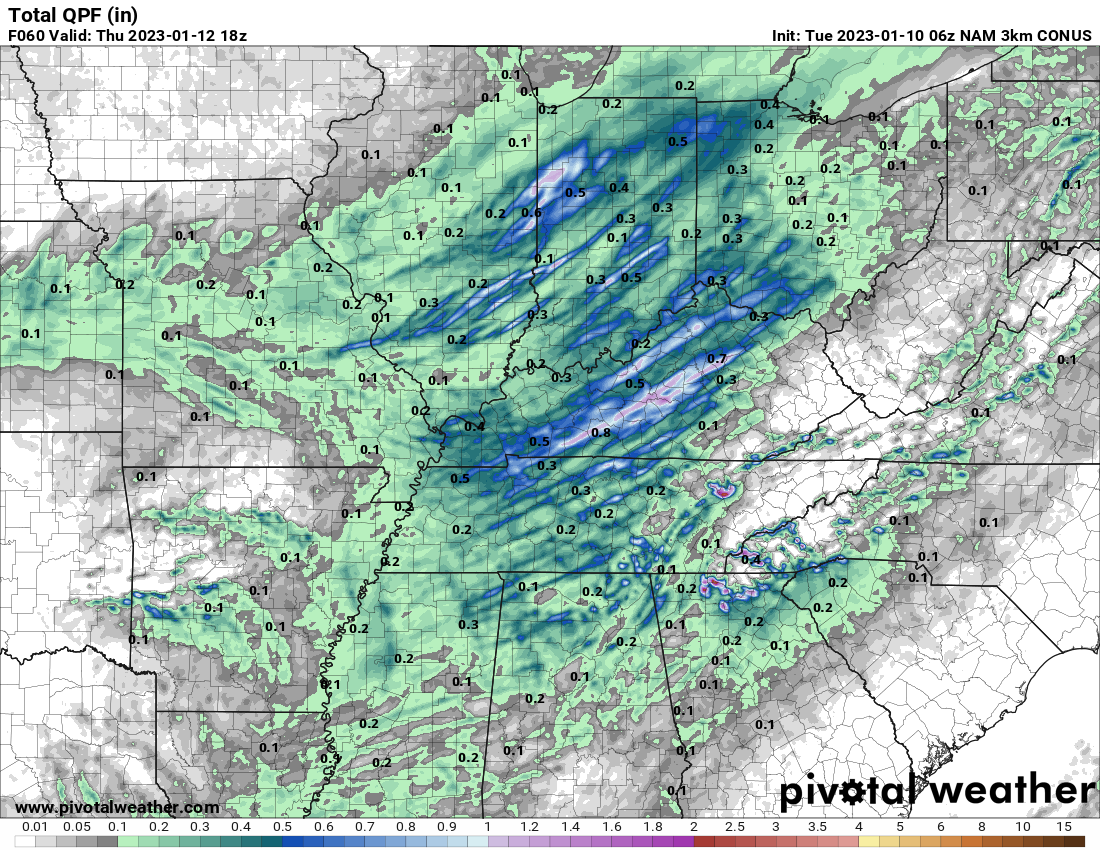
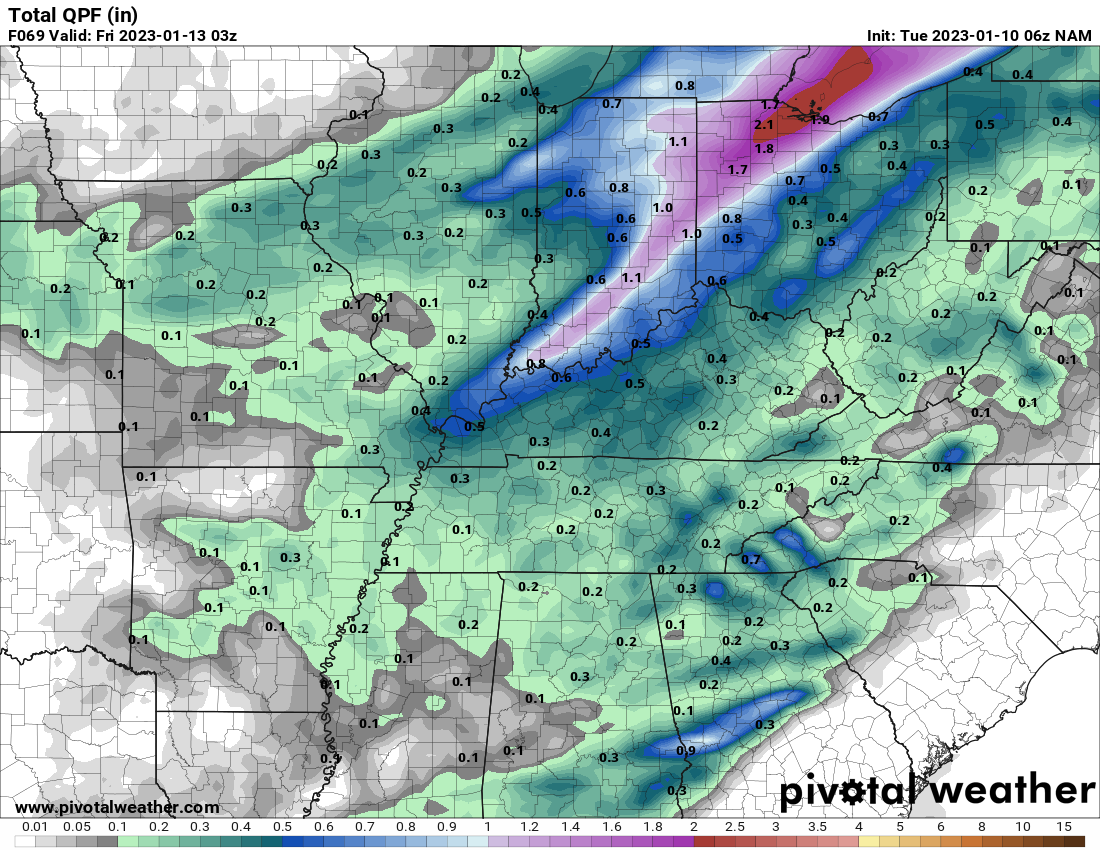
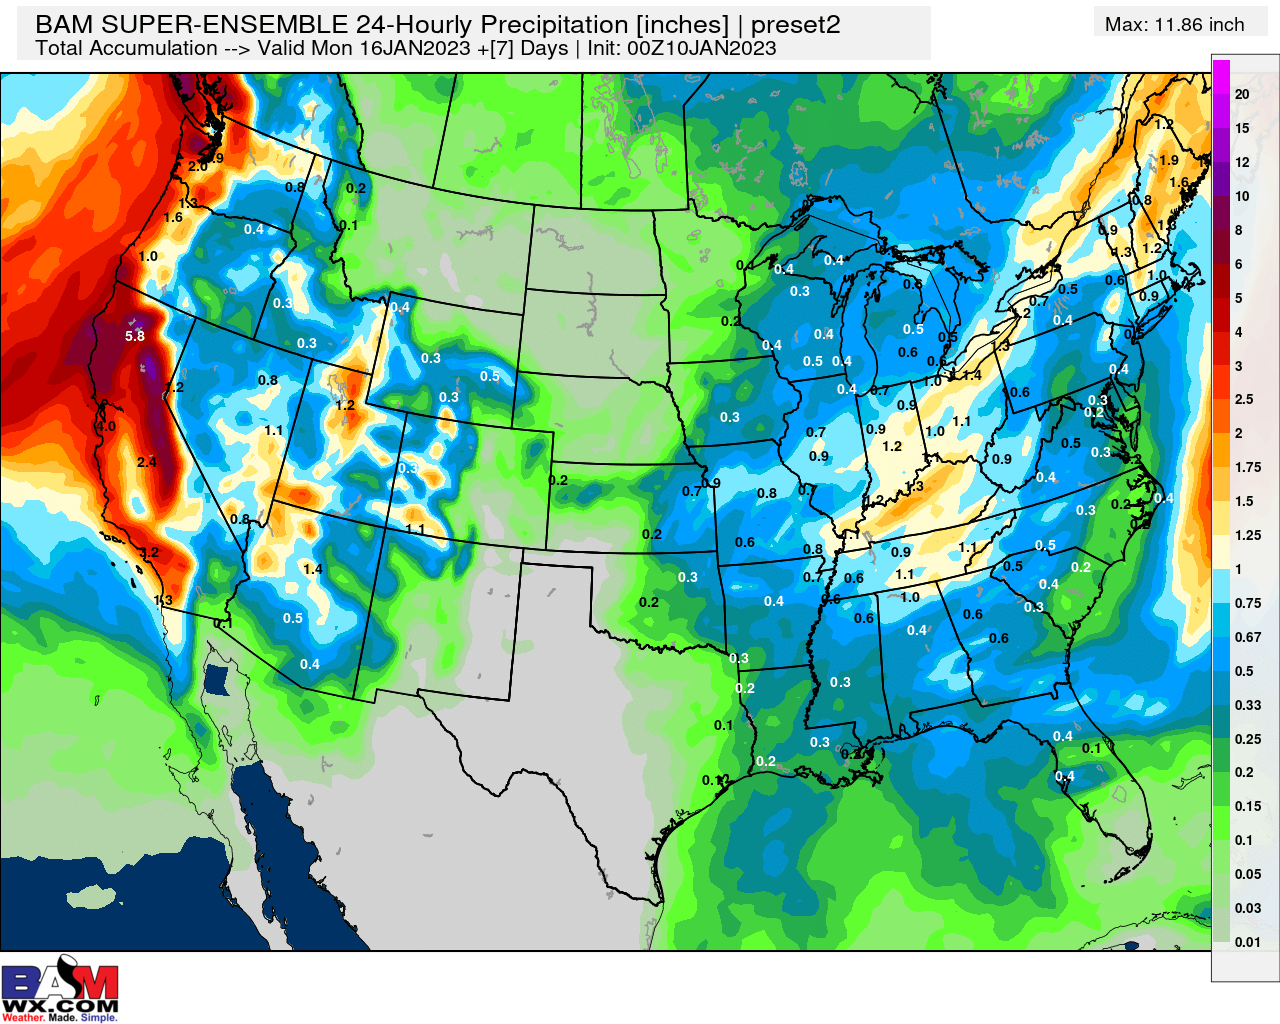
Rain totals from this system will likely remain around the 0.25″ to 0.50″ range with locally higher totals.
Here are a couple of model forecasts for rain totals.
Those streaks indicate where embedded thunderstorms develop. Random.
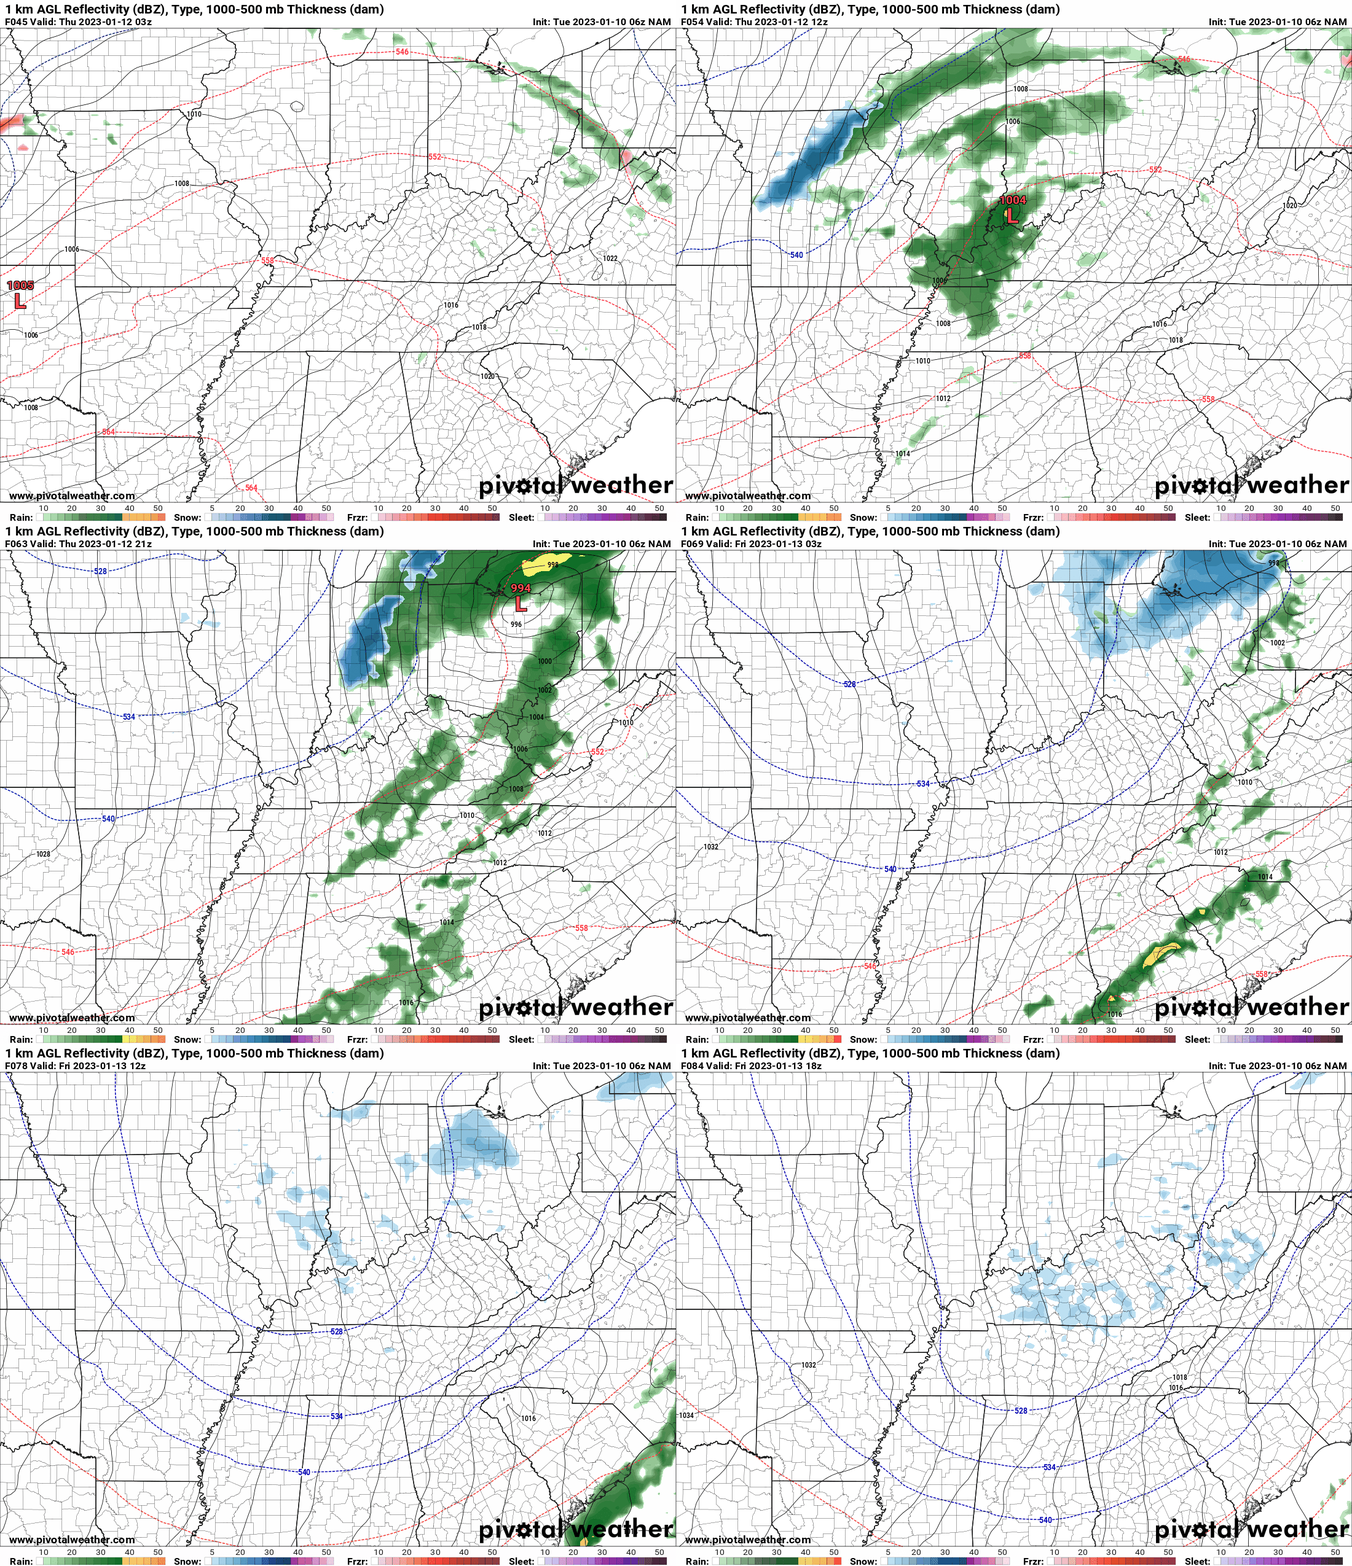
Thunderstorms will end Thursday morning as the cold front pushes away from the region.
Clouds will linger into Friday.
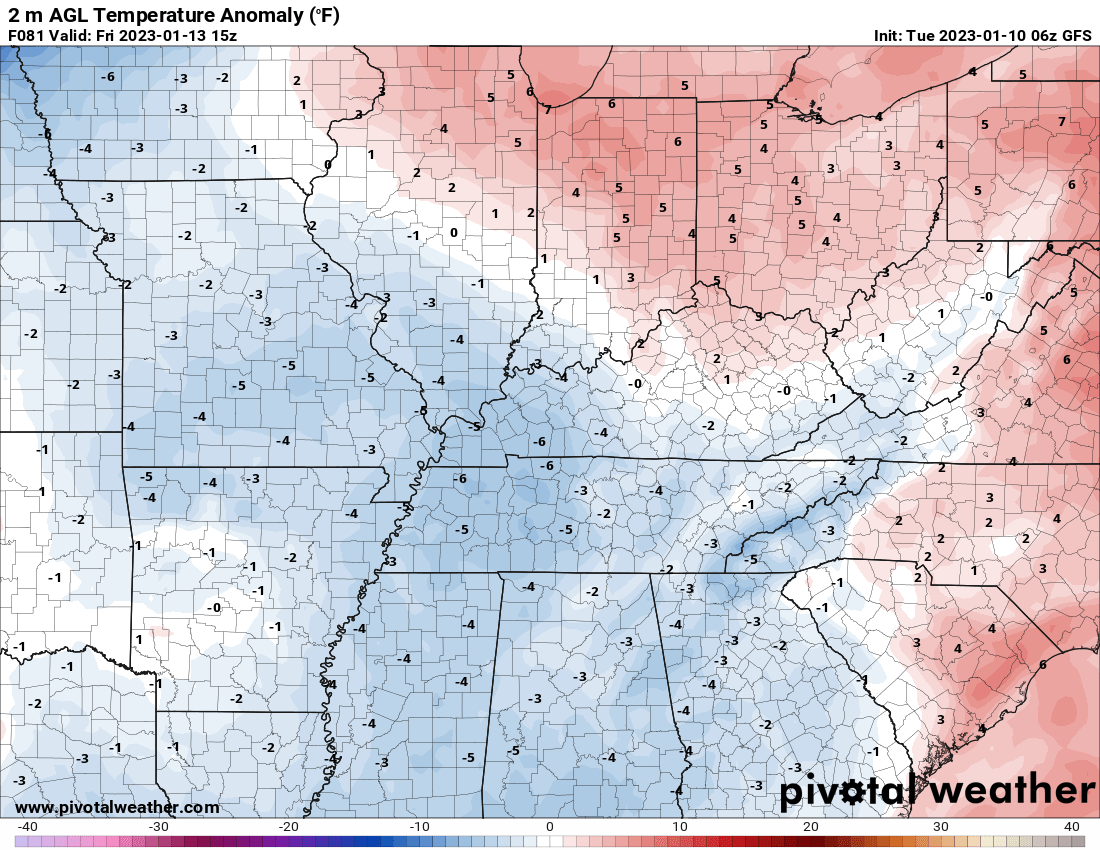
Much colder air will pour into the region behind the area of low pressure Thursday afternoon into Friday.
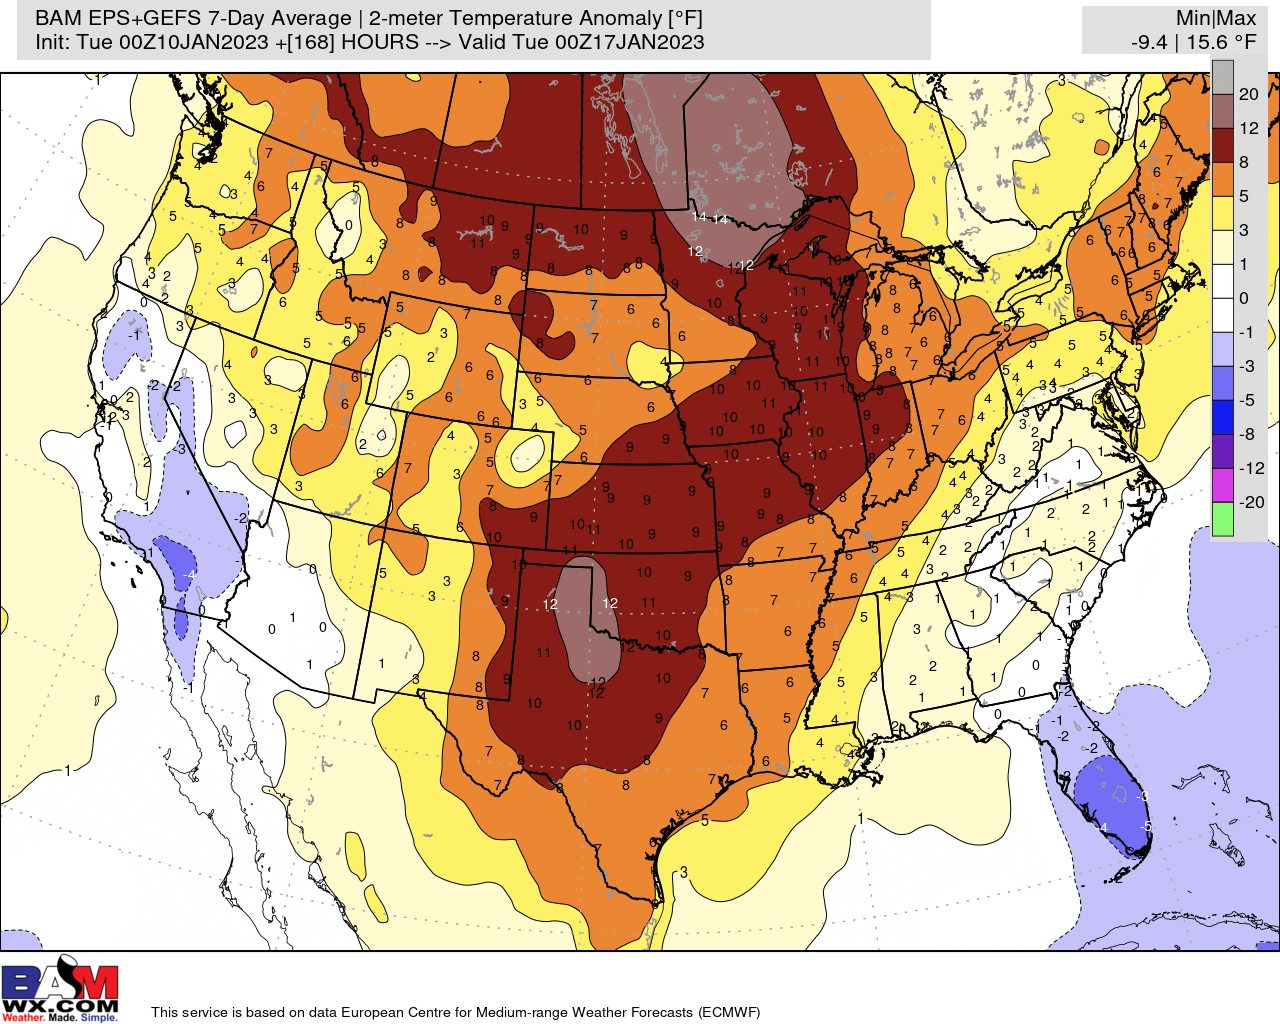
We will have below average temperatures Friday and perhaps even Saturday. Then, we pop above average again.
Average high temperatures for this time of the year are around 40 degrees. Average lows are around 30 degrees.
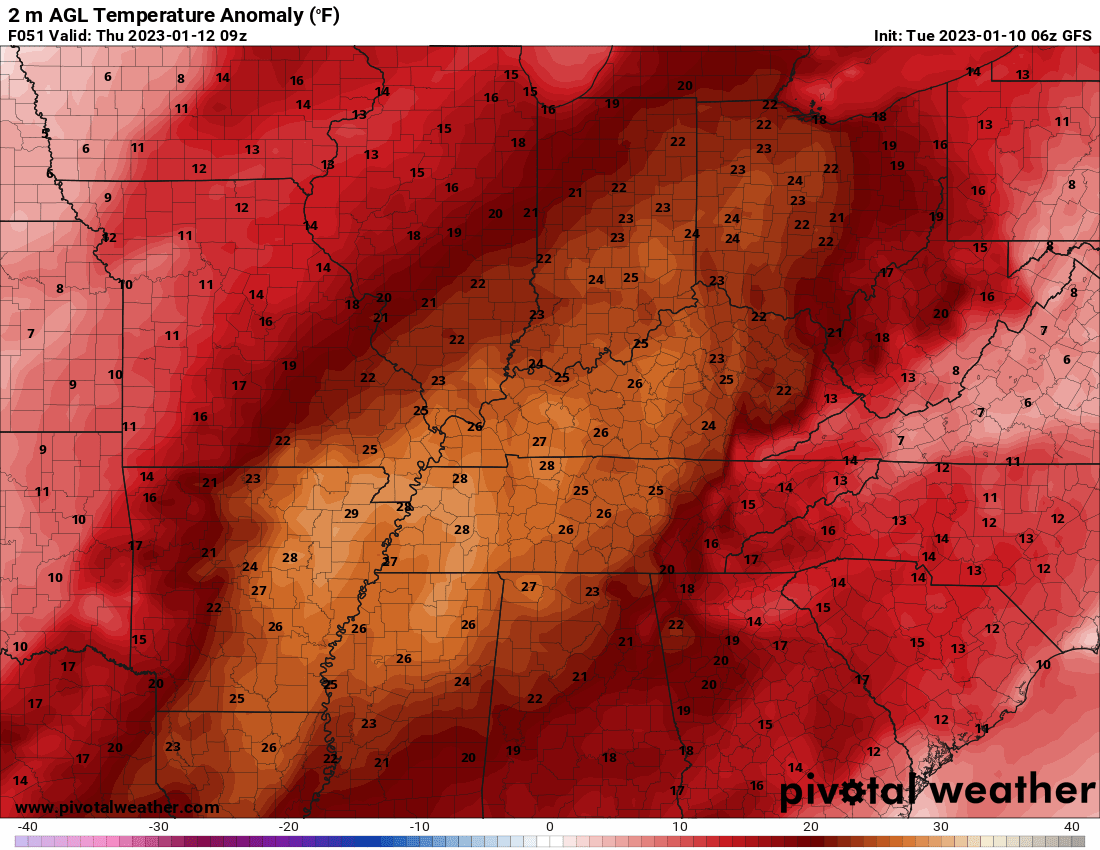
Check out this temperature anomaly map for early Thursday morning. Well above seasonal averages.
Then, watch what happens behind the cold front Friday. Below average temperatures. Briefly.
Another system will bring increasing chances of rain showers late Sunday night and especially Monday into Monday night. At this time, no severe eather is anticipated.
I am not tracking any extreme weather events, at this time, either. That is the good news.
I do suspect winter weather returns in February. Not saying it can’t snow in January, but I think our odds are better in February. Snow and ice. We shall see.
.

Click here if you would like to return to the top of the page.
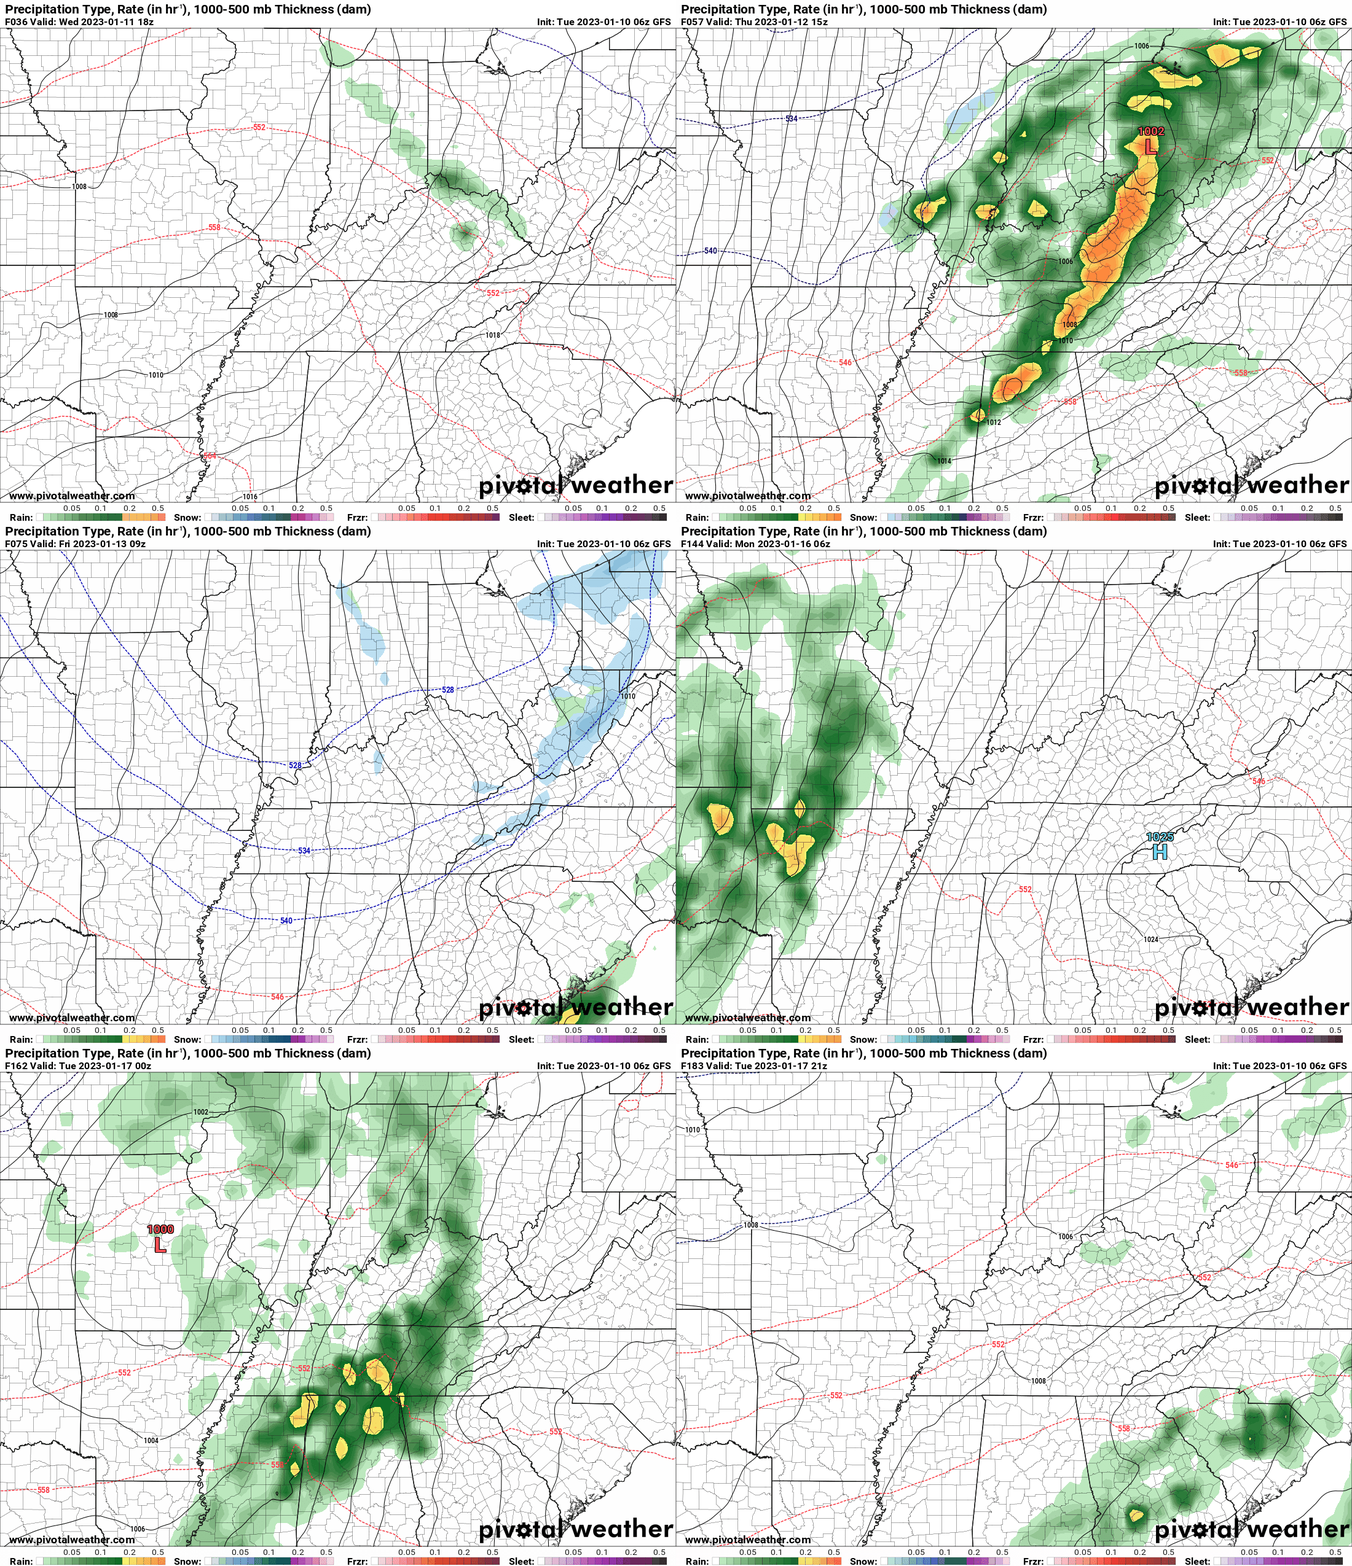
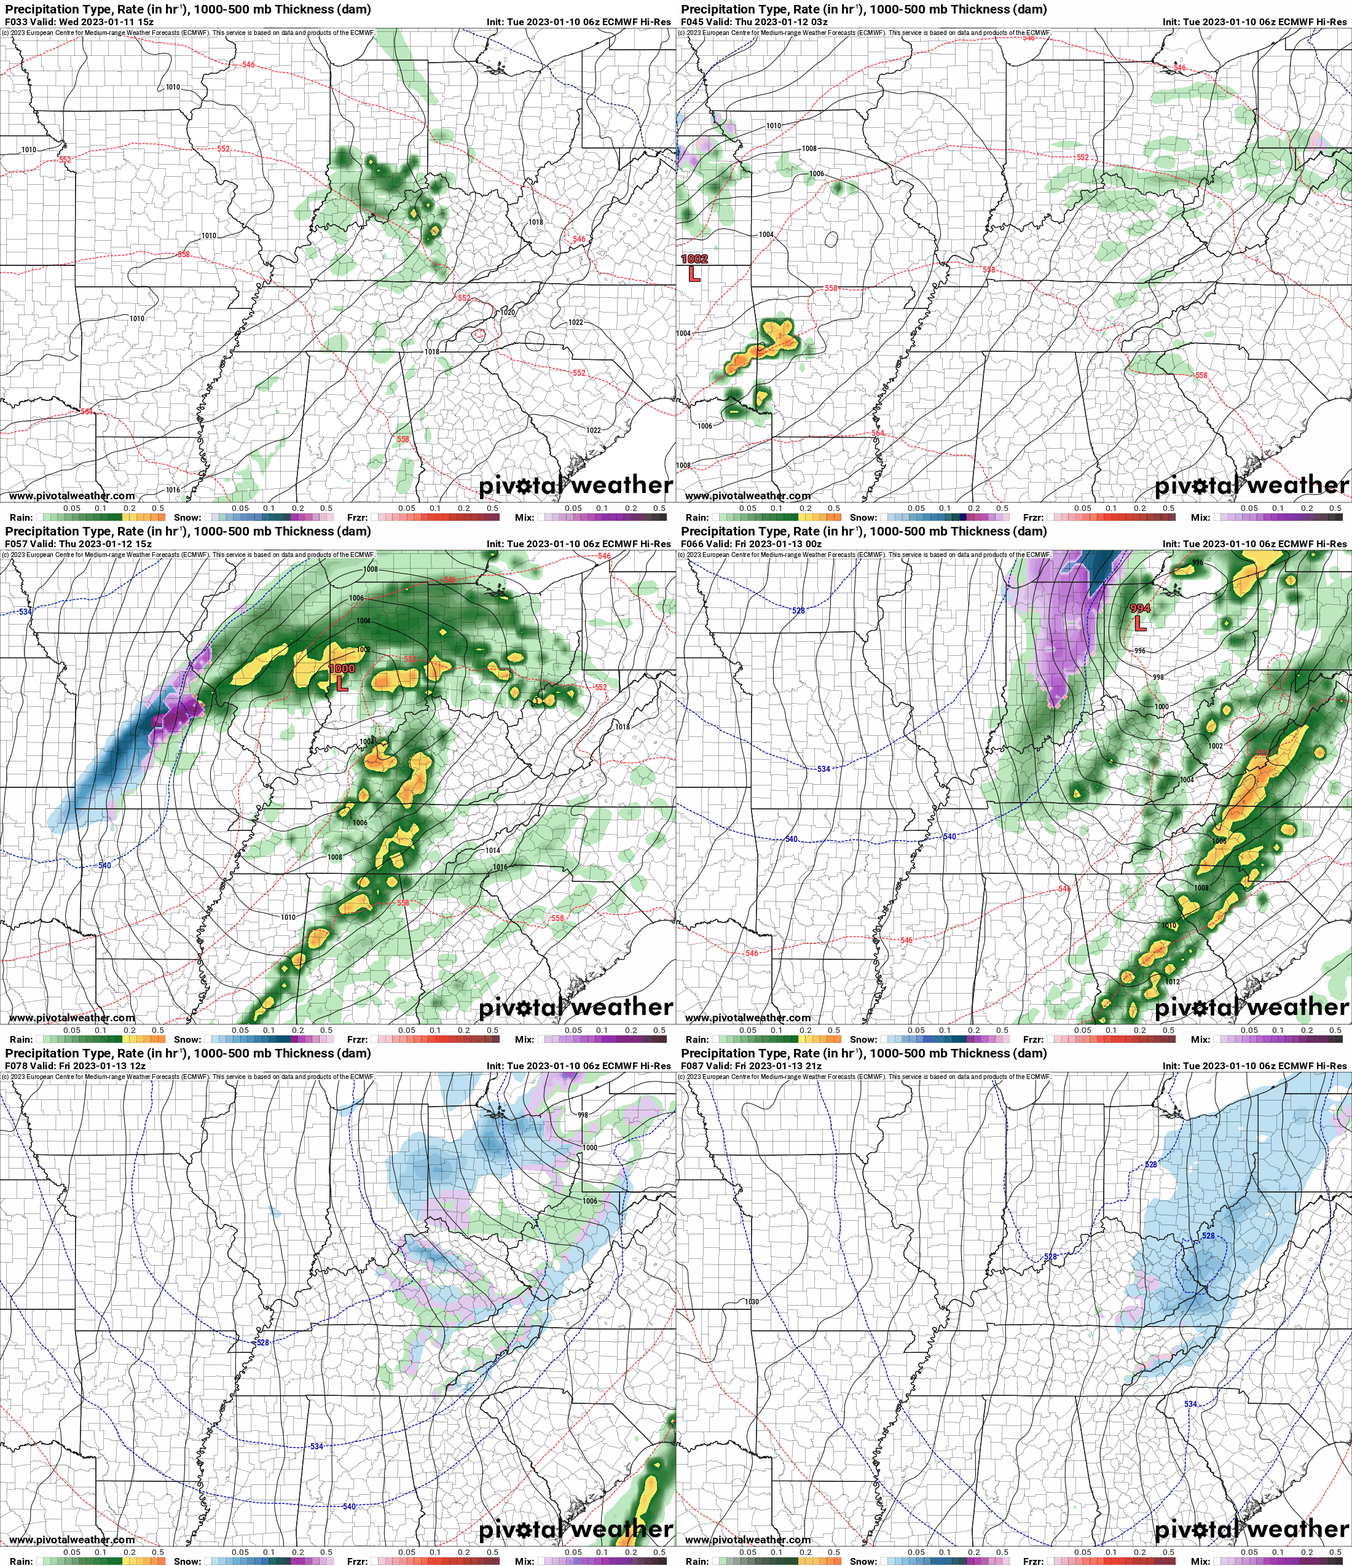
Again, as a reminder, these are models. They are never 100% accurate. Take the general idea from them.
What should I take from these?
- The general idea and not specifics. Models usually do well with the generalities.
- The time-stamp is located in the upper left corner.
.
What am I looking at?
You are looking at different models. Meteorologists use many different models to forecast the weather. All models are wrong. Some are more wrong than others. Meteorologists have to make a forecast based on the guidance/models.
I show you these so you can see what the different models are showing as far as precipitation. If most of the models agree, then the confidence in the final weather forecast increases.
You can see my final forecast at the top of the page.
Occasionally, these maps are in Zulu time. 12z=7 AM. 18z=1 PM. 00z=7 PM. 06z=1 AM
Green represents light rain. Dark green represents moderate rain. Yellow and orange represent heavy rain.
Red represents freezing rain. Purple represents sleet. Blue represents snow. Dark blue represents heavy snow.
.
This animation is the HRW FV3 high resolution model.
This animation shows you what radar might look like as the next system pulls through the region. It is a future-cast radar.
Occasionally, these maps are in Zulu time. 12z=7 AM. 18z=1 PM. 00z=7 PM. 06z=1 AM
Green represents light rain. Dark green represents moderate rain. Yellow and orange represent heavy rain.
Red represents freezing rain. Purple represents sleet. Blue represents snow. Dark blue represents heavy snow.
Time-stamp upper left. Click the animation to enlarge it.
.
This animation is the Storm Prediction Center WRF model.
This animation shows you what radar might look like as the next system pulls through the region. It is a future-cast radar.
Time-stamp upper left. Click the animation to enlarge it.
Occasionally, these maps are in Zulu time. 12z=7 AM. 18z=1 PM. 00z=7 PM. 06z=1 AM
Green represents light rain. Dark green represents moderate rain. Yellow and orange represent heavy rain.
Red represents freezing rain. Purple represents sleet. Blue represents snow. Dark blue represents heavy snow.
Time-stamp upper left. Click the animation to enlarge it.
.
This animation is the Hrrr short-range model.
This animation shows you what radar might look like as the next system pulls through the region. It is a future-cast radar.
Occasionally, these maps are in Zulu time. 12z=7 AM. 18z=1 PM. 00z=7 PM. 06z=1 AM
Green represents light rain. Dark green represents moderate rain. Yellow and orange represent heavy rain.
Red represents freezing rain. Purple represents sleet. Blue represents snow. Dark blue represents heavy snow.
Time-stamp upper left. Click the animation to enlarge it.
Models are not picking up on much precipitation through Sunday night.
They show scattered sprinkles or flurries today into tomorrow.
You can barely see them on these graphics.
.
This animation is the higher resolution 3K NAM American Model.
Occasionally, these maps are in Zulu time. 12z=7 AM. 18z=1 PM. 00z=7 PM. 06z=1 AM
Green represents light rain. Dark green represents moderate rain. Yellow and orange represent heavy rain.
Red represents freezing rain. Purple represents sleet. Blue represents snow. Dark blue represents heavy snow.
Time-stamp upper left. Click the animation to enlarge it.
.
This next animation is the lower-resolution NAM American Model.
This animation shows you what radar might look like as the system pulls through the region. It is a future-cast radar.
Occasionally, these maps are in Zulu time. 12z=7 AM. 18z=1 PM. 00z=7 PM. 06z=1 AM
Green represents light rain. Dark green represents moderate rain. Yellow and orange represent heavy rain.
Red represents freezing rain. Purple represents sleet. Blue represents snow. Dark blue represents heavy snow.
Time-stamp upper left. Click the animation to enlarge it.
.
This next animation is the GFS American Model.
This animation shows you what radar might look like as the system pulls through the region. It is a future-cast radar.
Occasionally, these maps are in Zulu time. 12z=7 AM. 18z=1 PM. 00z=7 PM. 06z=1 AM
Green represents light rain. Dark green represents moderate rain. Yellow and orange represent heavy rain.
Red represents freezing rain. Purple represents sleet. Blue represents snow. Dark blue represents heavy snow.
Time-stamp upper left. Click the animation to enlarge it.
.
This next animation is the EC European Weather model.
This animation shows you what radar might look like as the system pulls through the region. It is a future-cast radar.
Occasionally, these maps are in Zulu time. 12z=7 AM. 18z=1 PM. 00z=7 PM. 06z=1 AM
Green represents light rain. Dark green represents moderate rain. Yellow and orange represent heavy rain.
Red represents freezing rain. Purple represents sleet. Blue represents snow. Dark blue represents heavy snow.
Time-stamp upper left. Click the animation to enlarge it.
.
This next animation is the Canadian Weather model.
This animation shows you what radar might look like as the system pulls through the region. It is a future-cast radar.
Occasionally, these maps are in Zulu time. 12z=7 AM. 18z=1 PM. 00z=7 PM. 06z=1 AM
Green represents light rain. Dark green represents moderate rain. Yellow and orange represent heavy rain.
Red represents freezing rain. Purple represents sleet. Blue represents snow. Dark blue represents heavy snow.
Time-stamp upper left. Click the animation to enlarge it.
.
.![]()
.
![]()
.

.
Click here if you would like to return to the top of the page.
.
Average high temperatures for this time of the year are around 42 degrees.
Average low temperatures for this time of the year are around 30 degrees.
Average precipitation during this time period ranges from 0.70″ to 1.00″
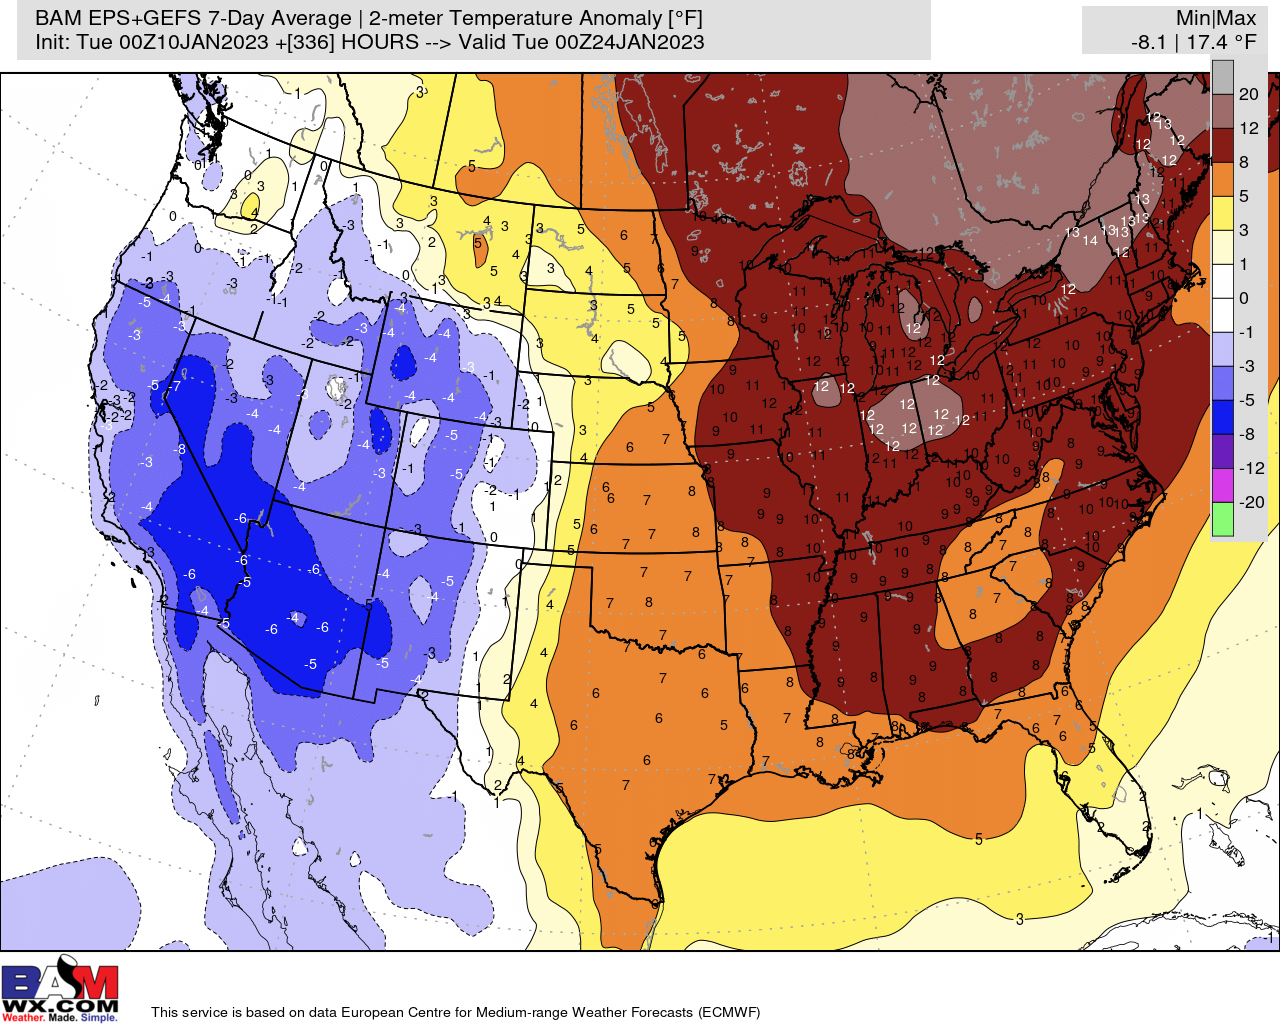
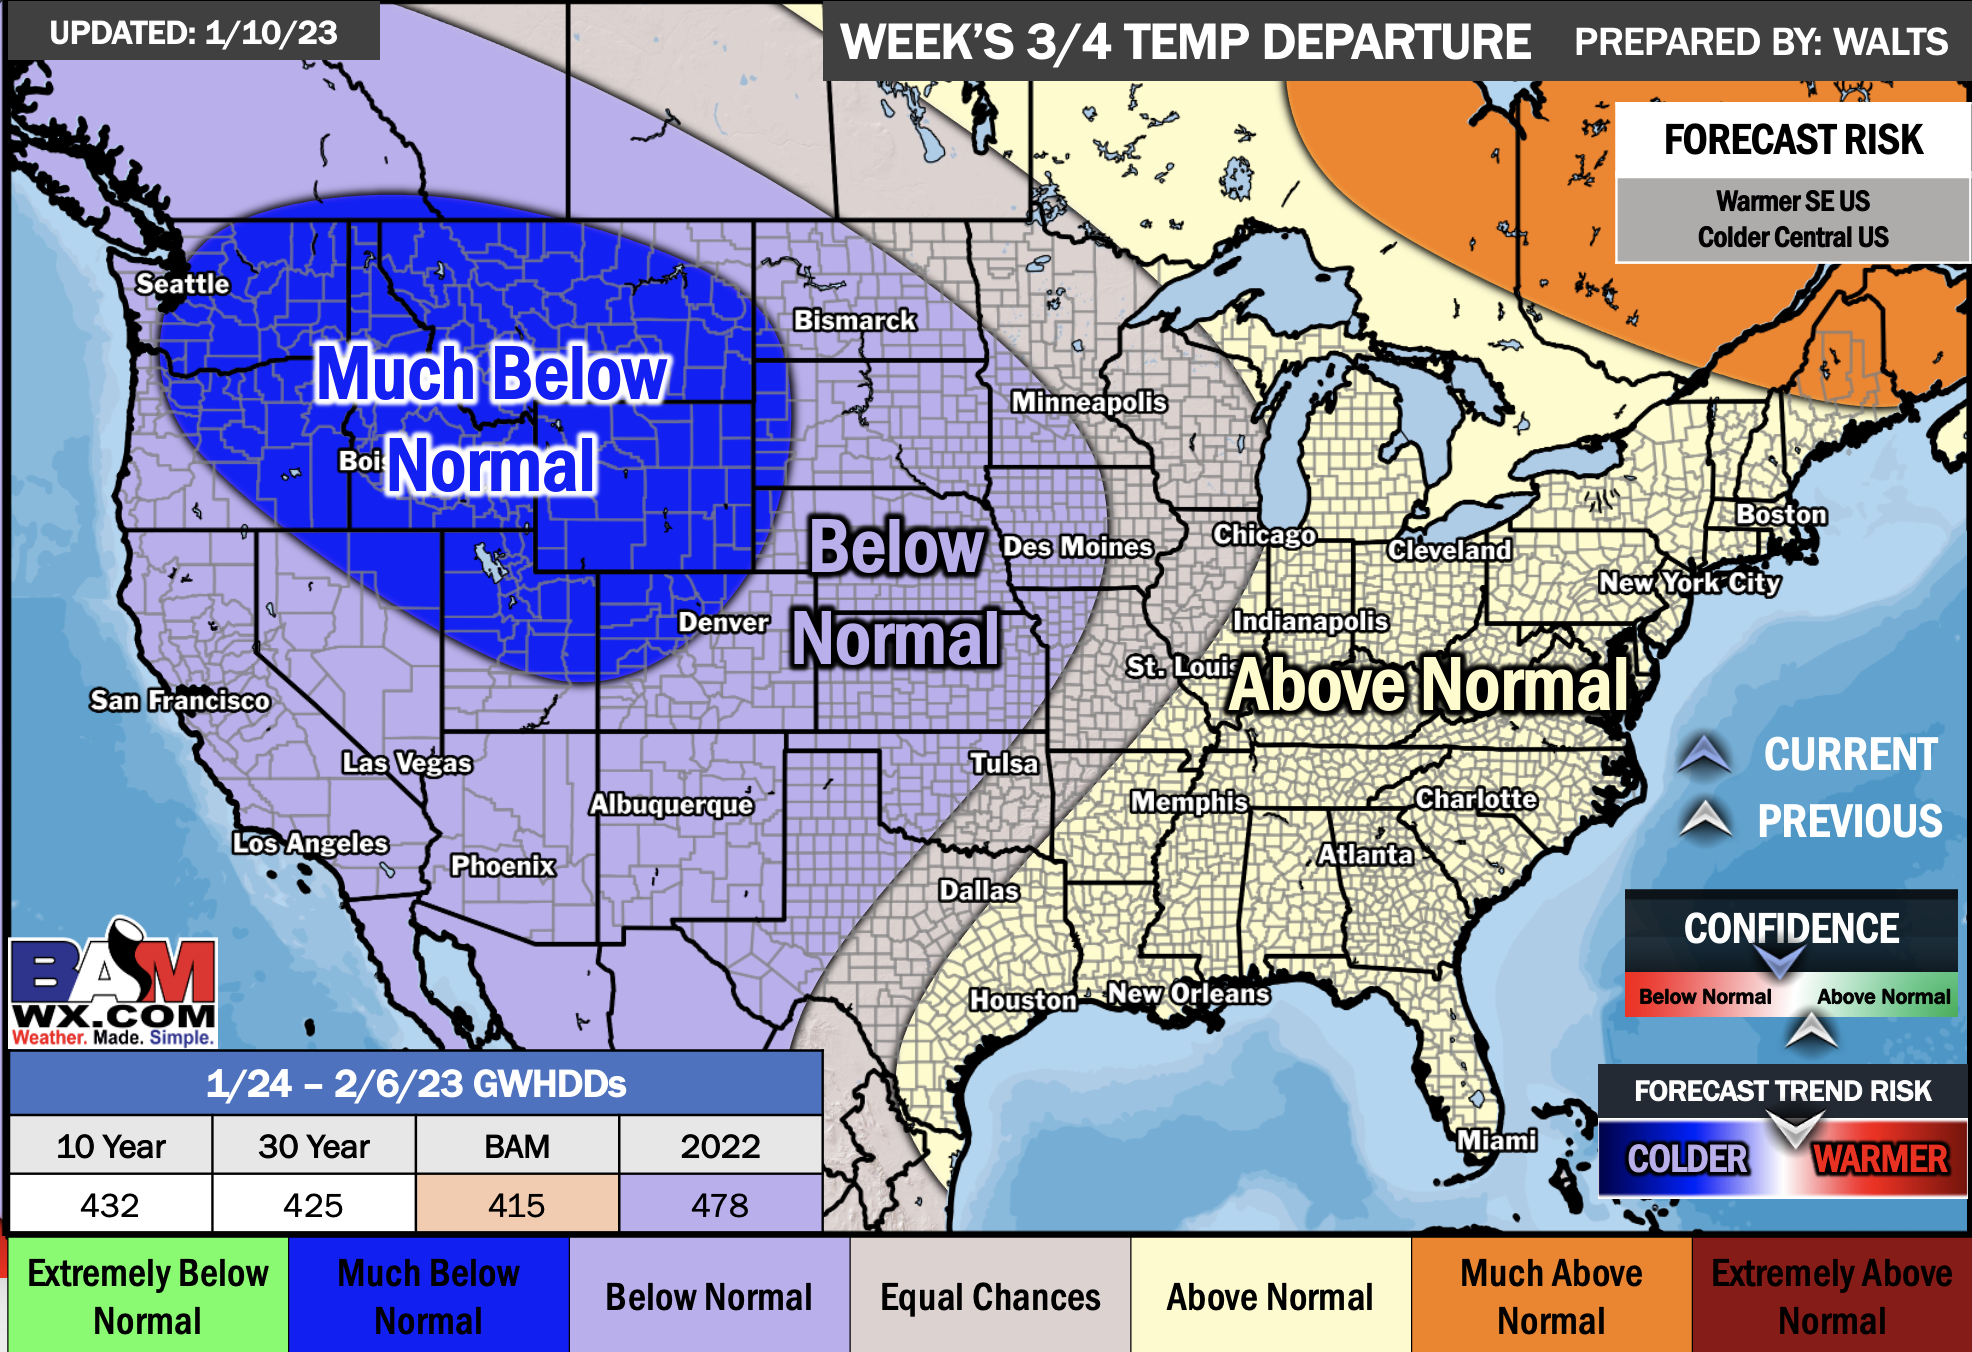
Yellow and orange colors are above average temperatures. Red is much above average. Light blue and blue are below-average temperatures. Green to purple colors represents much below-average temperatures.
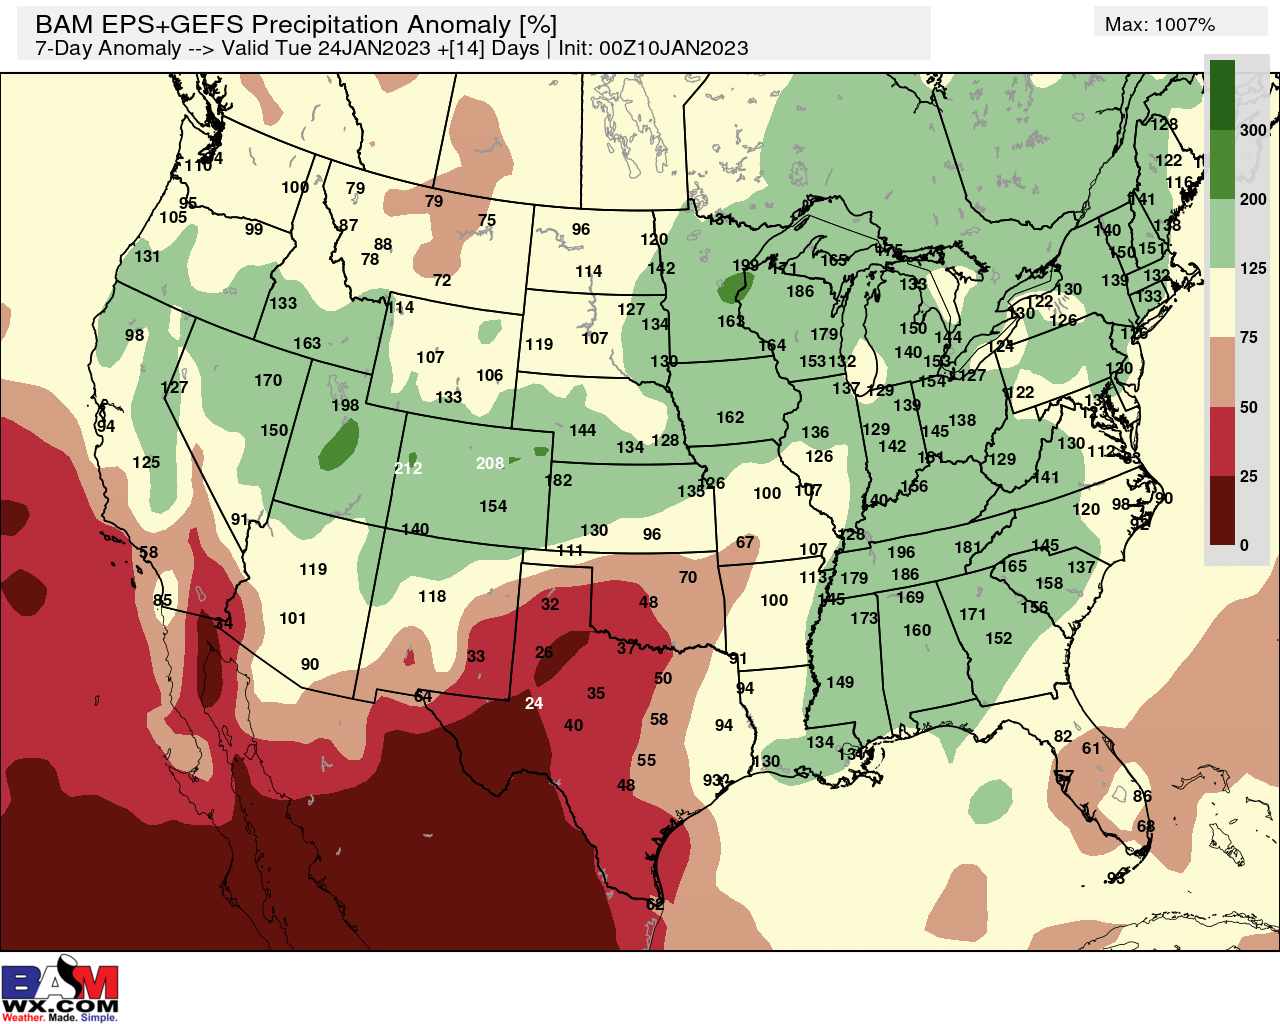
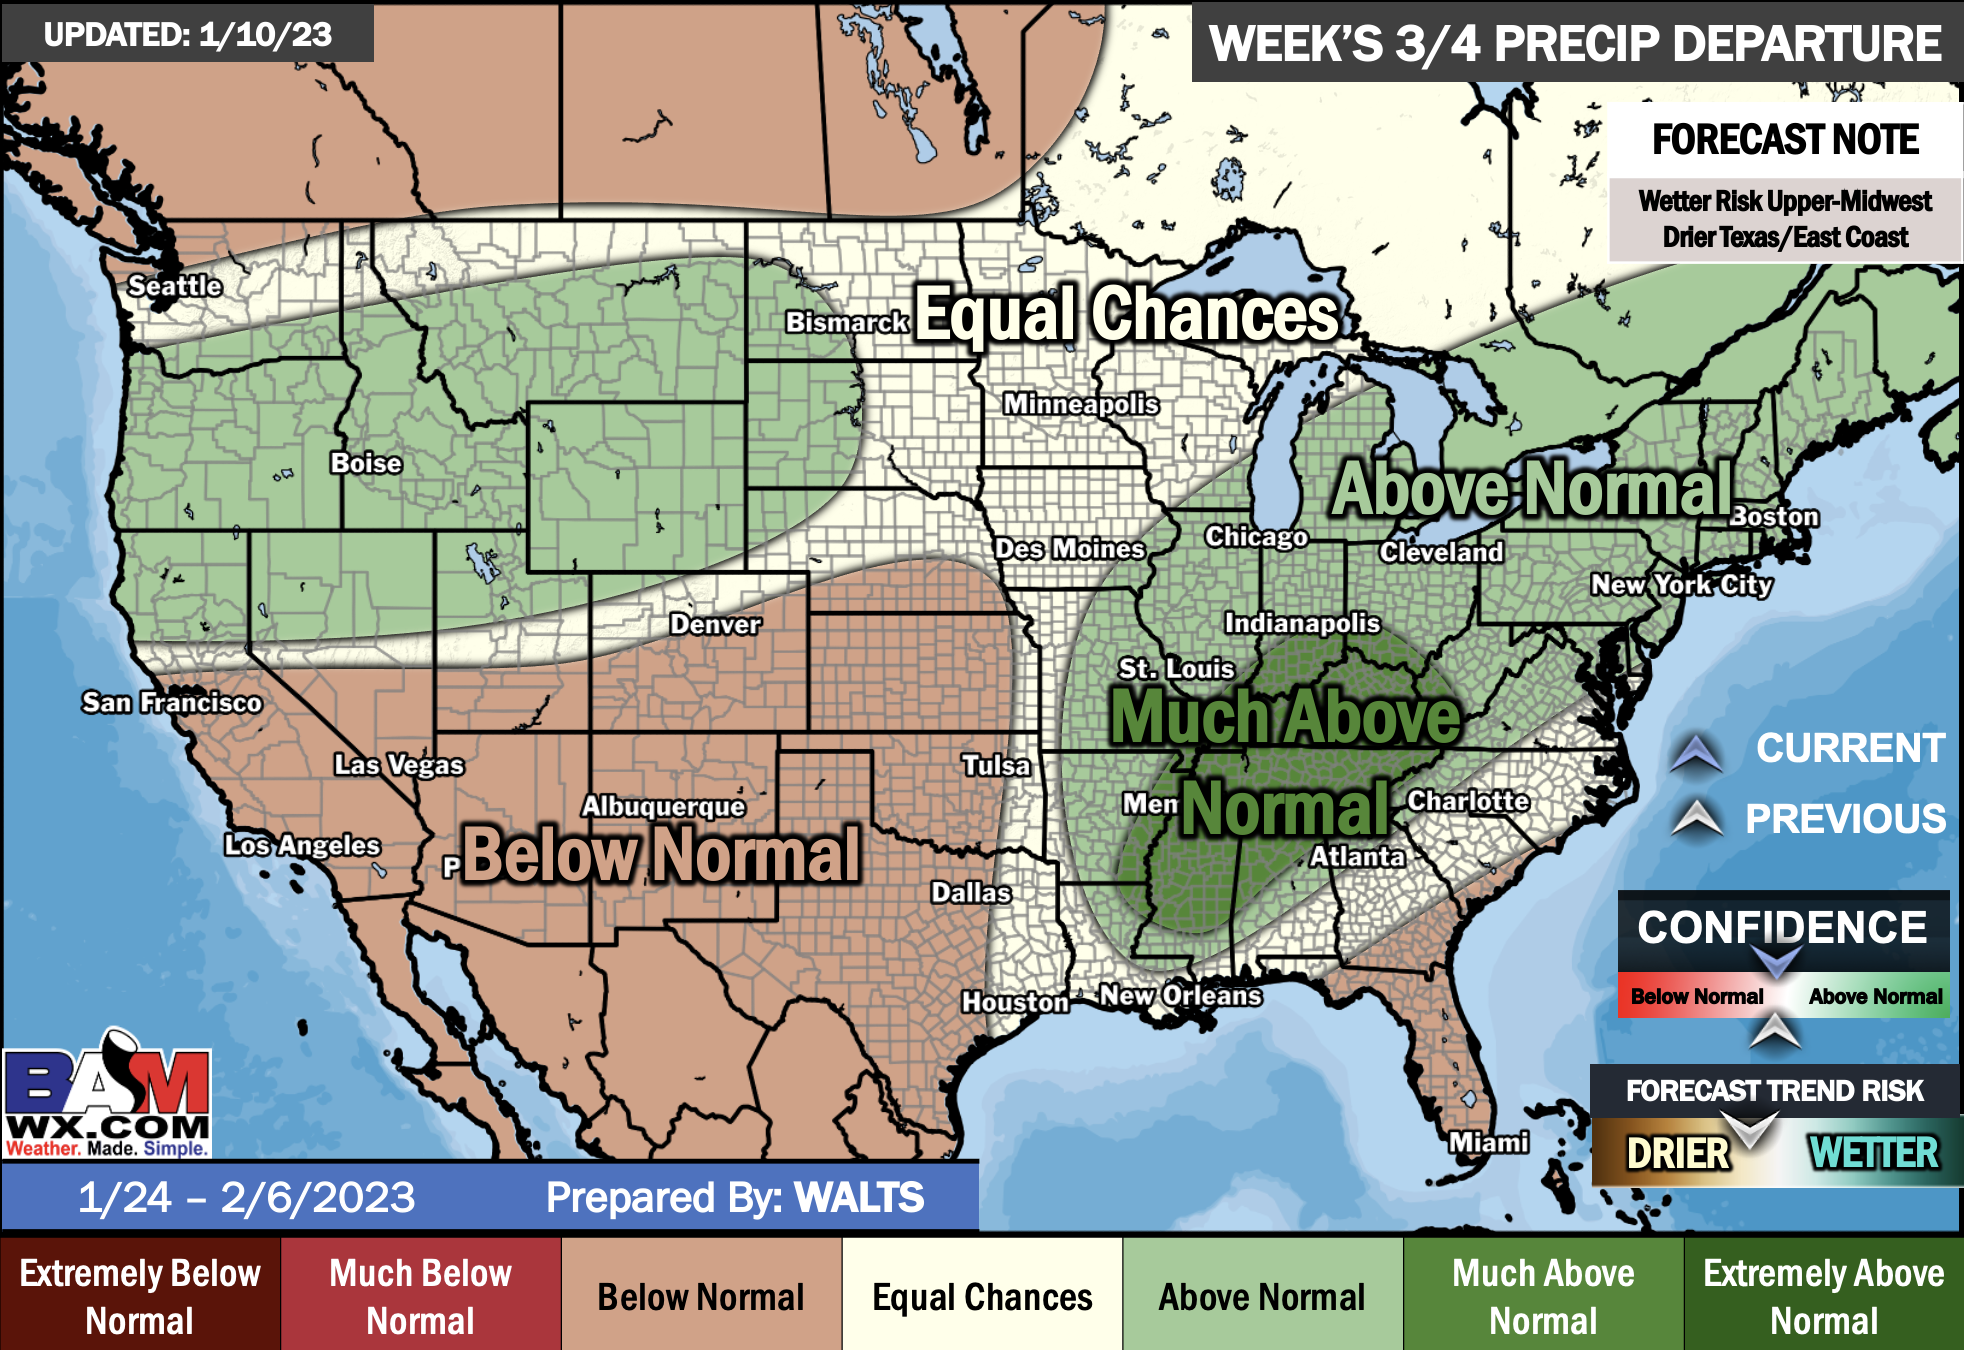
Click on the image to expand it.

Average low temperatures for this time of the year are around 29 degrees
Average precipitation during this time period ranges from 0.70″ to 1.00″
.
This outlook covers January 17th through January 23rd
Click on the image to expand it
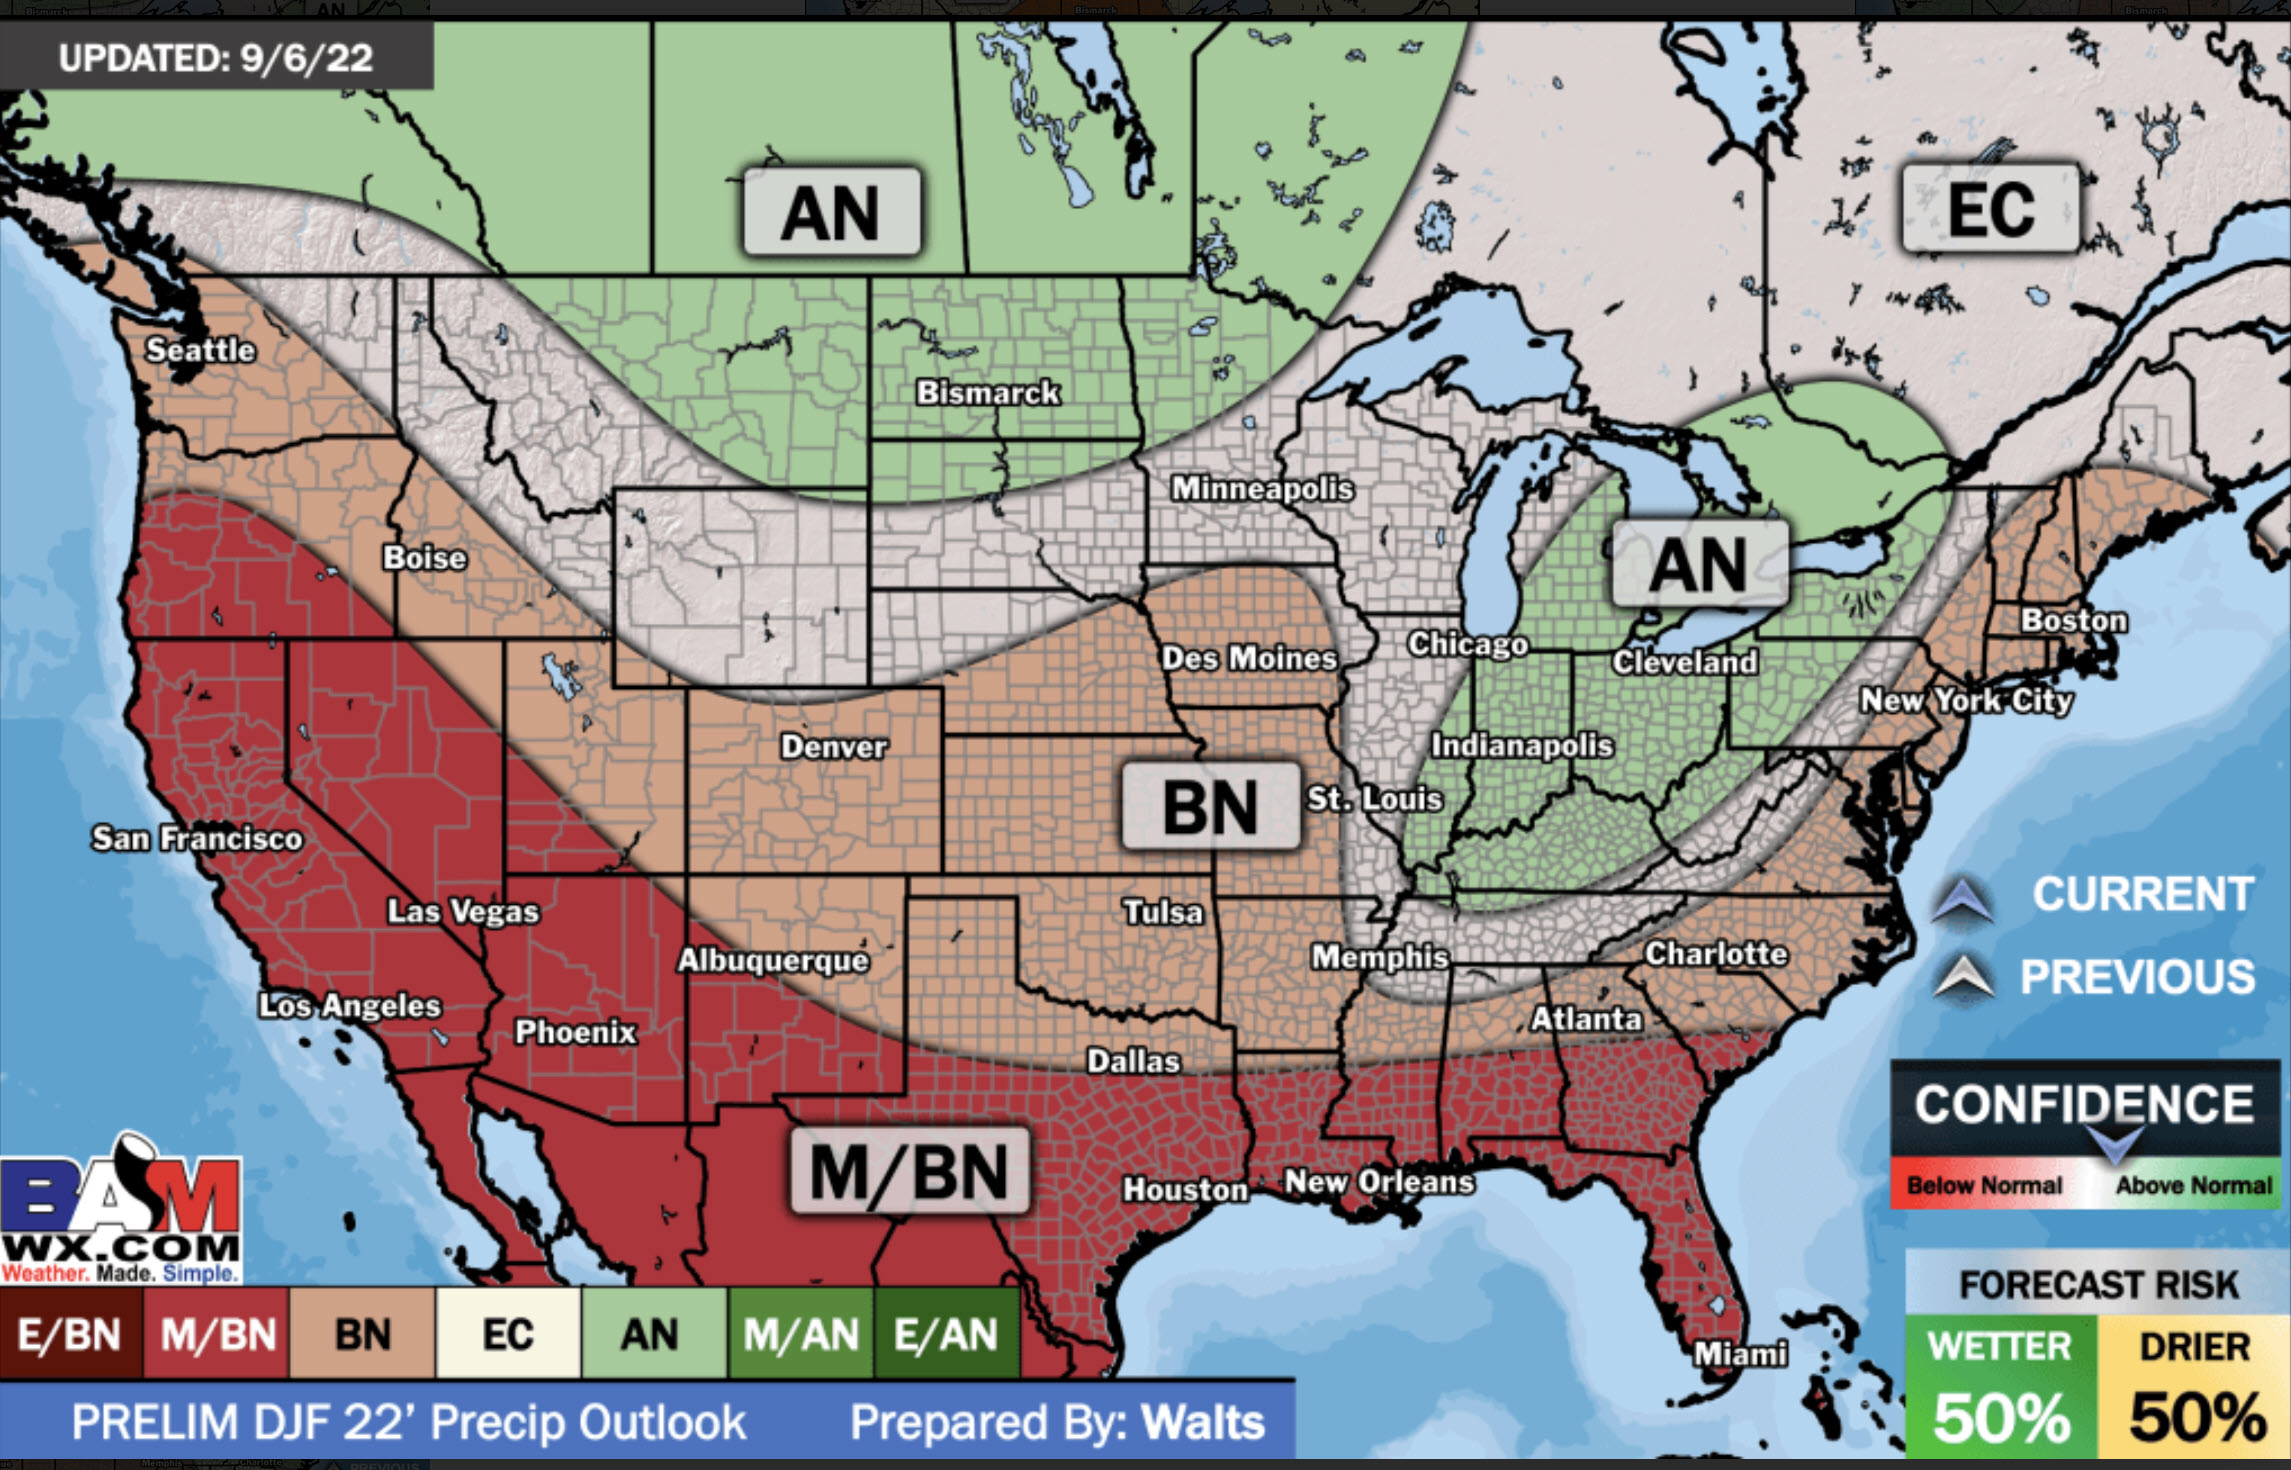
The precipitation forecast is PERCENT OF AVERAGE. Brown is below average. Green is above average. Blue is much above average.

EC = Equal chances of above or below average
BN= Below average
M/BN = Much below average
AN = Above average
M/AN = Much above average
E/AN = Extremely above average
Average low temperatures for this time of the year are around 25 degrees
Average precipitation during this time period ranges from 1.40″ to 2.00″
This outlook covers January 24th through February 8th
Monthly Outlooks
.
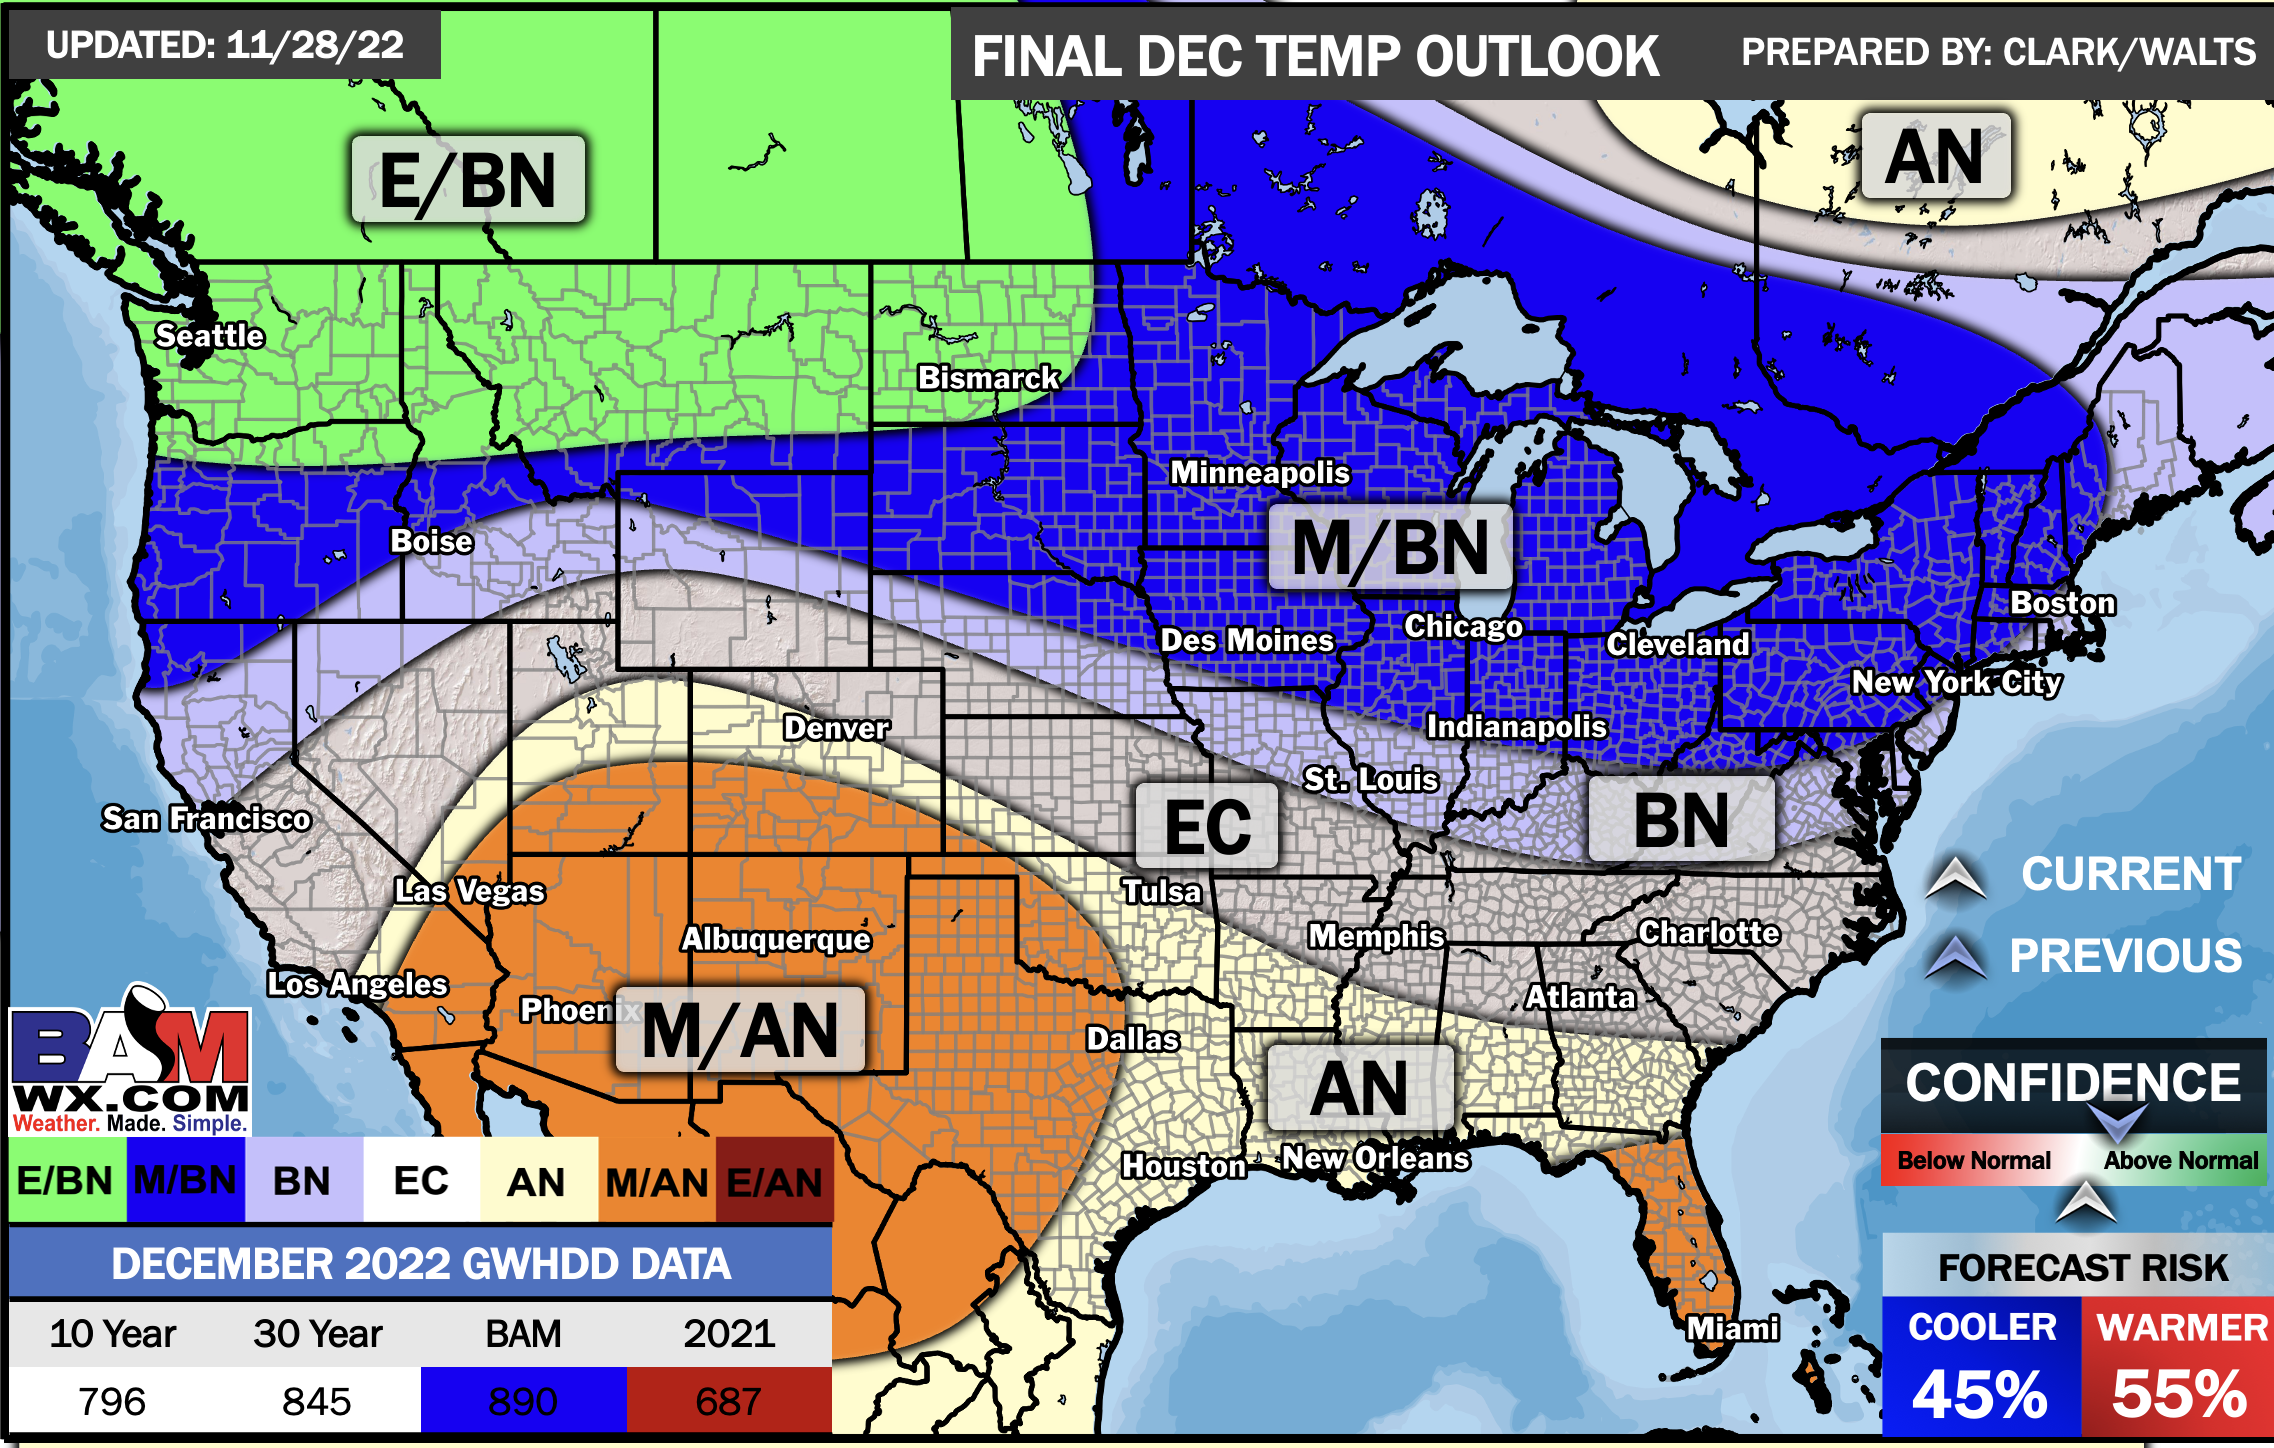
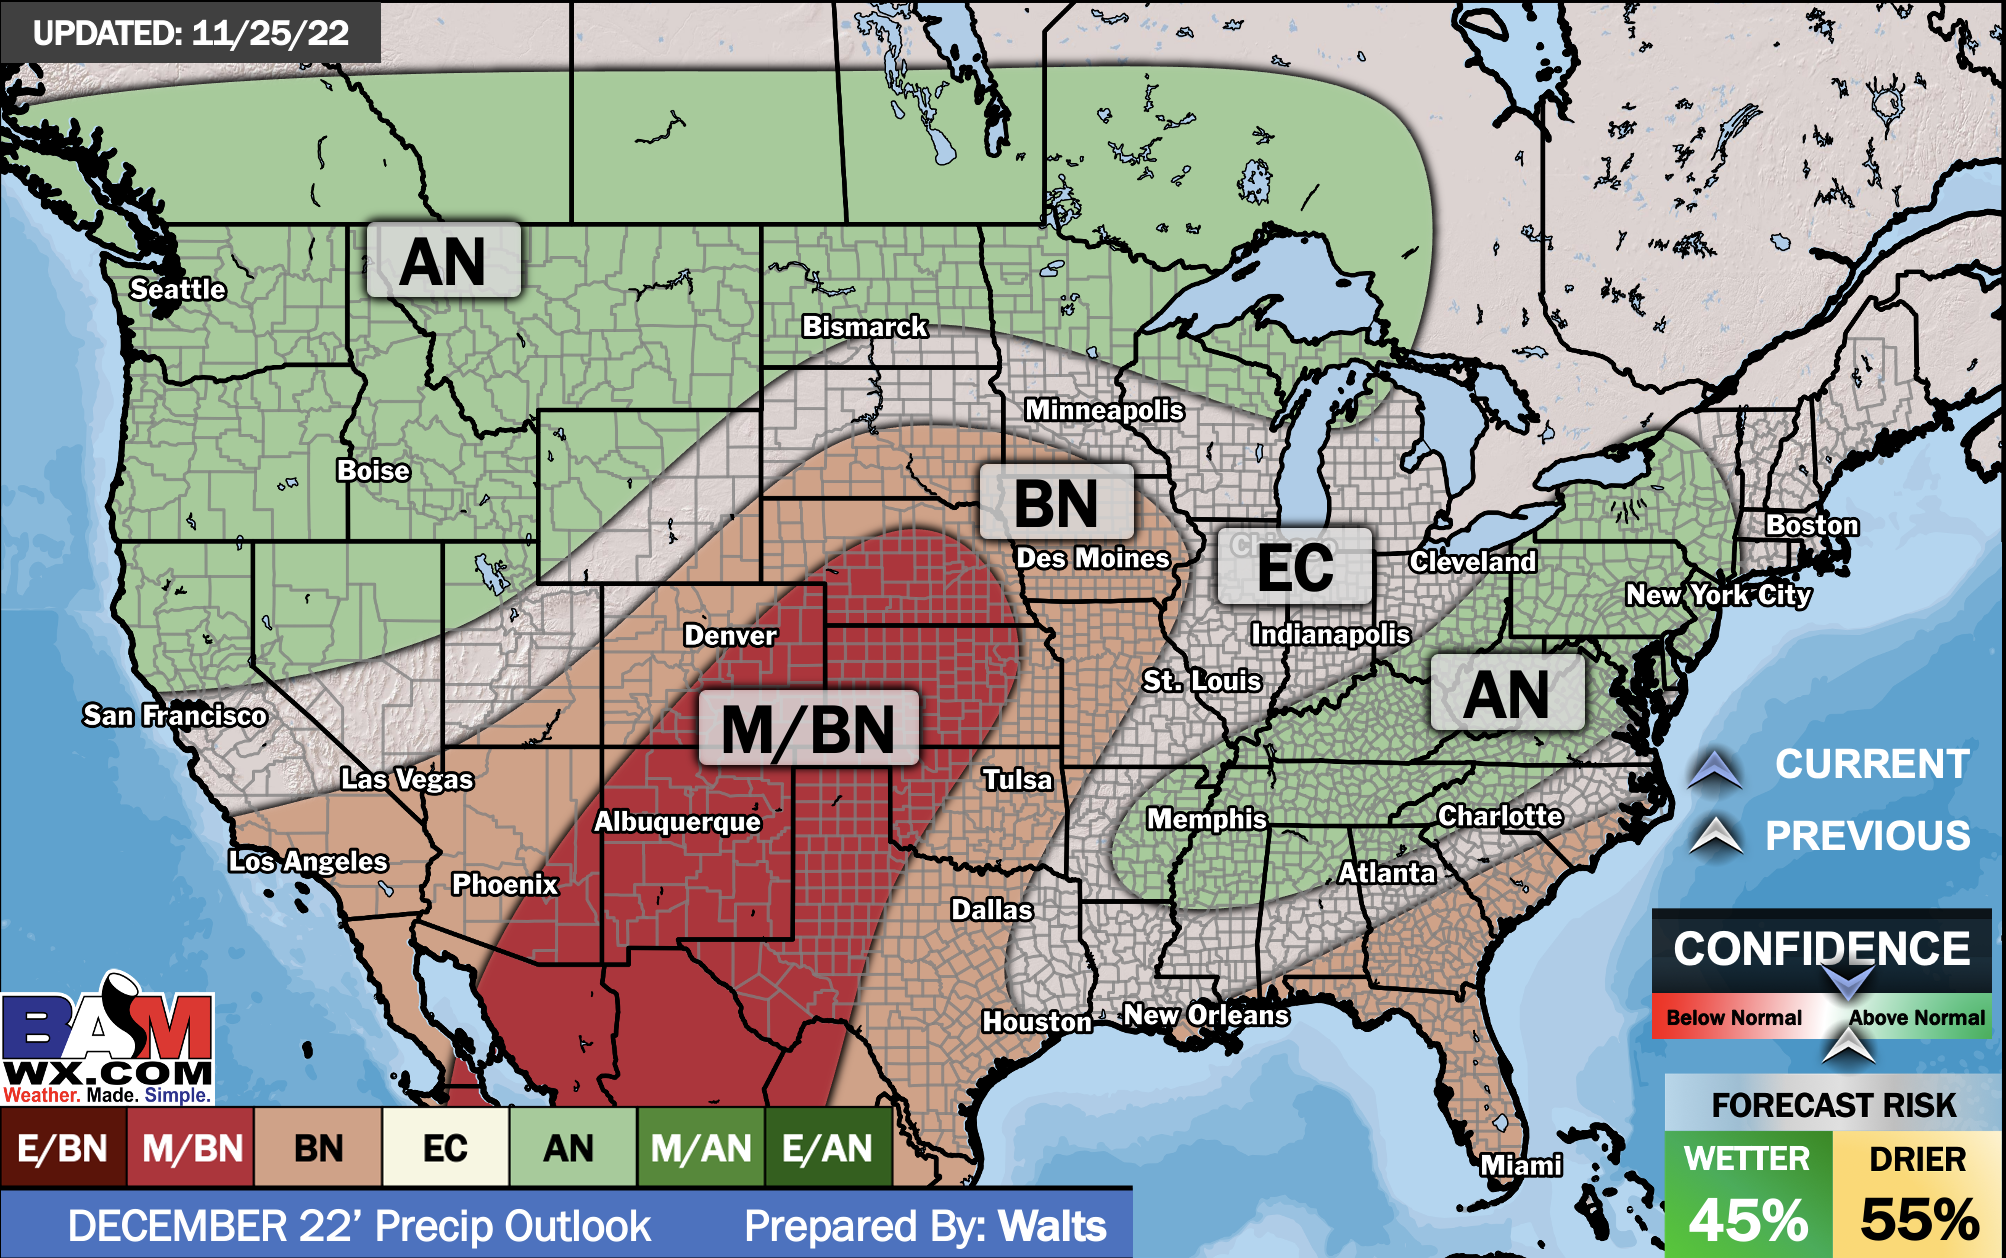
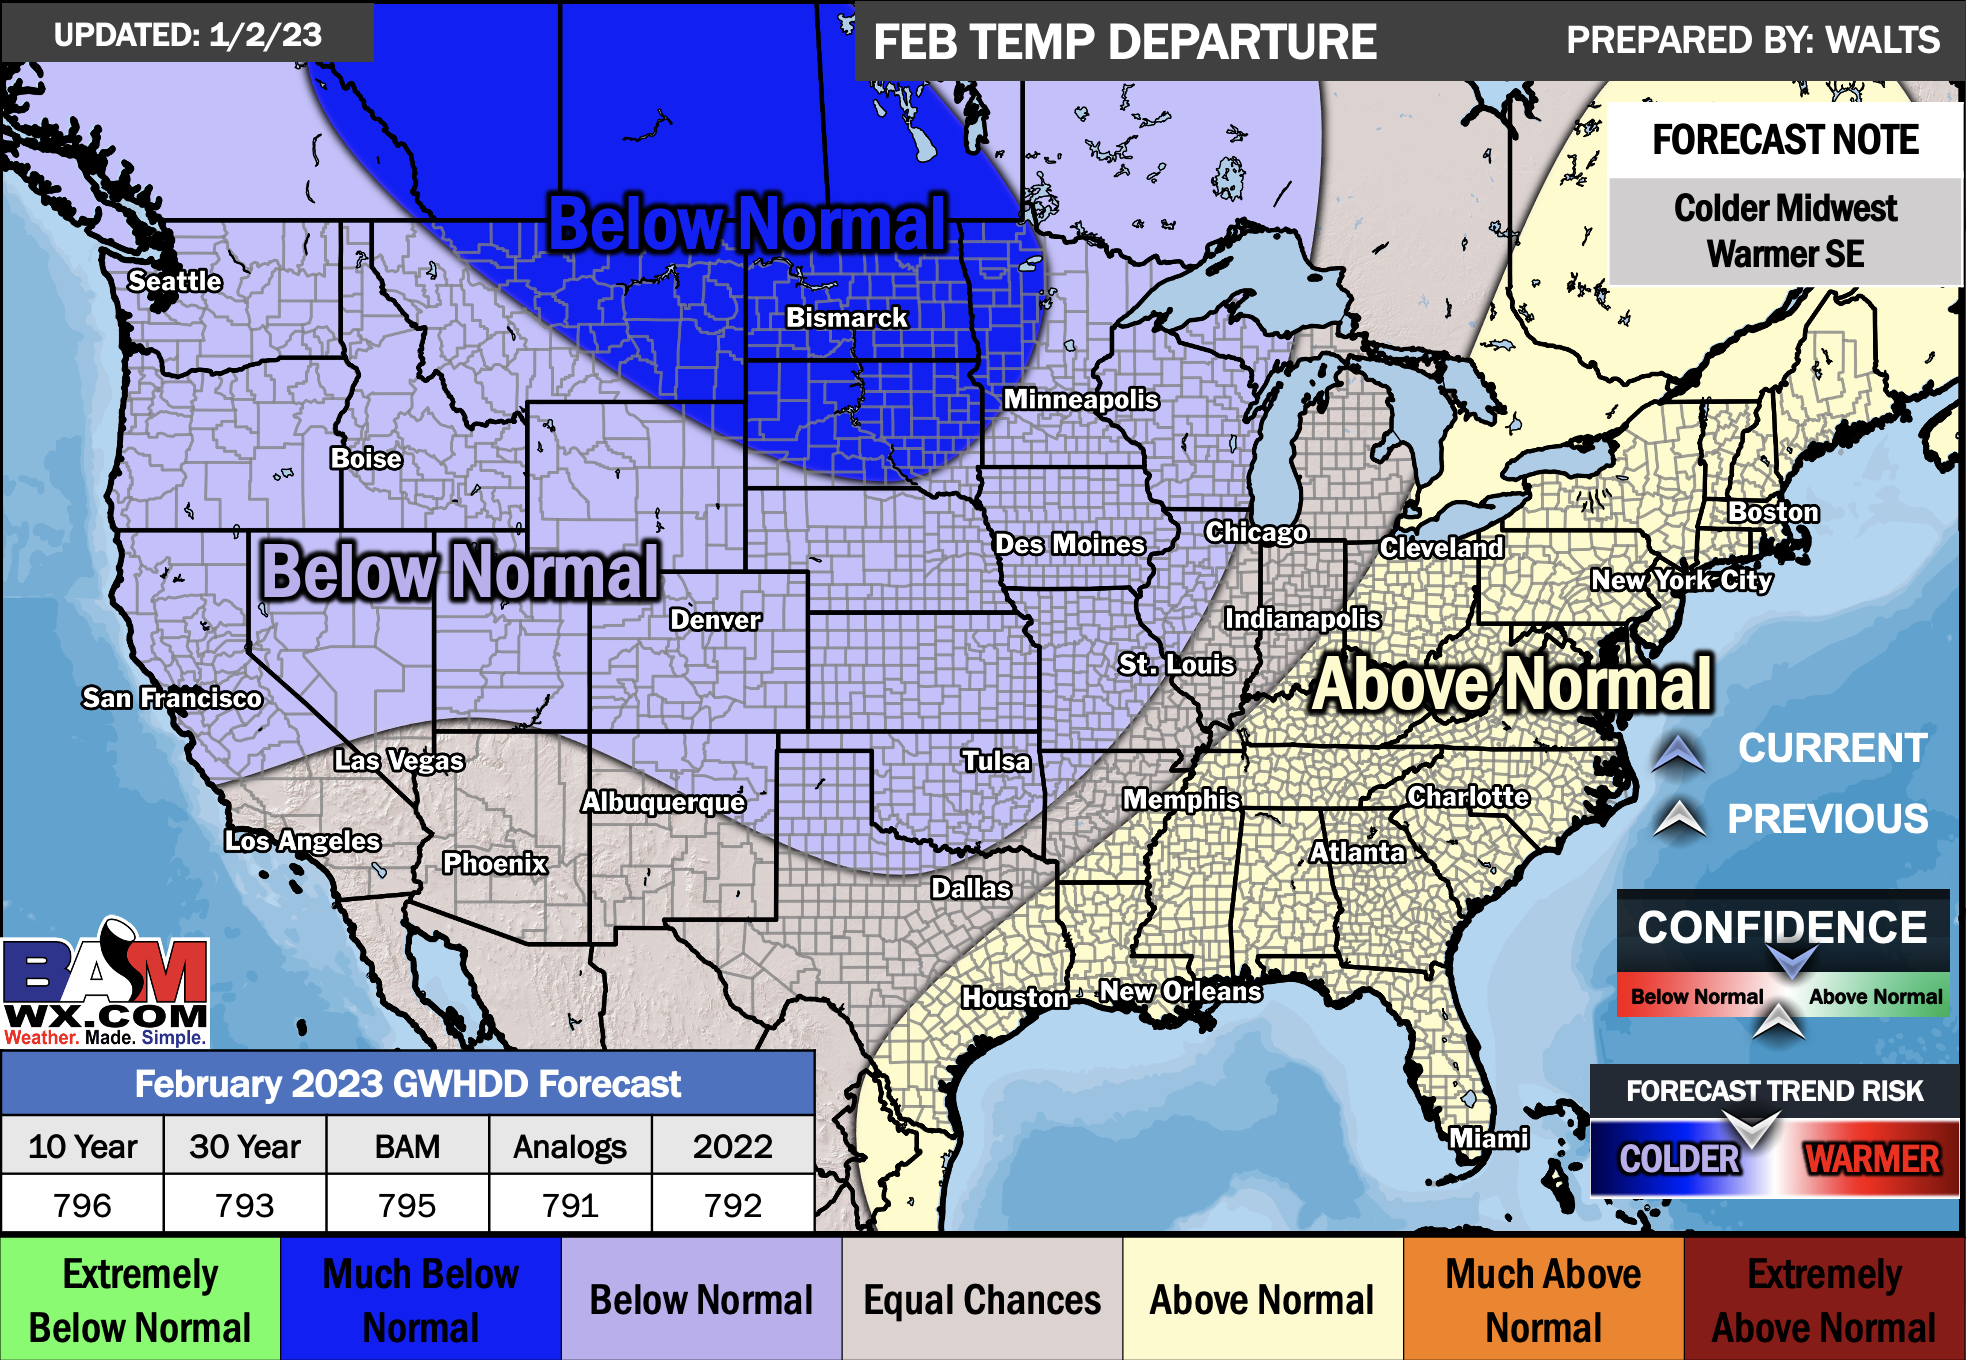
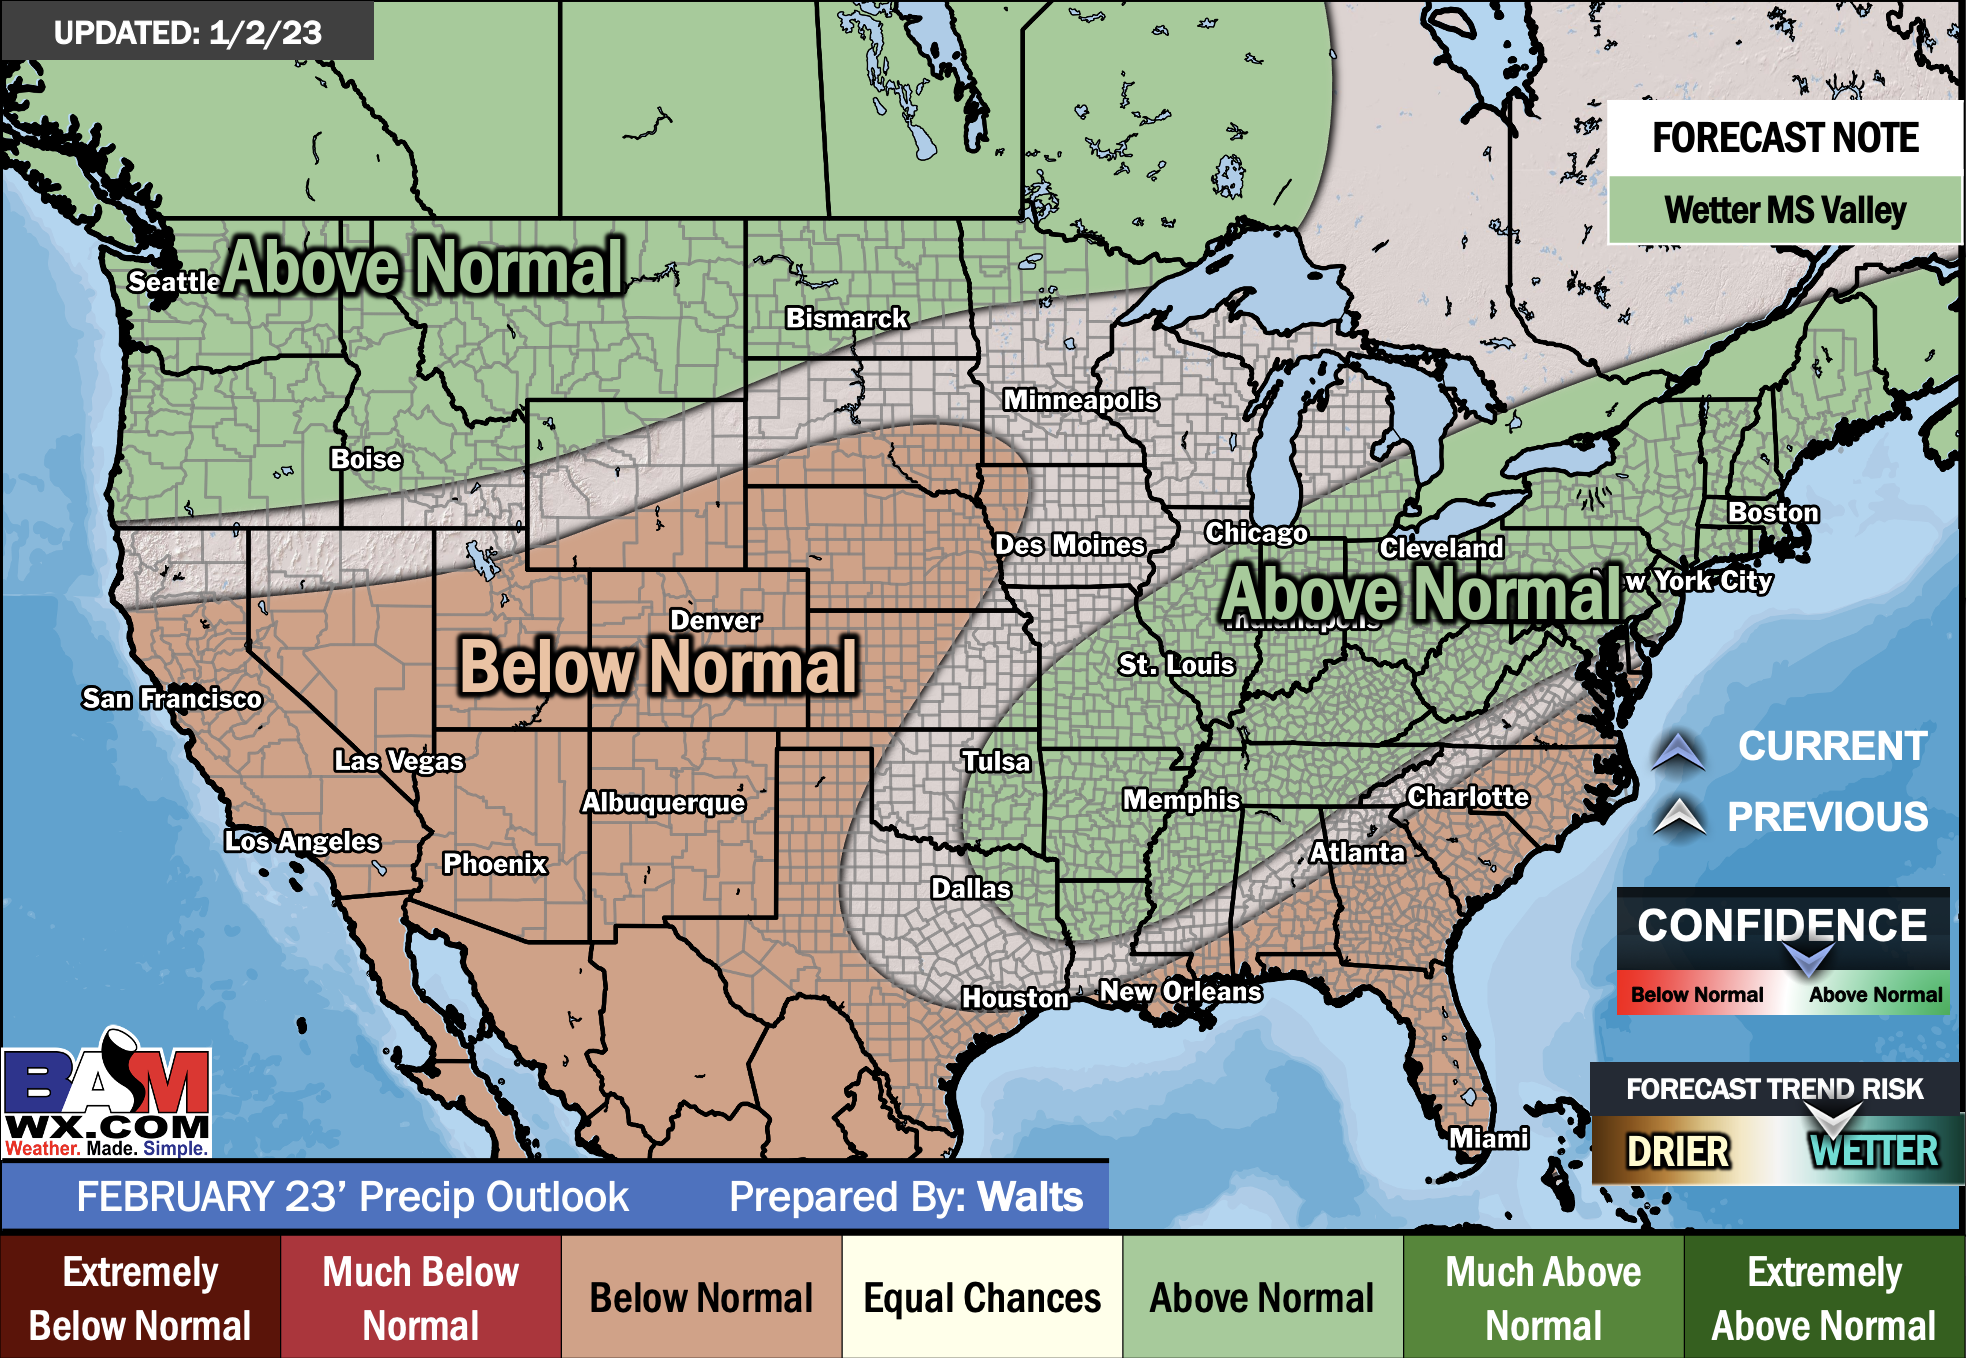
E/BN extremely below normal
M/BN is much below normal
EC equal chances
AN above normal
M/AN much above normal
E/AN extremely above normal
December Temperature Outlook
December Precipitation Outlook
.
E/BN extremely below normal
M/BN is much below normal
EC equal chances
AN above normal
M/AN much above normal
E/AN extremely above normal
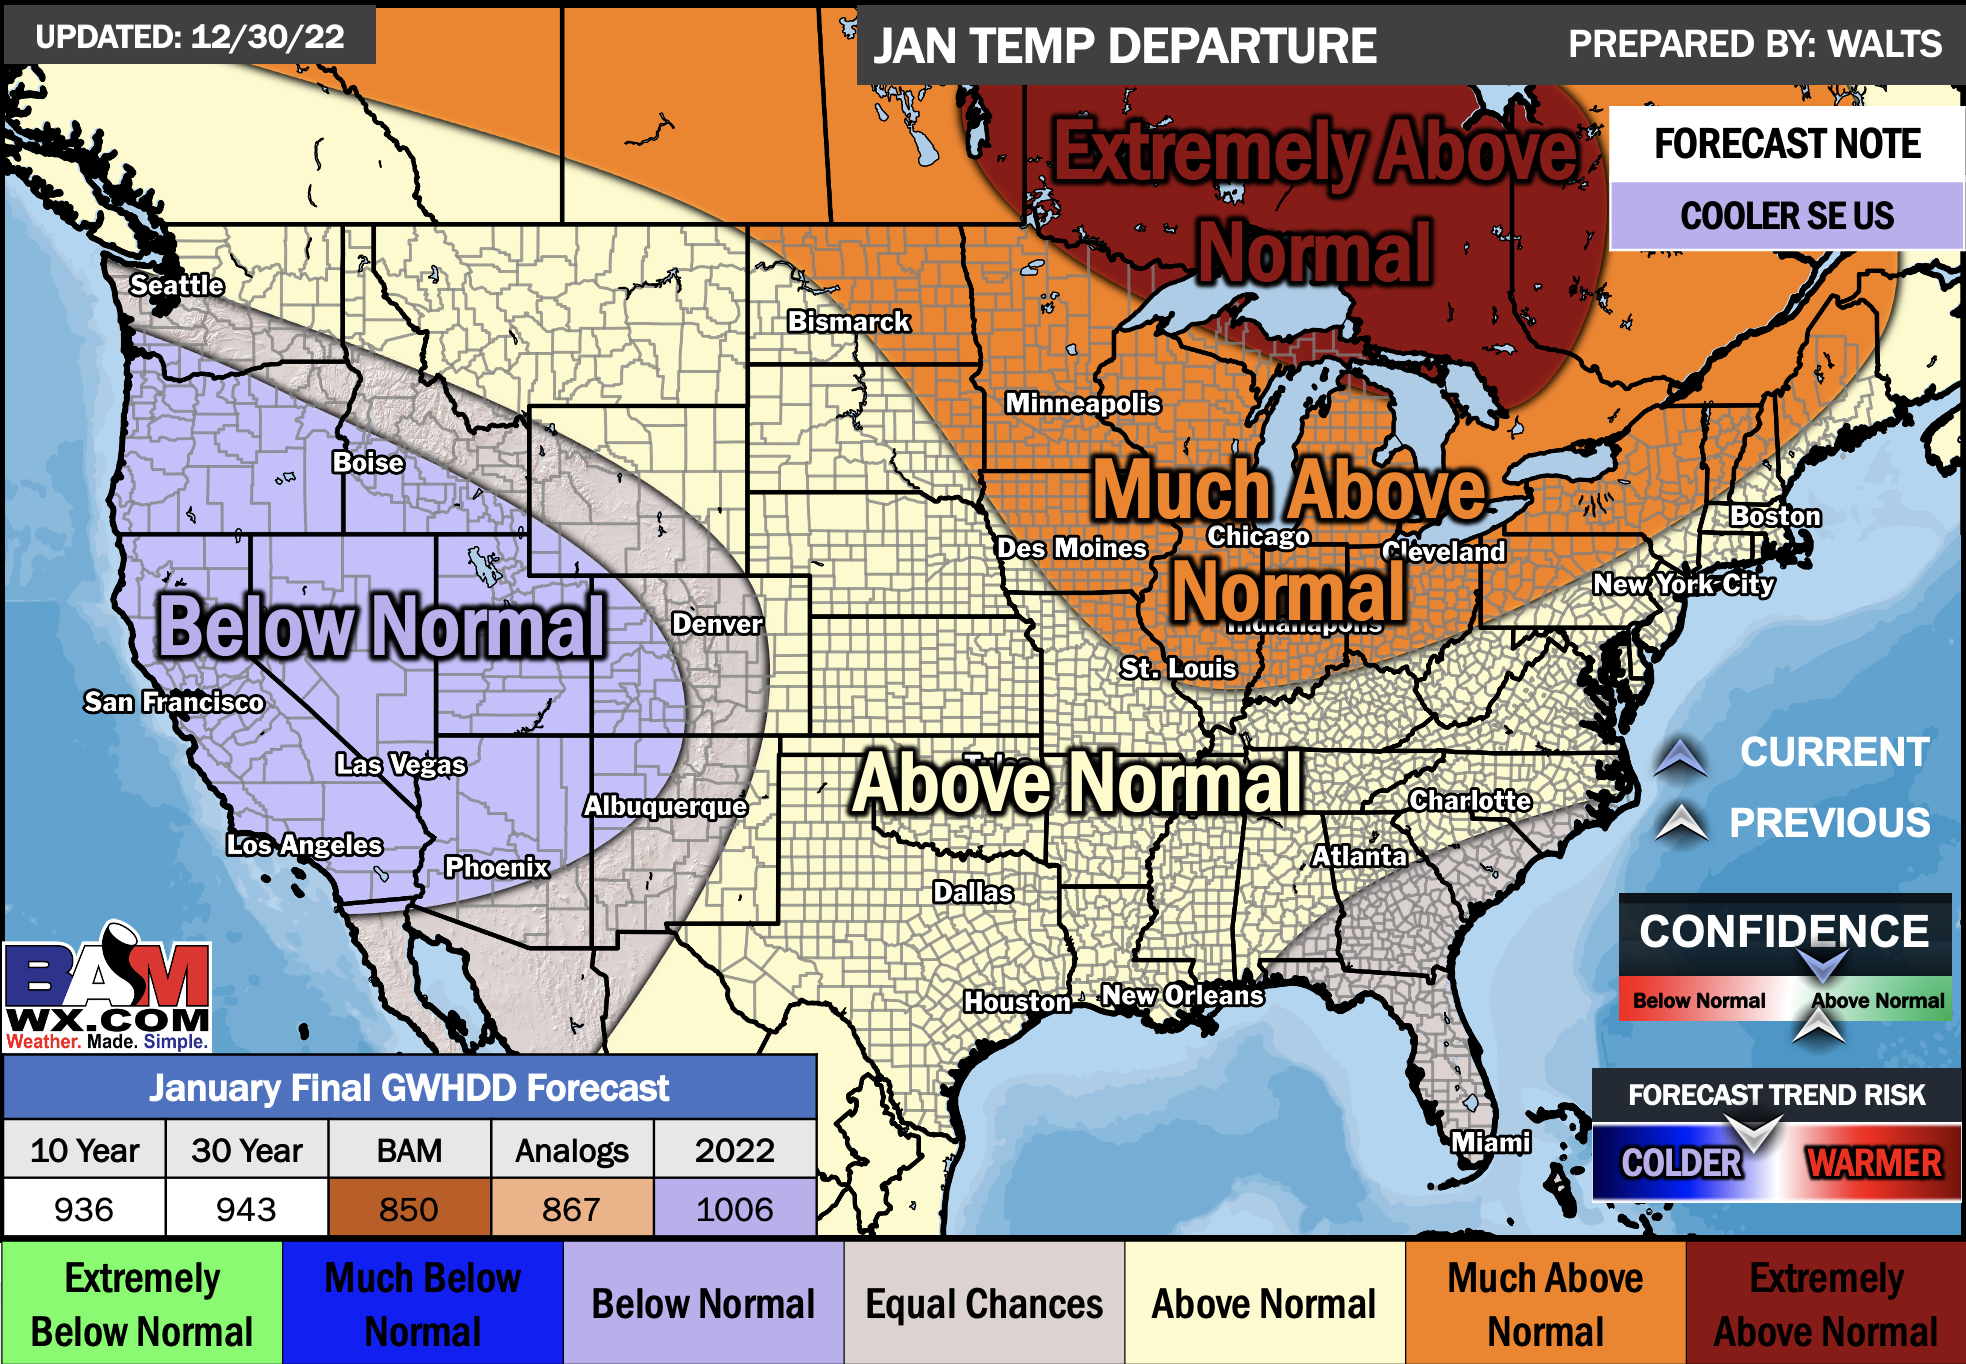
January Temperature Outlook
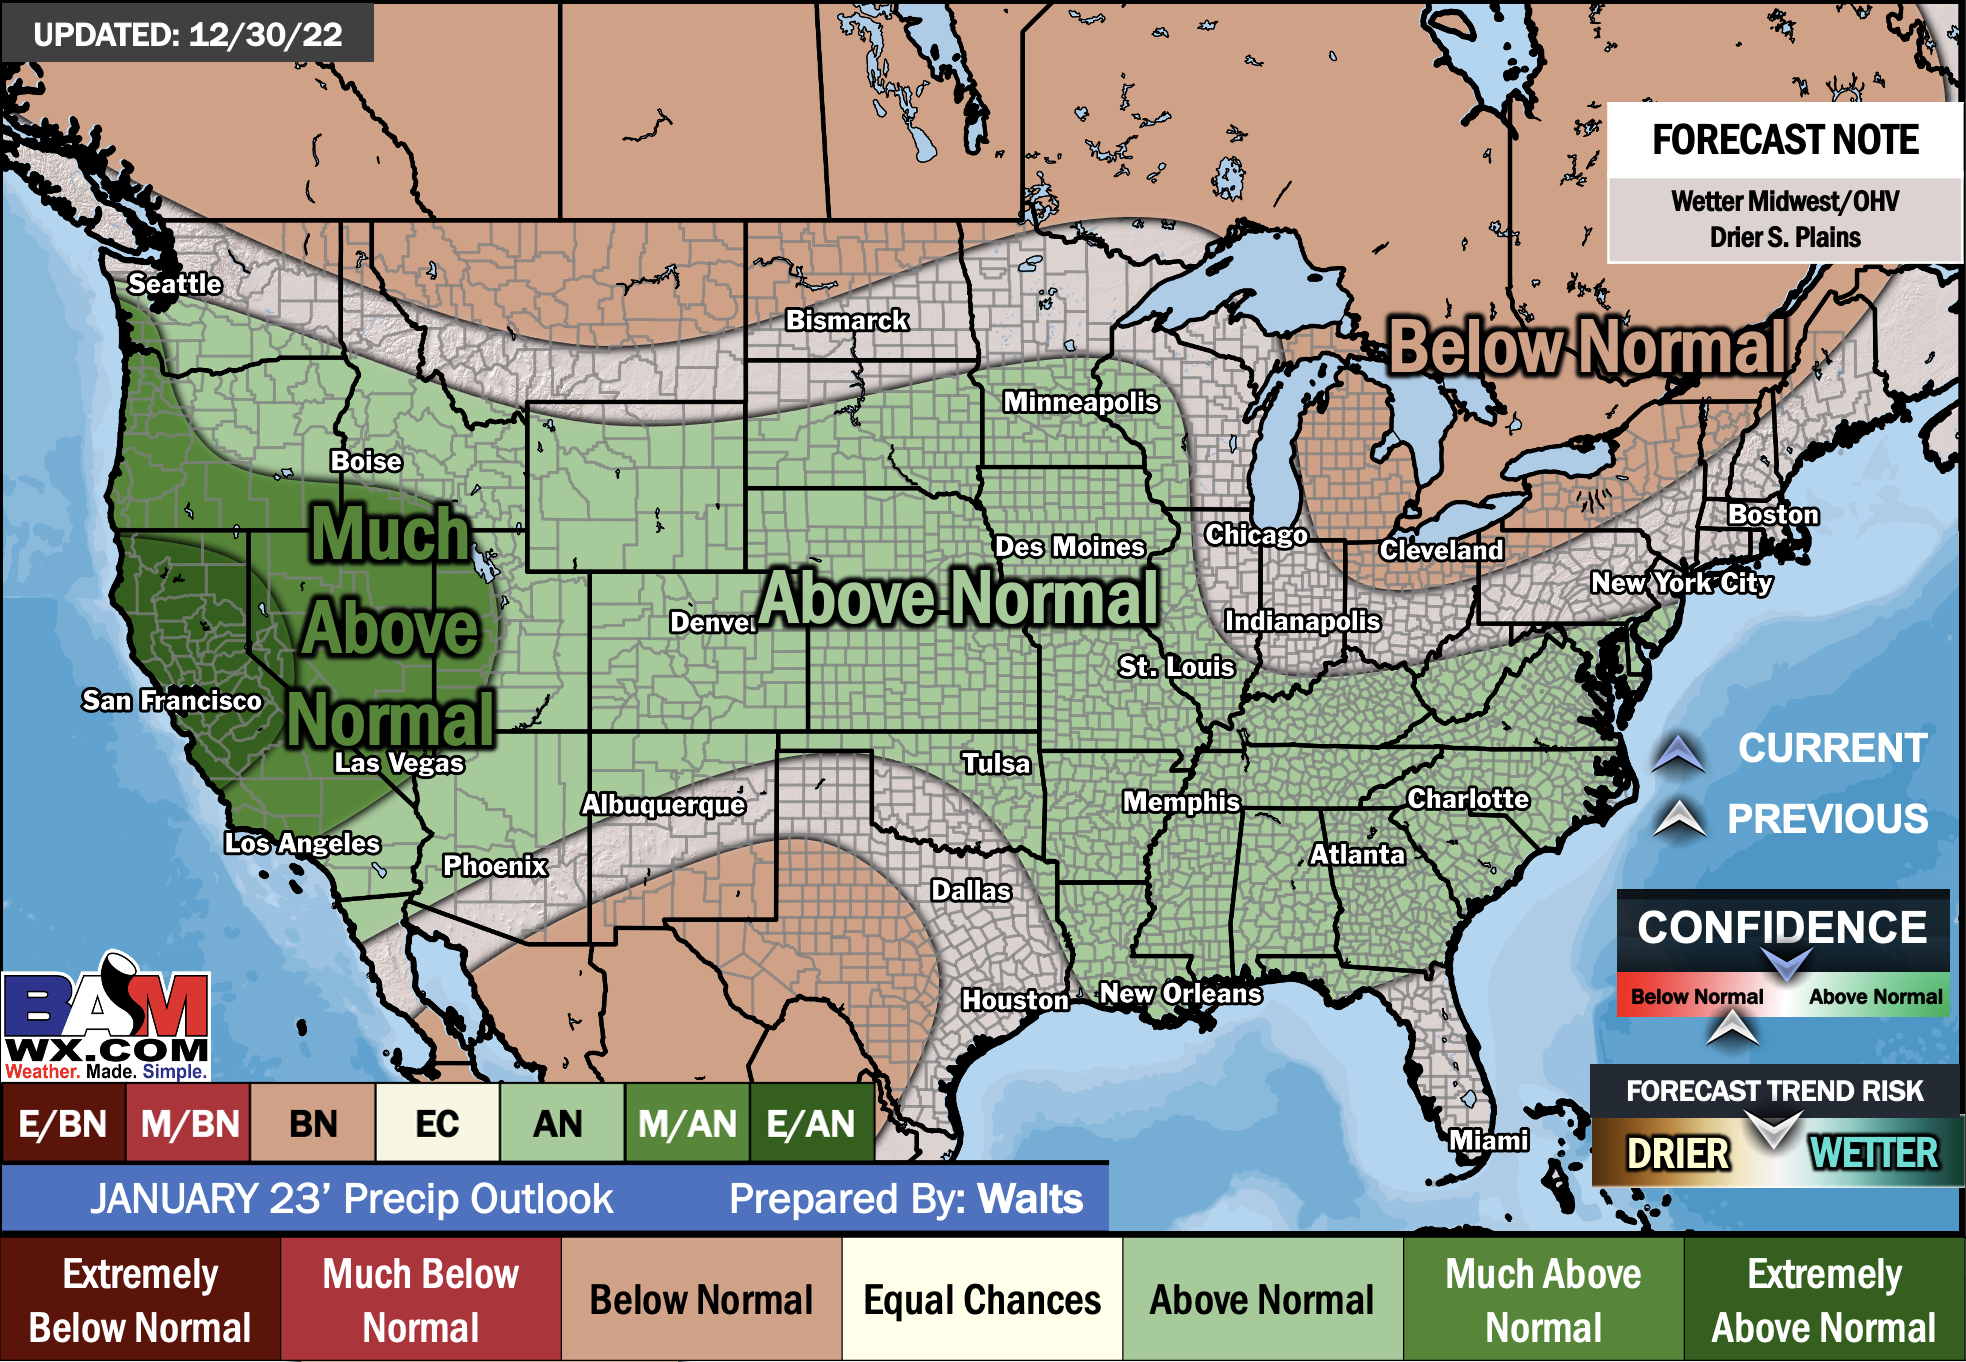
January Precipitation Outlook
.
E/BN extremely below normal
M/BN is much below normal
EC equal chances
AN above normal
M/AN much above normal
E/AN extremely above normal
February Temperature Outlook
February Precipitation Outlook
.
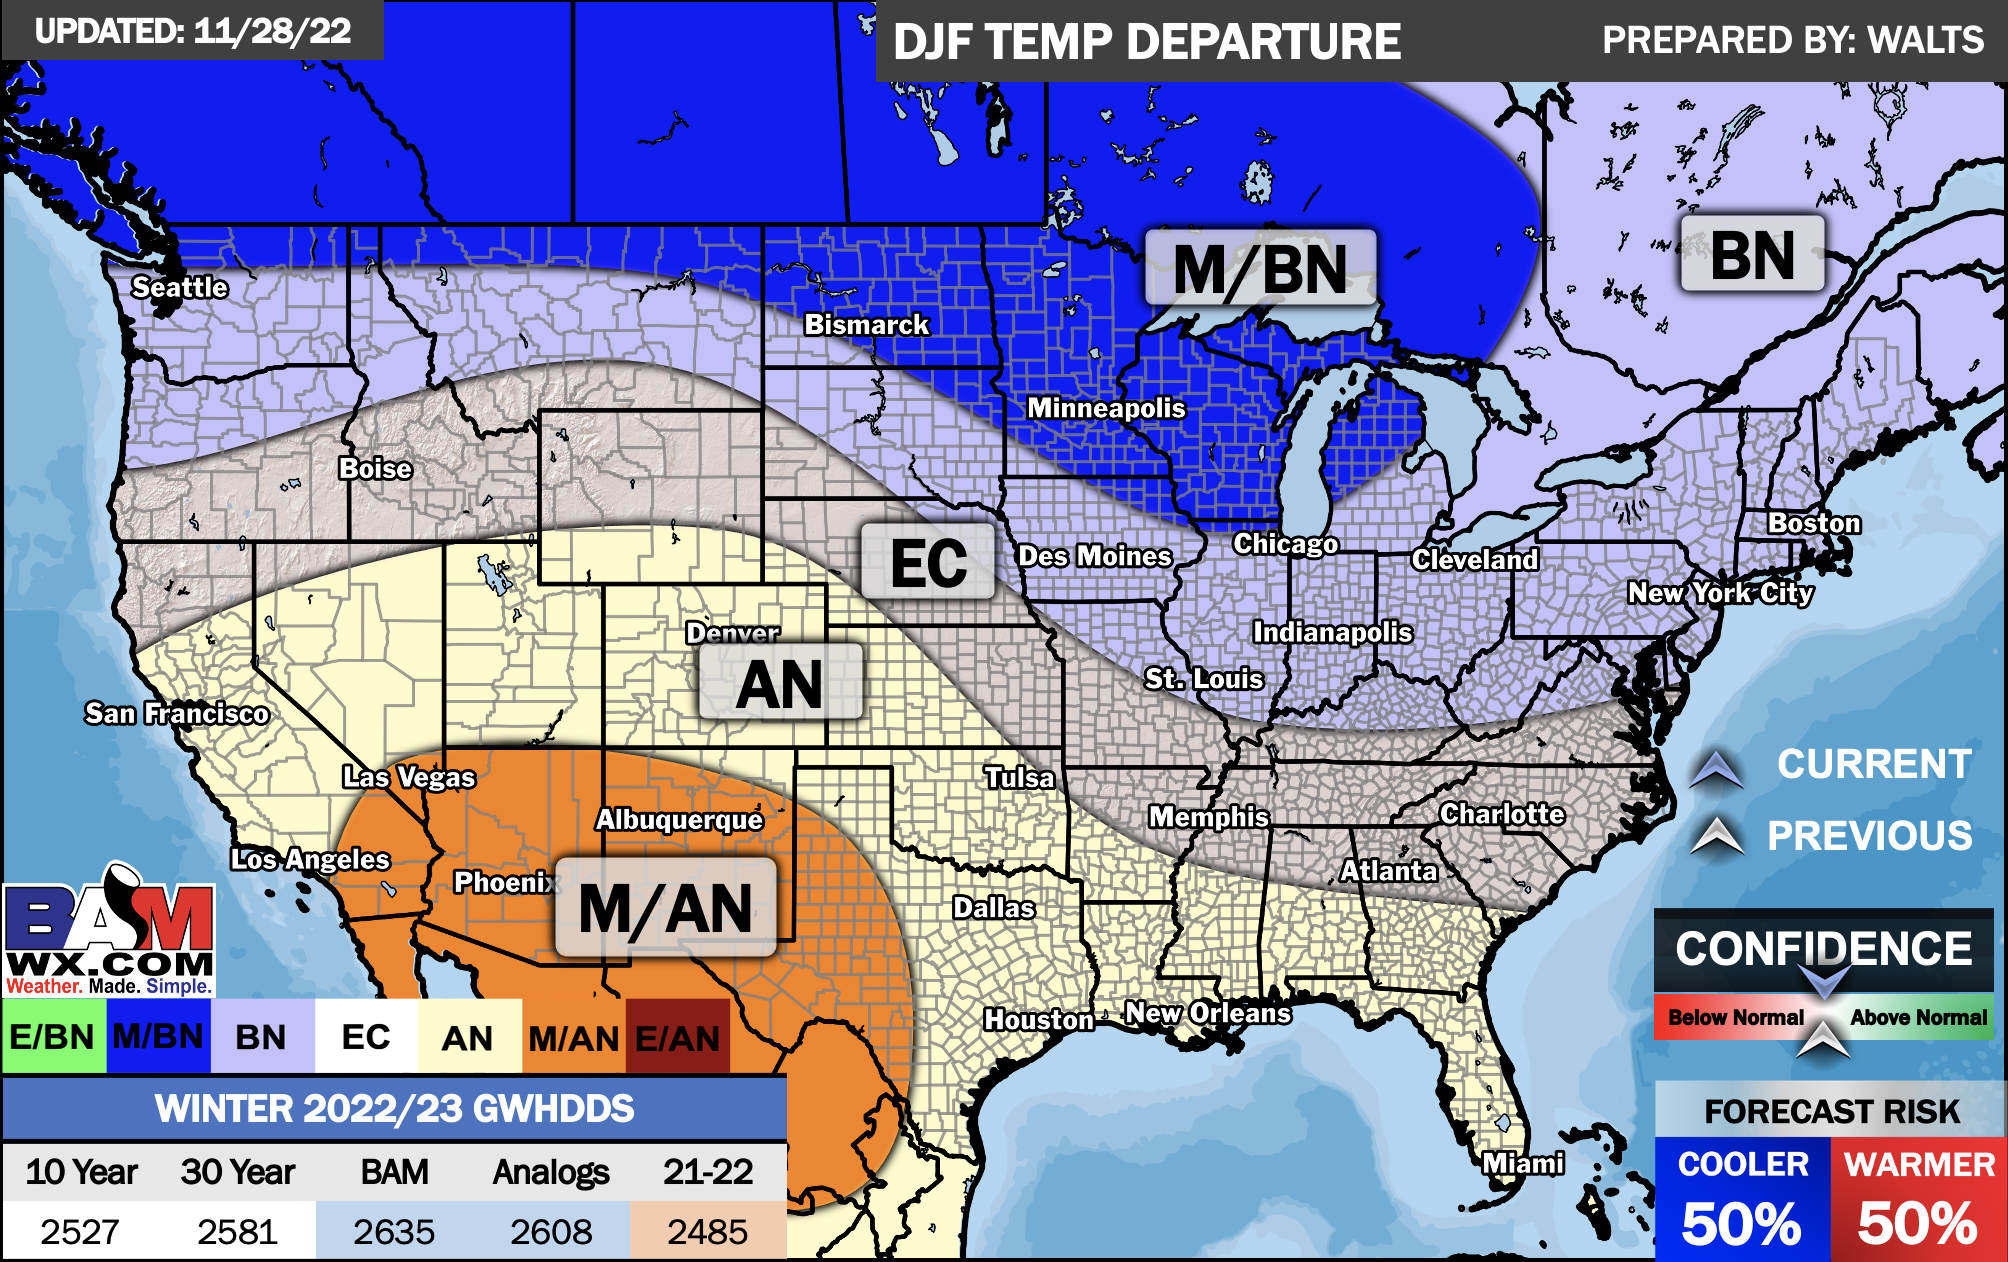
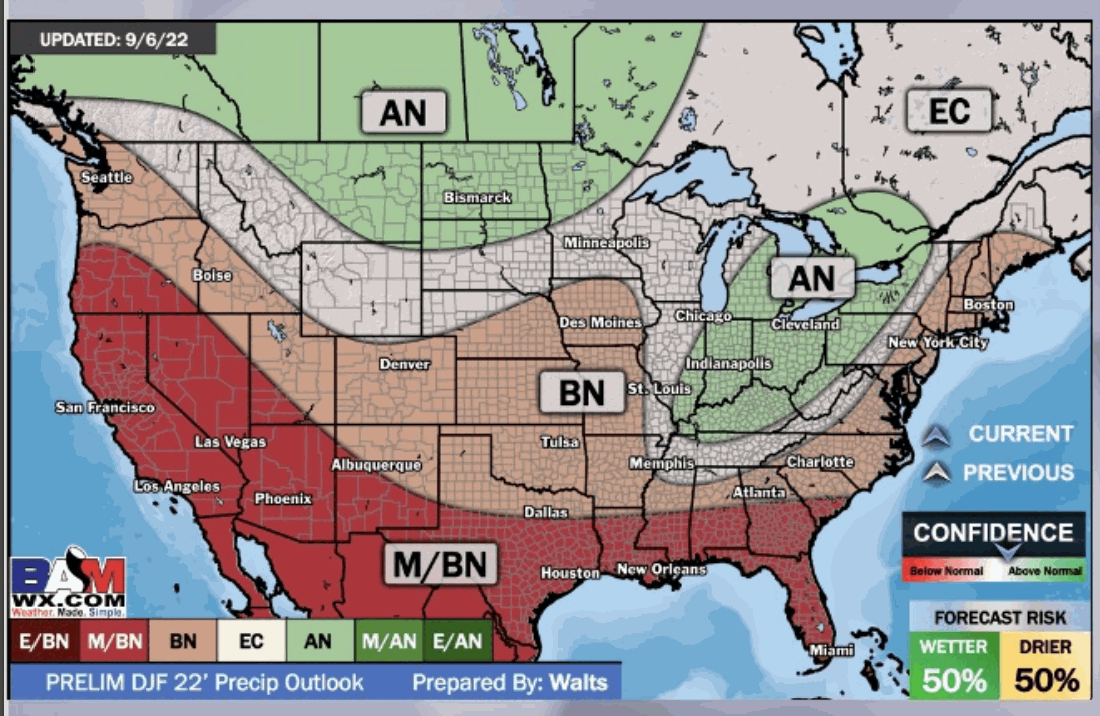
Winter Outlook
E/BN extremely below normal.
M/BN is much below normal
EC equal chances
AN above normal
M/AN much above normal
E/AN extremely above normal.
Double click on the images to enlarge them.
Temperature
Precipitation
.
.
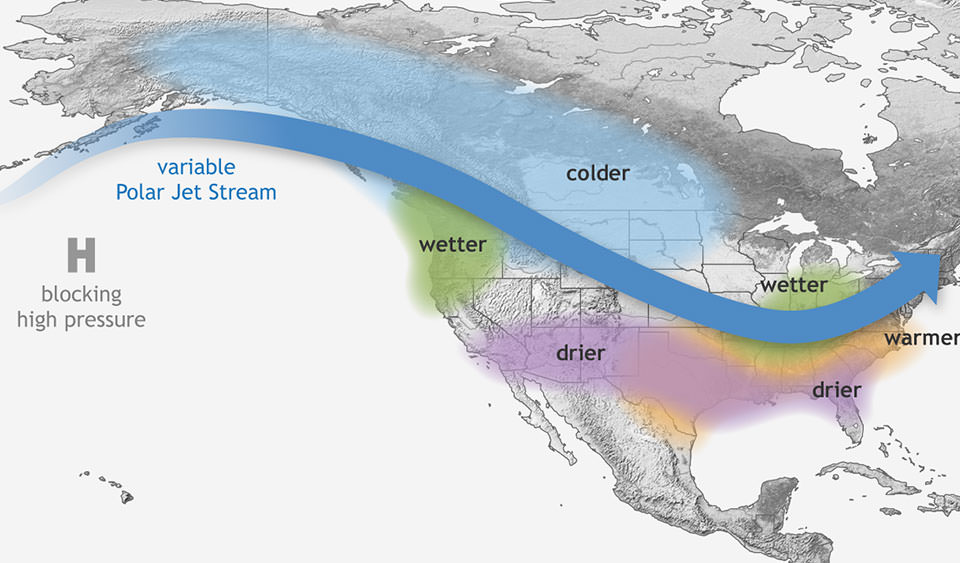
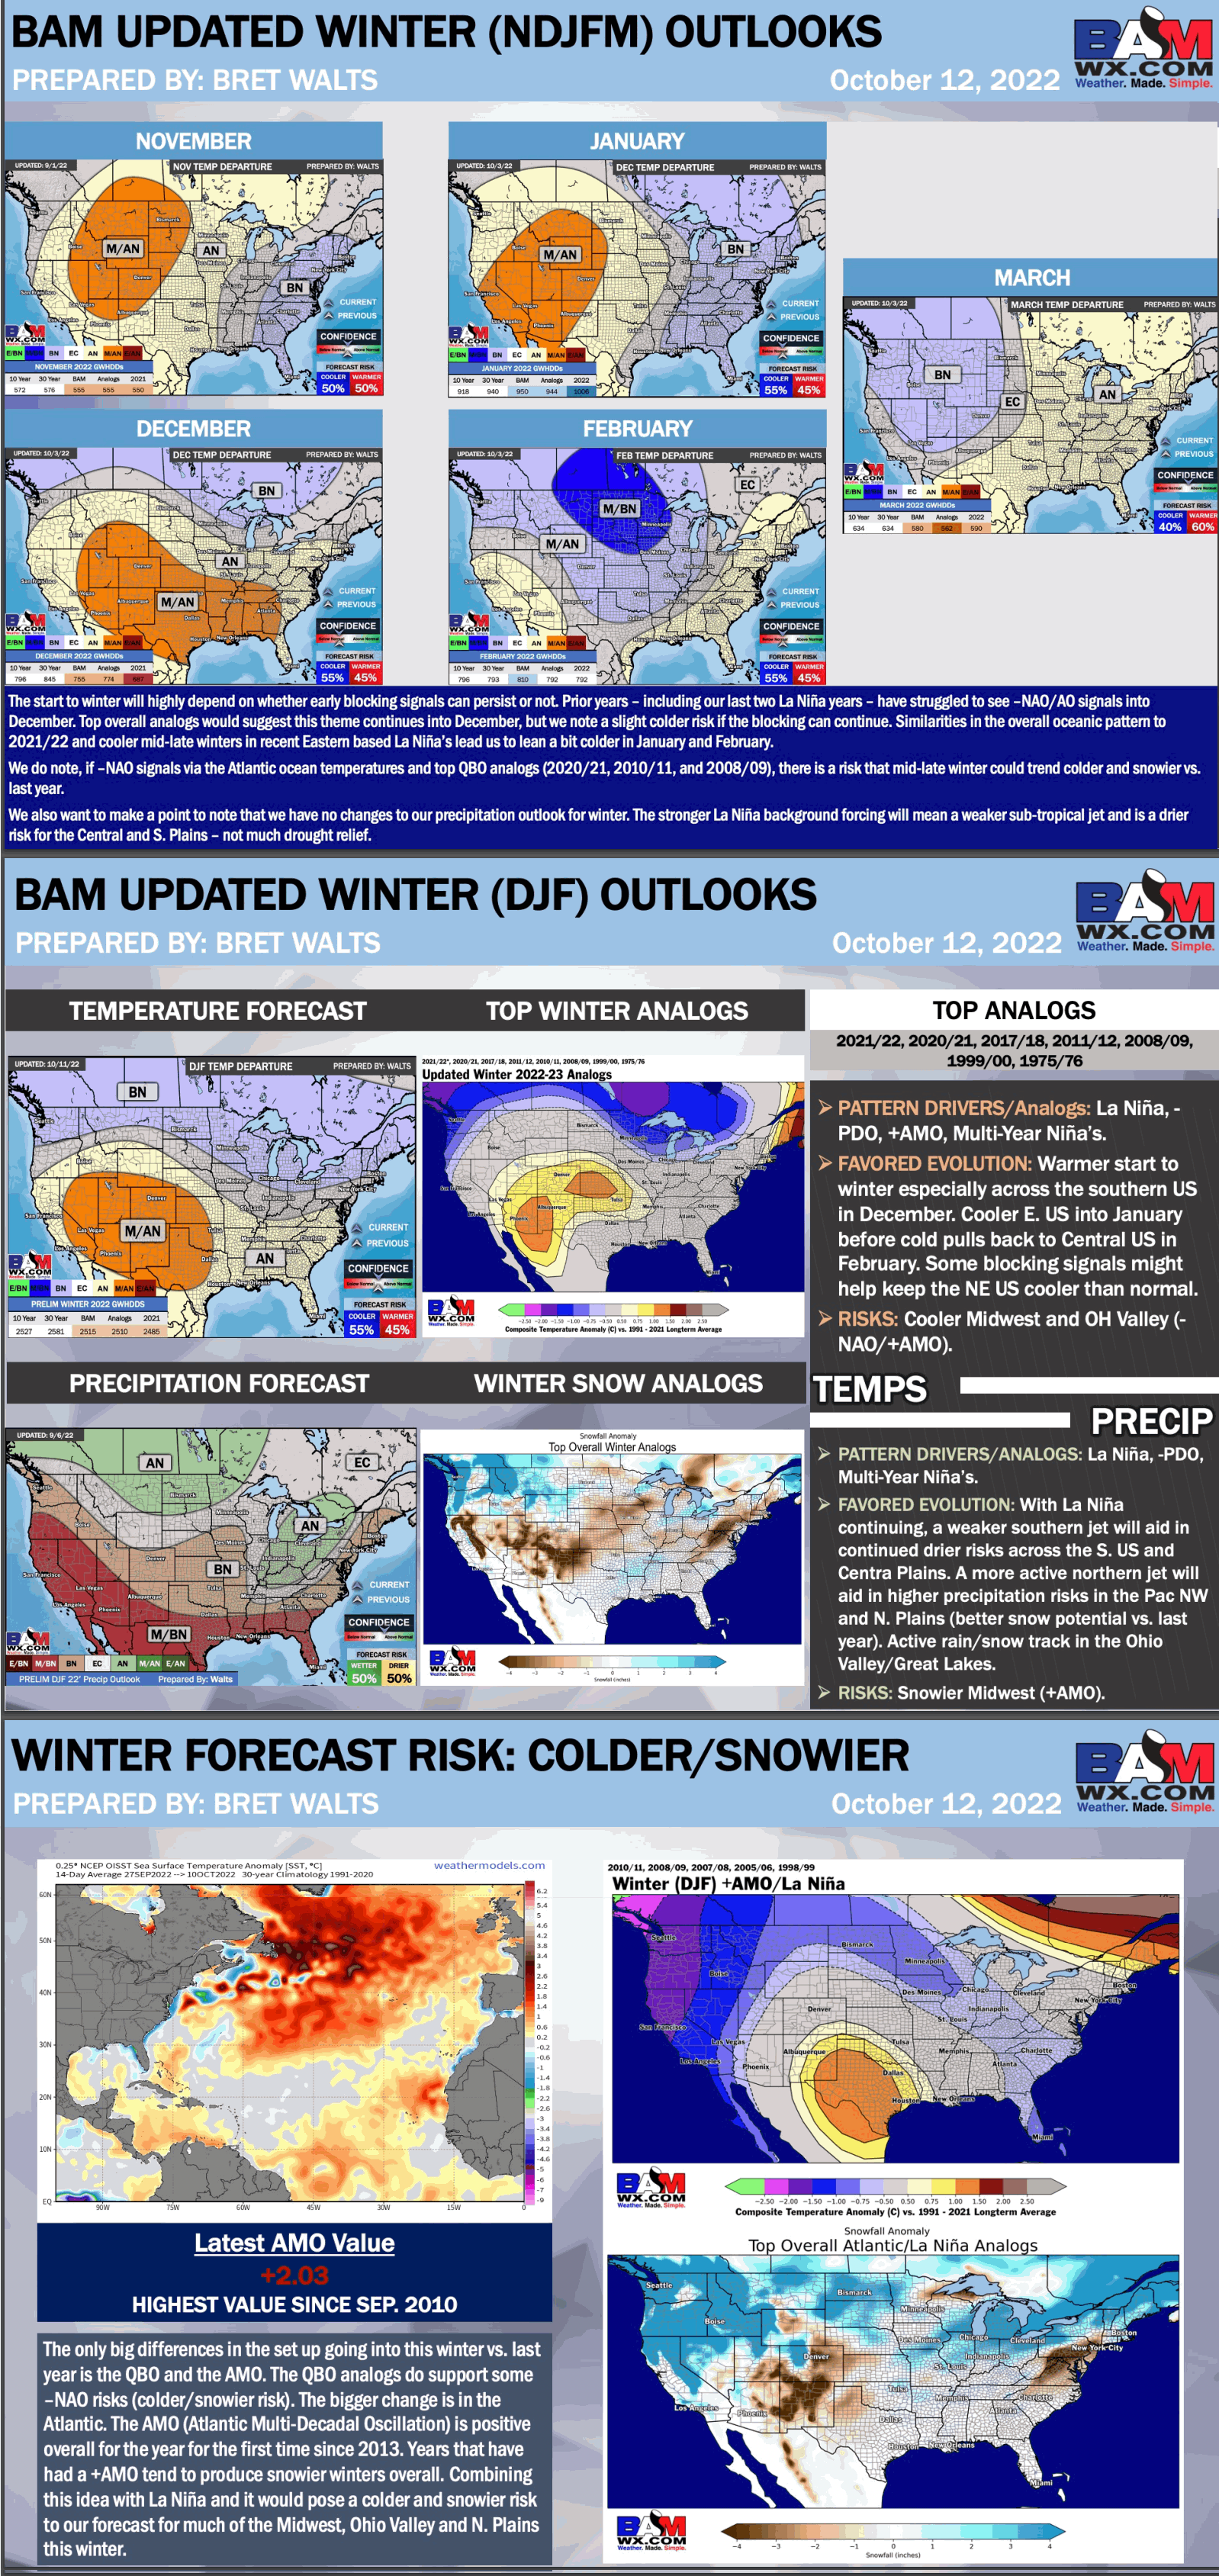
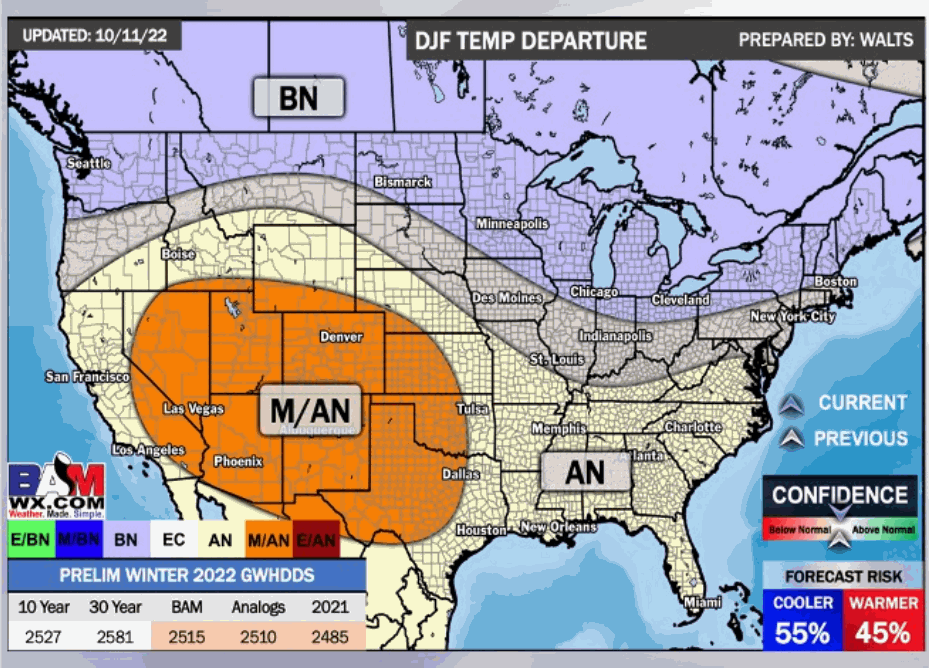
The Winter Outlook has been posted. Another La Nina winter. As always, there will be wild cards in the forecast.
La Nina means that portions of the Pacific Ocean are cooler than normal. El Nino means that the Pacific waters are warmer than normal.
Learn more about La Nina at the following link CLICK HERE
La Niña means Little Girl in Spanish. La Niña is also sometimes called El Viejo, anti-El Niño, or simply “a cold event.” La Niña has the opposite effect of El Niño. During La Niña events, trade winds are even stronger than usual, pushing more warm water toward Asia. Off the west coast of the Americas, upwelling increases, bringing cold, nutrient-rich water to the surface.
These cold waters in the Pacific push the jet stream northward. This tends to lead to drought in the southern U.S. and heavy rains and flooding in the Pacific Northwest and Canada. During a La Niña year, winter temperatures are warmer than normal in the South and cooler than normal in the North
.
No two winters are alike. No two La Nina’s are alike.
The last two winters have been La Nina winters. Both winters delivered a variety of weather conditions.
As you know, during the past two winters we did experience severe thunderstorms and tornadoes. That is not unusual for La Nina conditions.
I do expect an increased risk of severe thunderstorms and ice. Those are common during the La Nina winter years.
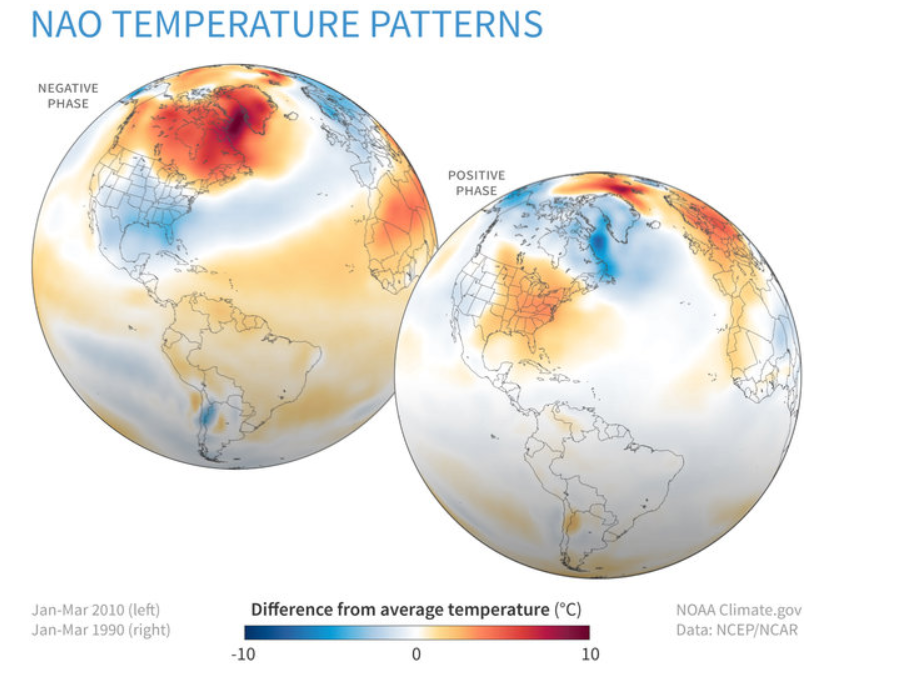
We will have to monitor the NAO. If it does go negative then we have increased probabilities of cold air intrusions.
What is the NAO? Click here for more information.
Let’s keep in mind, that long range forecasts are less accurate than short-range forecasts.
What we can’t tell you are the possible extreme events. You could have a mild December and January and the winter be backloaded with cold and snow during the Month of February. Or, the other way around.
We can’t tell you if there will be one large ice-storm or one large tornado outbreak. Long-range outlooks don’t work that way.
People tend to remember winters as severe if there is a mega-event. Like the big ice storm in 2009. Everyone will remember that winter. Like the December tornado last year. Everyone will remember that winter.
We are able to tell you, with some degree of certainty, the overall generalities of the winter.
Of course, I understand that everyone wants to know if there will be a big snowstorm or a big event. We aren’t that accurate, yet. Those type of forecasts are left for short-range weather outlooks. Not long range ones.
Here is what will influence the winter.
ENSO. La Nina. The third year in a row. Rare to have three La Nina’s in a row. This has only happened three times in recorded history.
To better read the graphic, double click on it.
Outlook thoughts.
Odds favor December through February, when all is said and done, averaging above normal in the temperature department. Above average in the precipitation department.
That certainly does not mean there won’t be cold spells.
Our region typically experiences a wide variety of weather during the winter months. That includes snow, ice, and severe thunderstorms. I would be surprised if this winter doesn’t deliver those conditions.
To better read the graphic, double click on it.
** NOTE the December through February graphics have been updated. The latest ones are these two **
Temperature
Precipitation
![]()

Great news! The videos are now found in your WeatherTalk app and on the WeatherTalk website.
These are bonus videos for subscribers.
The app is for subscribers. Subscribe at www.weathertalk.com/welcome then go to your app store and search for WeatherTalk
Subscribers, PLEASE USE THE APP. ATT and Verizon are not reliable during severe weather. They are delaying text messages.
The app is under WeatherTalk in the app store.
Apple users click here
Android users click here
.

Radars and Lightning Data
Interactive-city-view radars. Clickable watches and warnings.
https://wtalk.co/B3XHASFZ
If the radar is not updating then try another one. If a radar does not appear to be refreshing then hit Ctrl F5. You may also try restarting your browser.
Backup radar site in case the above one is not working.
https://weathertalk.com/morani
Regional Radar
https://imagery.weathertalk.com/prx/RadarLoop.mp4
** NEW ** Zoom radar with chaser tracking abilities!
ZoomRadar
Lightning Data (zoom in and out of your local area)
https://wtalk.co/WJ3SN5UZ
Not working? Email me at beaudodson@usawx.com
National map of weather watches and warnings. Click here.
Storm Prediction Center. Click here.
Weather Prediction Center. Click here.
.

Live lightning data: Click here.
Real time lightning data (another one) https://map.blitzortung.org/#5.02/37.95/-86.99
Our new Zoom radar with storm chases
.
.

Interactive GOES R satellite. Track clouds. Click here.
GOES 16 slider tool. Click here.
College of Dupage satellites. Click here
.

Here are the latest local river stage forecast numbers Click Here.
Here are the latest lake stage forecast numbers for Kentucky Lake and Lake Barkley Click Here.
.
.
Find Beau on Facebook! Click the banner.









 .
.