What you need to know.
.
Key Points
- Thunderstorms are likely into Thursday.
- A few of those thunderstorms could produce wind damage and hail.
- Very heavy rain is likely in some counties. Where thunderstorms train you can pick up one to two inches every thirty minutes.
- Avoid flooded roadways.
.
Call to action.
Monitor updated weather forecasts.
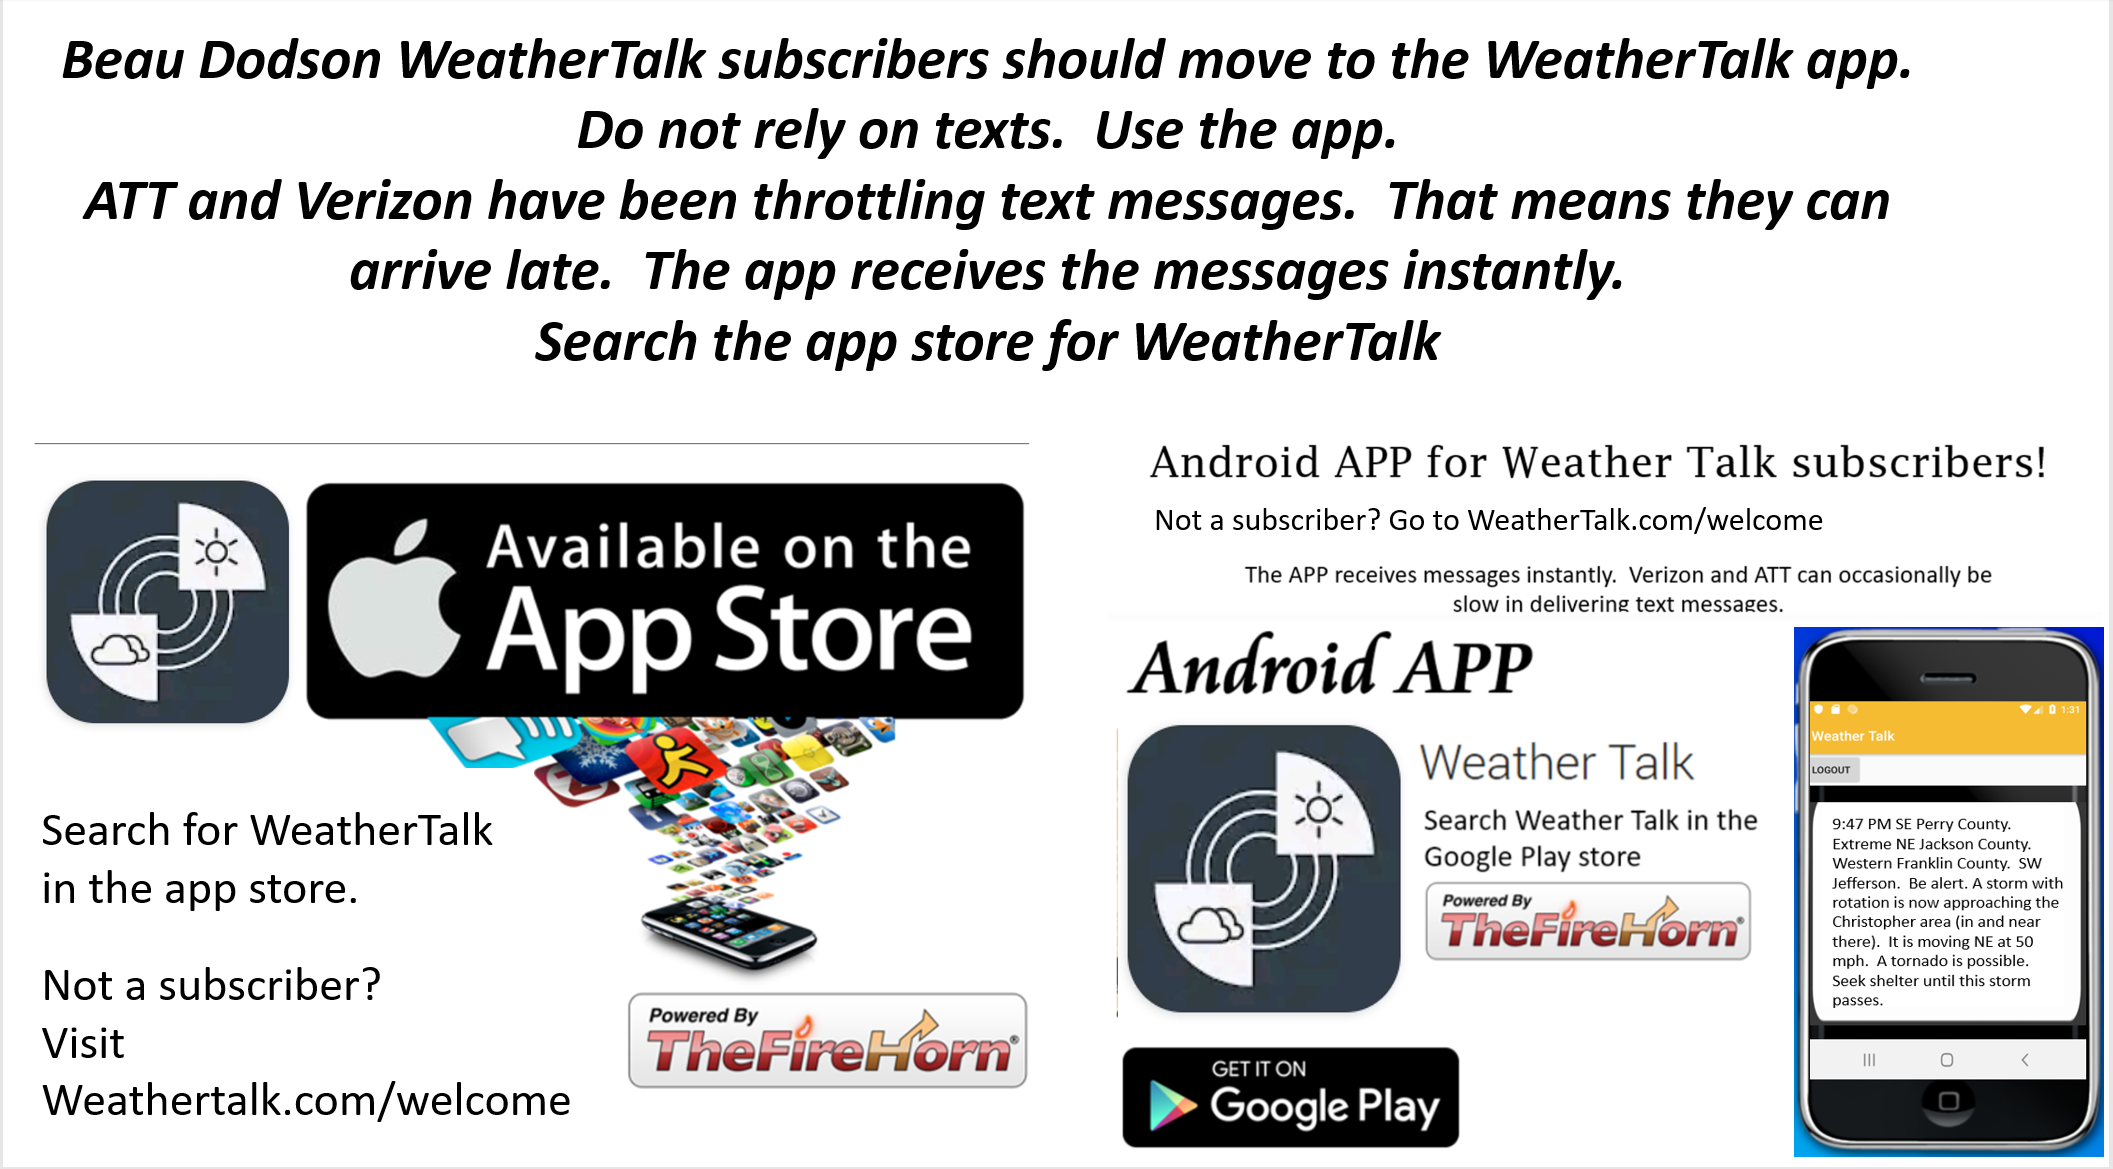
Make sure you are using the Weather Talk app. Download it from the app store. It is under Weather Talk.
TURN ON YOUR BEAU DODSON WEATHER TALK APP. Make sure it is on. Make sure you have not accidentally logged out of the app.
The app is for subscribers (please log into your account and make sure your payment has been updated. We have a large number of declined cards and PayPal payments.
Subscribe at www.weathertalk.com/welcome then go to your app store and search for WeatherTalk. Apple users click here. Android users click here
.
Wednesday, September 2, 2020
I will keep the blog going today. We have a low-end severe weather risk.
.
Tuesday, September 1, 2020
11:53 PM
The severe weather threat appears to be over.
Some of the storms could still produce 30 to 45 mph wind gusts, heavy rain, and lightning.
.
9:47 PM
There is quite a bit of wind shear in western Kentucky. I will need to keep an eye on thunderstorms in case they rotate.
.
6:25 PM
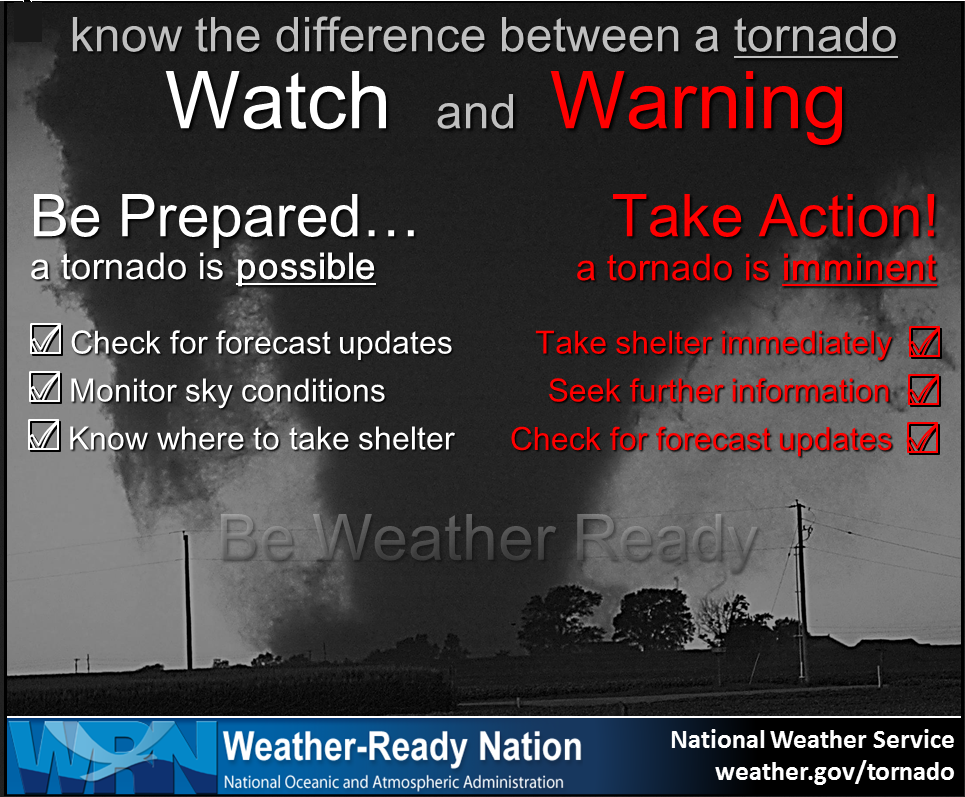
The NWS has issued a severe thunderstorm watch that will include Fulton, Hickman, Graves, Calloway, Obion, Weakley, and Henry Counties.
The overall severe weather threat appears rather small now that our tornadic thunderstorm has weakened.
There is a chance that a few more storms could form. I believe the main reason for them issuing this watch was that thunderstorm.
I will monitor radars and if anything develops I will send out a new app message.
.
6:20 PM
SEPT 1. 6:20 PM
Obion, Fulton, Hickman, and Graves Counties.
The tornadic thunderstorm in Obion County has rapidly weakened over the past 15 minutes. The tornado warning is over. I will monitor any other storms that might form over the coming hours.
For now, the threat of a tornado has ended. There were numerous reports of a tornado on the ground from Pemiscot County into Lake and Obion.
.
6:19 PM
Storm continues to weaken as it moves into Fulton County, KY.
.
6:15 PM
Fulton and Obion Counties.
Radar showed rotation near Clayton, Tennessee. It is moving NE at 20 mph. This storm will soon exit Obion County and enter Fulton County. The rotation is weaker than it was earlier.
A tornado is still possible with this storm. Those in the path should seek shelter until it passes.
Hopefully, it will continue to weaken over the coming minutes.
.
6:12 PM
6:10 PM
AT 608 PM CDT, DOPPLER RADAR INDICATED A SEVERE THUNDERSTORM PRODUCING A TORNADO WAS LOCATED OVER CLAYTON, OR 8 MILES SOUTH OF HICKMAN, MOVING NORTHEAST AT 25 MPH.
.
6:07 PM
Fulton and Obion Counties.
Radar shows that the storm rotation is not as strong as earlier. That does not mean a tornado is still not occurring or possible.
The rotation is now near the Clayton and Fremont, Tennessee, area. In and NEAR those areas should seek shelter now.
The storm is moving NE at 20 mph.
Fulton County should remain on alert.
.
6:02 PM
Rotation in Obion County is rapidly weakening. There is still rotation and a tornado is still possible.
.
5:59 PM
SEPT 1. 5:58 PM
Hickman and Graves County.
A tornadic thunderstorm is moving through Obion County, TN. Tornadoes have been reported on the ground with this thunderstorm.
I am not sure the storm will remain severe or tornadic into your counties. Be alert and prepared to seek shelter if a tornado warning is issued.
.
SEPT 1. 5:56 PM
Update on the tornado warning. AT 5:55 PM CDT, DOPPLER RADAR INDICATED A SEVERE THUNDERSTORM PRODUCING A TORNADO WAS LOCATED NEAR CLAYTON, OR 7 MILES NORTHEAST OF REELFOOT LAKE STATE PARK, MOVING NORTHEAST AT 25 MPH.
.
Fulton County, be alert.
5:54 PM
We believe the Woodland Mills report is actually looking south. The storm is still south of that location. They may be reporting a tornado that is visible to their south. NE of Samburg, TN. Western Obion County.
.
5:51 PM
SEPT 1. 5:51 PM
Obion County Sheriff’s Dept received a phone call of a tornado on the ground near Woodland Mills, TN. Moving E NE at 20 mph.
.
5:49 PM
SEPT 1. 5:49 PM
Areas in and NEAR Samburg, Walnut Log, Fremont, Roneys Store, Dixie, Spout Springs, and Clayton, Tennessee, should seek shelter.
Radar shows strong rotation in or near Samburg movin E NE at 20 to 30 mph.
A tornado may be on the ground.
.
SEPT 1. 5:42 PM
The tornado is now crossing the county line into Obion County. If it is still on the ground then the below areas need to seek shelter now. In and NEAR.
Radar shows strong rotation moving towards Reelfoot Lake, Spout Springs, Samburg, and Lassiter Corner, TN. In and NEAR this locations are in the path of this storm. Seek shelter until this storm passes.
This tornado may still be on the ground. Note: It is moving E NE.
Fulton County, Kentucky, should also monitor.
.
5:40 PM
Radar shows strong rotation moving towards Reelfoot Lake, Spout Springs, Samburg, and Lassiter Corner, TN. In and NEAR this locations are in the path of this storm. Seek shelter until this storm passes.
This tornado may still be on the ground. Note: It is moving E NE.
Fulton County, Kentucky, should also monitor.
.
5:35 PM
Update. AT 535 PM CDT, DOPPLER RADAR INDICATED A SEVERE THUNDERSTORM PRODUCING A TORNADO WAS LOCATED OVER REELFOOT LAKE STATE PARK, MOVING EAST AT 25 MPH.
Seek shelter immediately if you are in the path of this tornado. The rotation did weaken slightly over the last 5 minutes.
This tornado may still be on the ground. Note: It is moving E NE.
.
5:33 PM
At 5:33 PM radar showed a tornado near Tiptonville approaching Reelfoot Lake.
This tornado is moving NE at 20 to 30 mph. The tornado is on the ground. Seek shelter immediately.
Those in extreme western and northwestern Obion County should seek shelter at this time.
Fulton County, be on alert.
.
Sept 1. 5:26 PM
Radar shows a likely tornado near Wynnburg, Keele, Tiptonville, TN. That general area. Anyone in or near there should seek shelter immediately.
The storm is moving E NE at 35 mph.
Fulton and western Obion County should be on alert as I track this storm.
.
5:21 PM
Sept 1. 5:21 PM
Radar shows a likely tornado near Mooring and Wynnburg. That general area. Anyone in or near there should seek shelter immediately.
Radar shows strong rotation. We believe a tornado is occurring.
.
5:17 PM
September 1. 5:18 PM
Lake and Obion. A small storm is moving into Lake County. This storm could produce funnel clouds or even a brief tornado. It was near or south of Tiptonville, TN.
The storm is moving east at 25 mph.
..
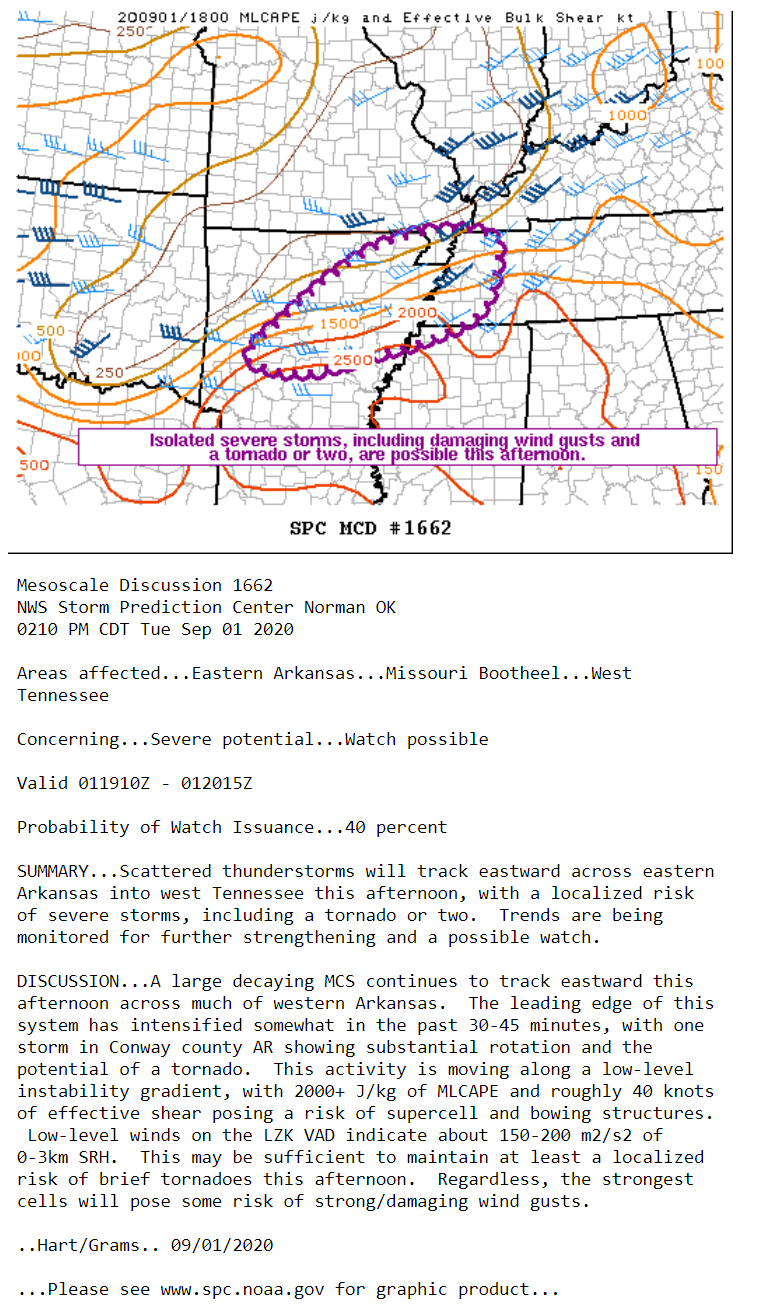
2:19 PM Update from SPC
.
1:28 PM
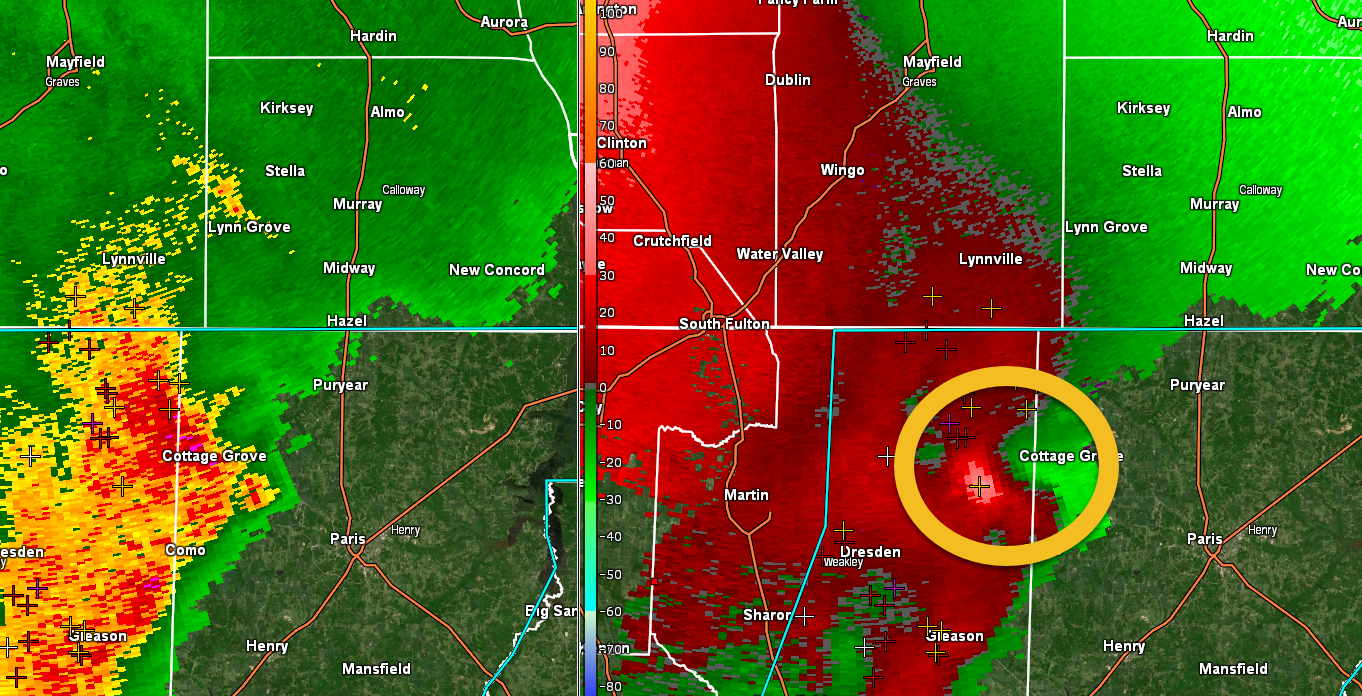
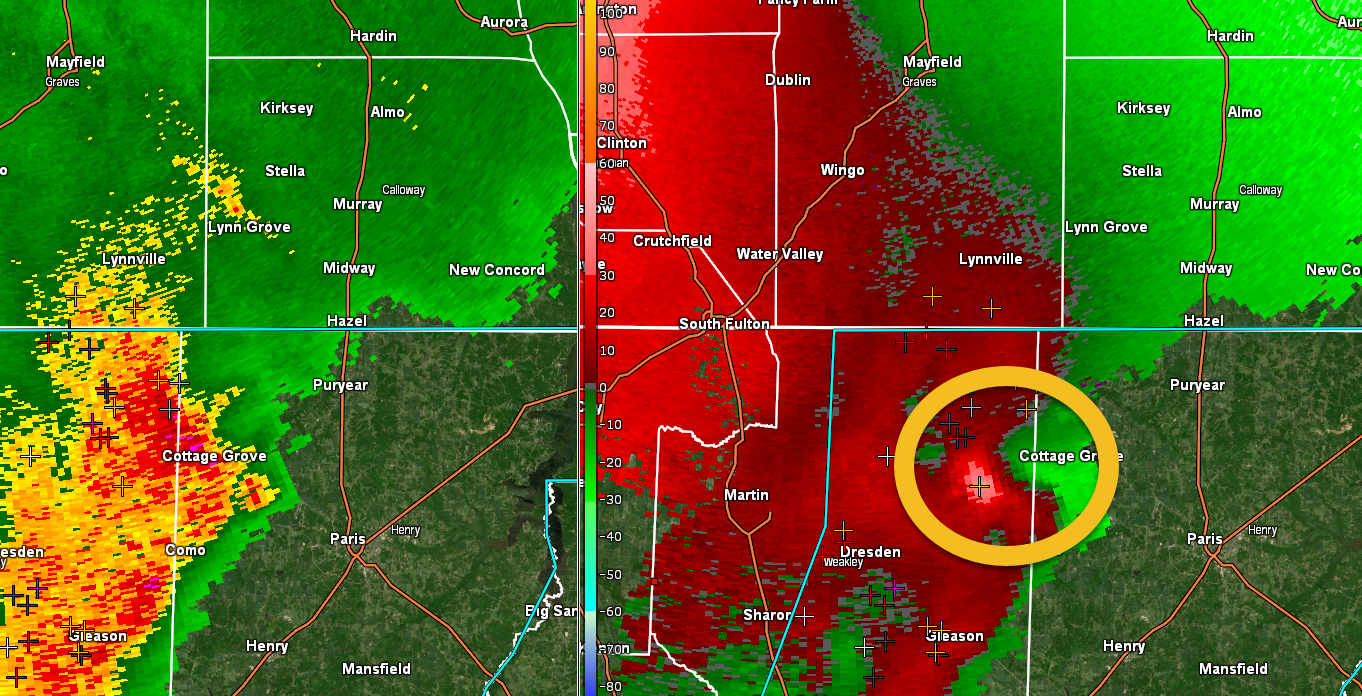
Radar shows a band of moderate to heavy thunderstorms extending from extreme southern Calloway County into Henry County. Over the past 15 minutes the storm has weakened some. Radar shows wind gusts of 30 to 40 mph.
This storm is moving E and slightly NE at 35 mph.
There was some rotation earlier but that has weakened. Continue to stay alert as these storms pass through your area.
The heaviest part of the storm will remain in Henry County, TN.
Radar
Interactive-city-view radars. Clickable watches and warnings.
https://wtalk.co/B3XHASFZ
.
1:03 PM
MEG issues Areal Flood Advisory for Carroll, Gibson, Henry, Weakley [TN] till 4:15 PM CDT
,
12:59 PM
Radar shows a possible severe thunderstorm near Palmersville and Cottage Grove, Tennessee in Weakley/Henry Counties.
This storm is moving E and slightly NE at 35 mph.
We will need to monitor this storm to see if it tracks into southern Calloway County.
This storm may produce wind damage. There is also some rotation with it. Be weather aware as this storm passes through your area.
.
12:58 PM
Radar shows a severe thunderstorm near Palmersville and Cottage Grove, Tennessee in Weakley/Henry Counties.
This storm is moving E and slightly NE at 35 mph.
This storm may produce wind damage. There is also some rotation with it. Be weather aware as this storm passes through your area.
,
12:33 PM
Radar shows the bulk of the wind in TN. It may clip southern Graves County and Calloway.
,
12:26 PM
September 1. 12:25 PM
Graves, Calloway, Weakley, and Henry Counties.
A line of thunderstorms is approaching from the west. Some of these storms show evidence of 40 to 50 mph wind gusts. The storms are moving E NE at 35 mph.
Radar
Interactive-city-view radars. Clickable watches and warnings.
https://wtalk.co/B3XHASFZ
.
12:24 PM
MEG issues A SIGNIFICANT WEATHER ADVISORY HAS BEEN ISSUED UNTIL 100 PM CDT FOR for Carroll, Gibson, Obion, Weakley [TN] till 1:00 PM CDT
.
12:12 PM
MEG issues Areal Flood Advisory for Dyer, Gibson, Lake, Obion [TN] and Pemiscot [MO] till 3:15 PM CDT
.
11:48 PM update
PAH issues Areal Flood Advisory for Fulton [KY] and New Madrid [MO] till 1:30 PM CDT
.
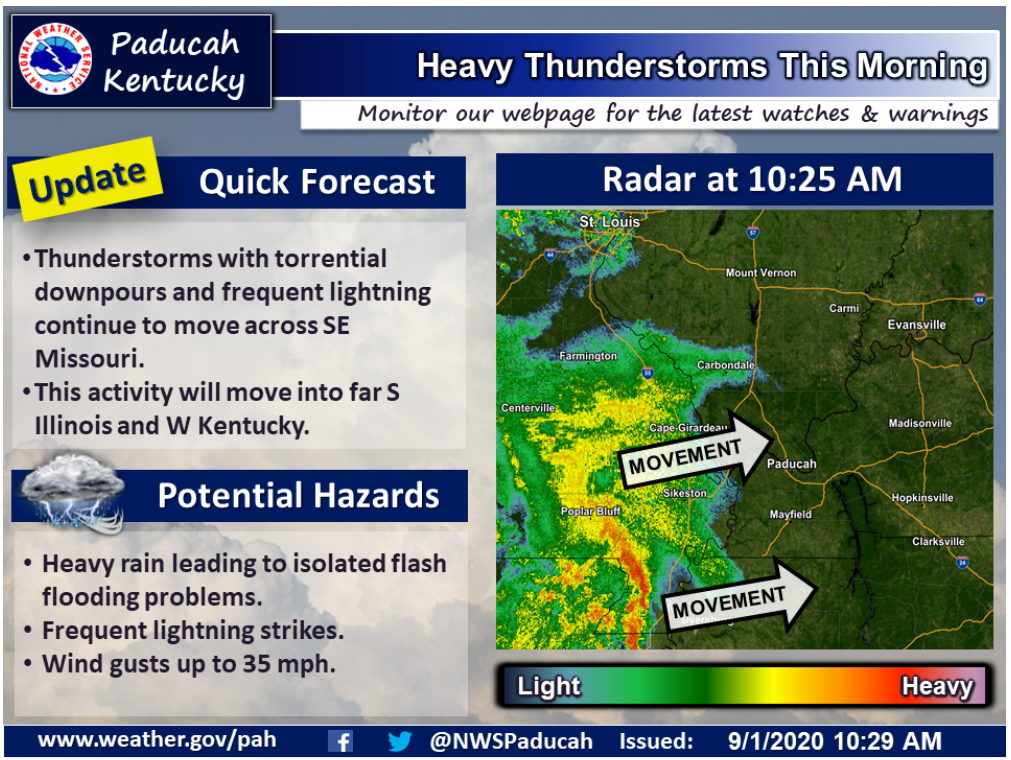
10:40 AM update.
.
10 AM update
MEG issues Flash Flood Watch for Lake [TN] and Dunklin, Pemiscot [MO] and Clay, Craighead, Greene, Mississippi, Poinsett [AR] till Sep 03, 1:00 PM CDT
PAH issues Areal Flood Advisory for Butler, Carter, Ripley, Wayne [MO] till 12:30 PM CDT
Local Storm Report by NWS PAH: 5 W Fairdealing [Ripley Co, MO] trained spotter reports HEAVY RAIN of M0.90 INCH at 09:21 AM CDT — 0.9 inch of rain in a half hour. low lying areas starting to fill up with water. also, 0.62 inch of rainfall in 20 minutes up to 9:13 am.
PAH issues Areal Flood Advisory for Bollinger, Cape Girardeau, Scott, Stoddard [MO] till 12:45 PM CDT
.
10 AM update
Widespread rain is moving into the area.
Radars
Interactive city-view radars
http://weatherobservatory.com/weather-radar.htm
A third backup radar
https://weathertalk.com/morani
Clickable watches and warnings can be viewed on the local city-view interactive radars (link above). Be sure and turn on the warnings above the local radars.
A new regional radar we offer
https://imagery.weathertalk.com/prx/RadarLoop.mp4
Lightning data
https://wtalk.co/7QT7WHKU
.
.
6:30 AM update.
Welcome to meteorological fall! Meteorologists consider September through November to be fall. Sometimes the weather follows along. That will be the case this time.
Big weather changes are on the way!
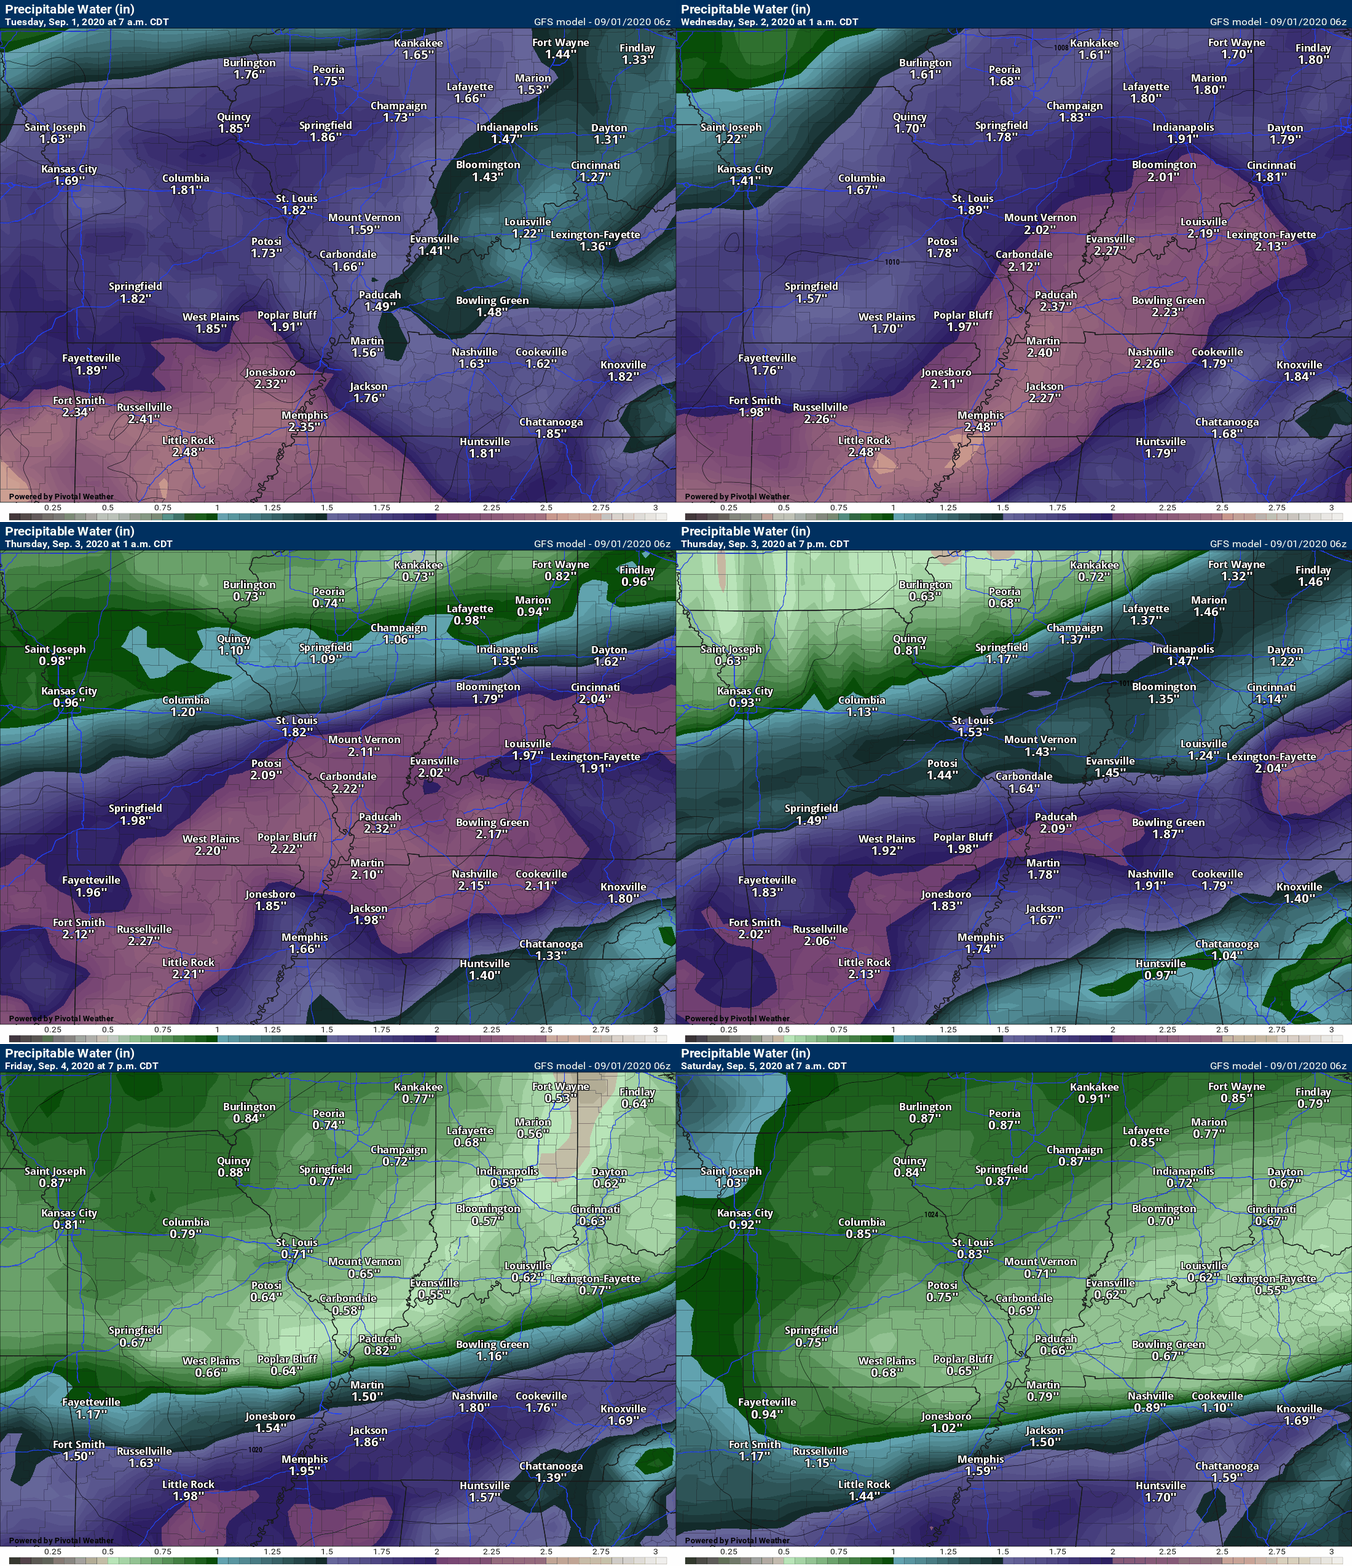
First, we have to deal with several days of potentially heavy rain. There is a LOT of moisture in the atmosphere. Well above normal PWAT values. PWAT is a measure of moisture in the entire atmosphere.
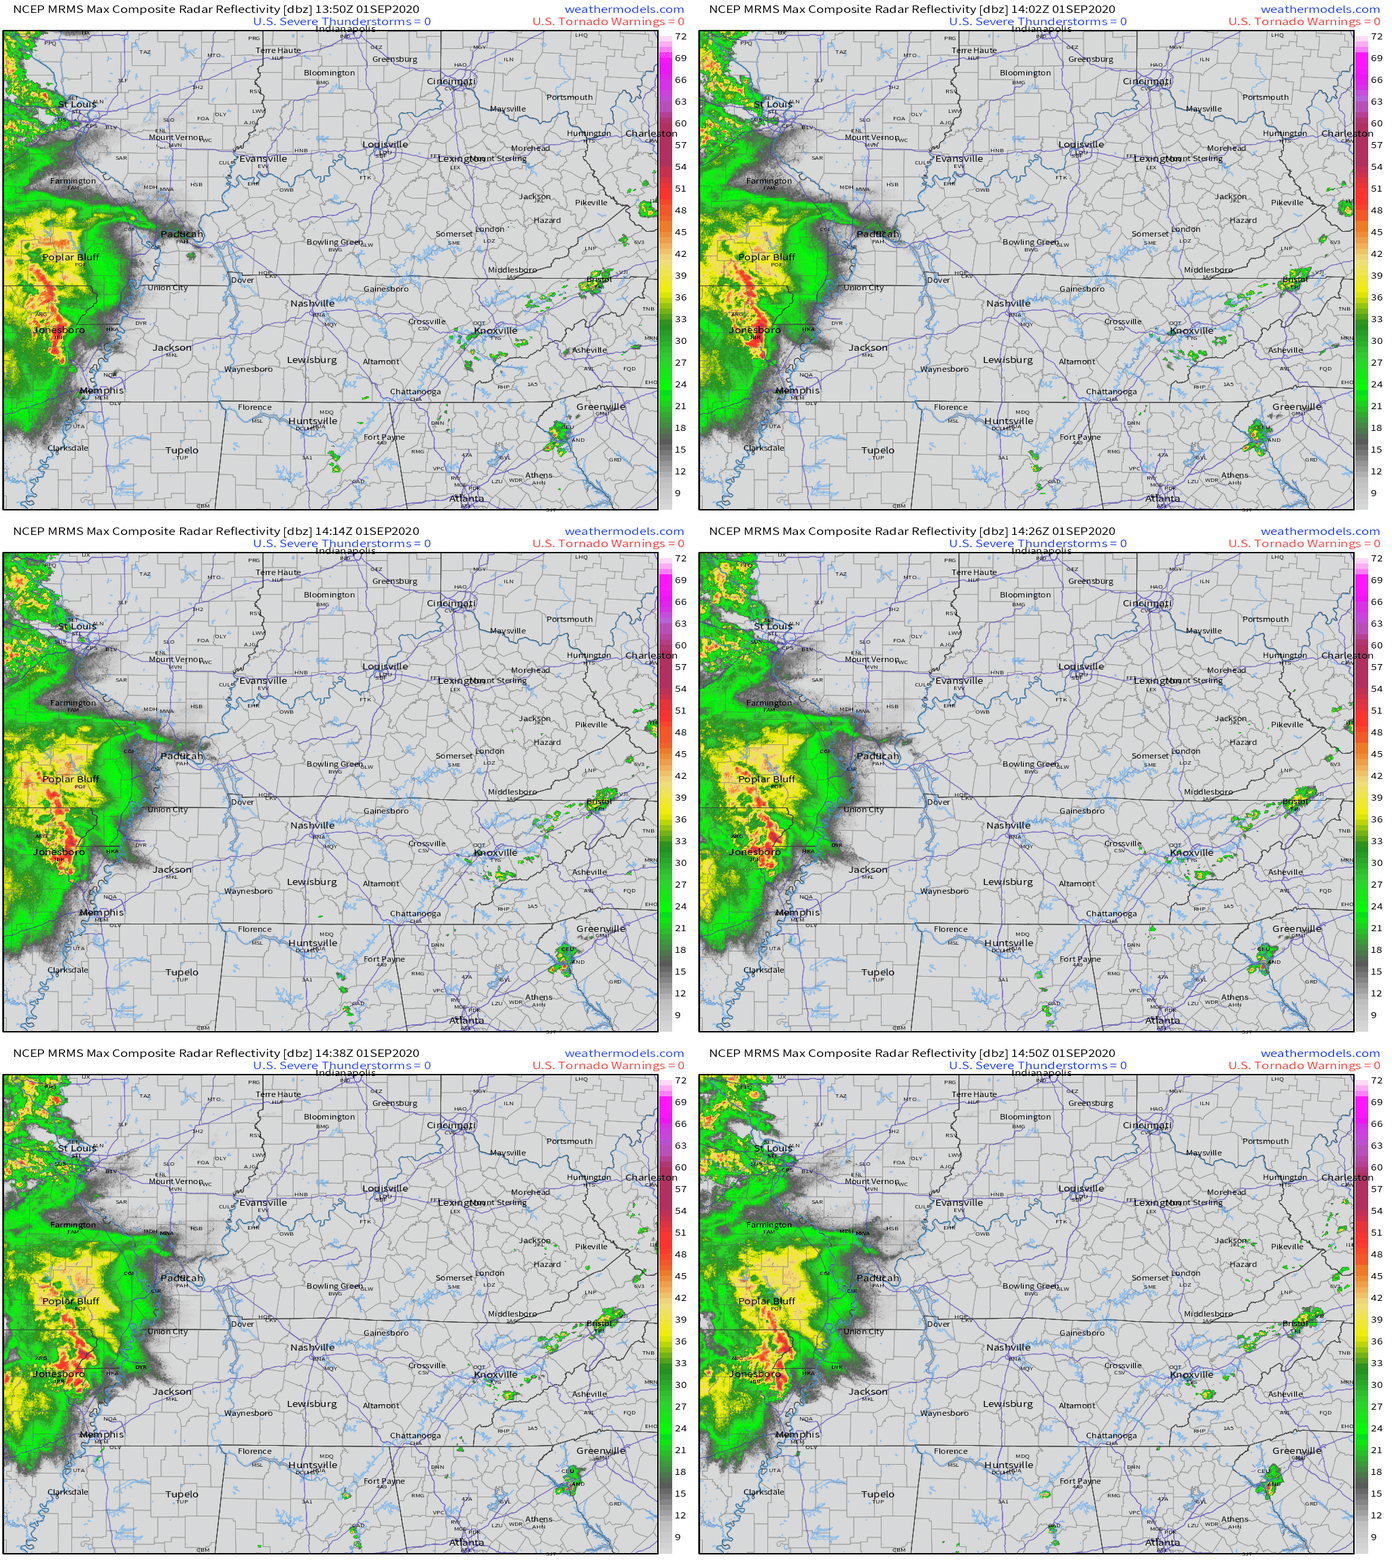
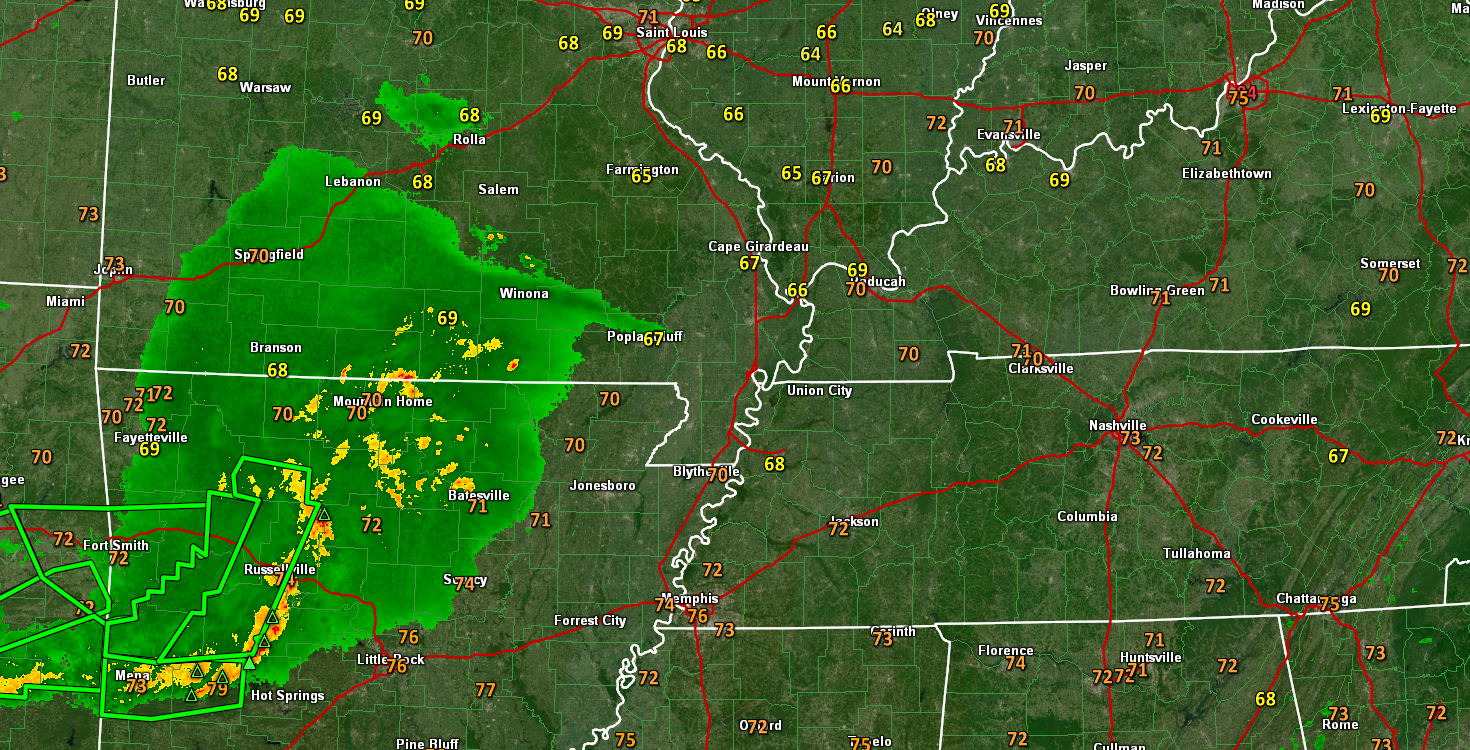
You can see that rain moving in from the SW on this static radar image from 6 AM.
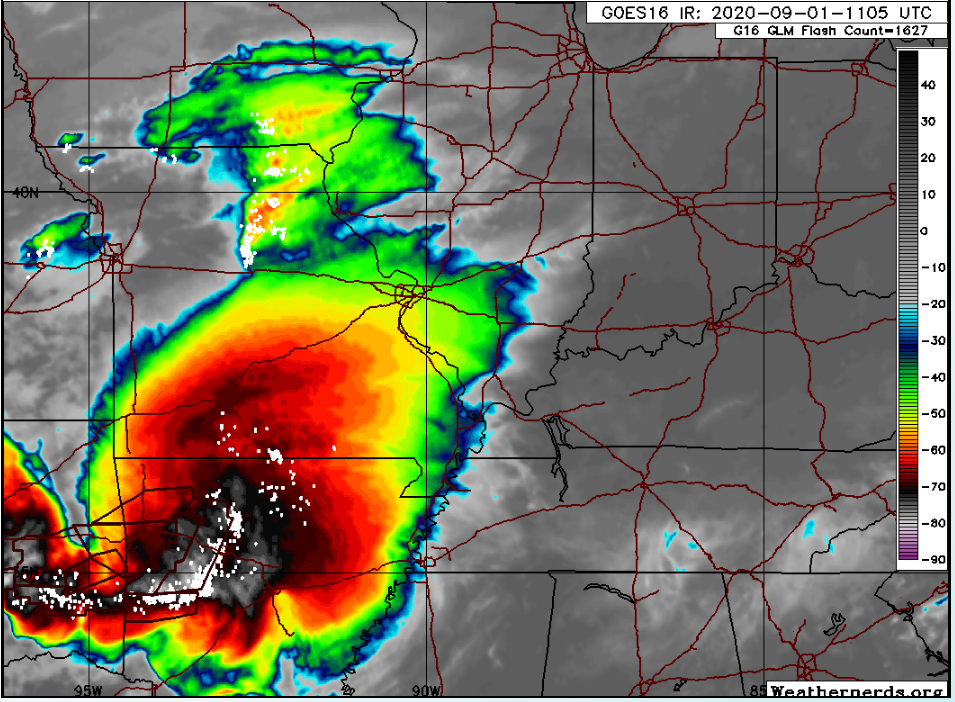
And Satellite shows a lot of red. Those are cold cloud tops. Cold cloud tops represent thunderstorms.
The little white specks would be lightning. This is a 6:30 AM satellite image. That complex of storms will move into our region later today.
.
PWAT values today into tomorrow will be 2 to 3 standard deviations above normal.
.
That means thunderstorms can produce one to two inches of rain in less than thirty minutes. If storms train over a particular area then they could easily receive one to three inches of rain (if not more). This could cause some flash flooding.
Flash flooding warnings will be possible today into tomorrow. Avoid flooded roadways, as always.
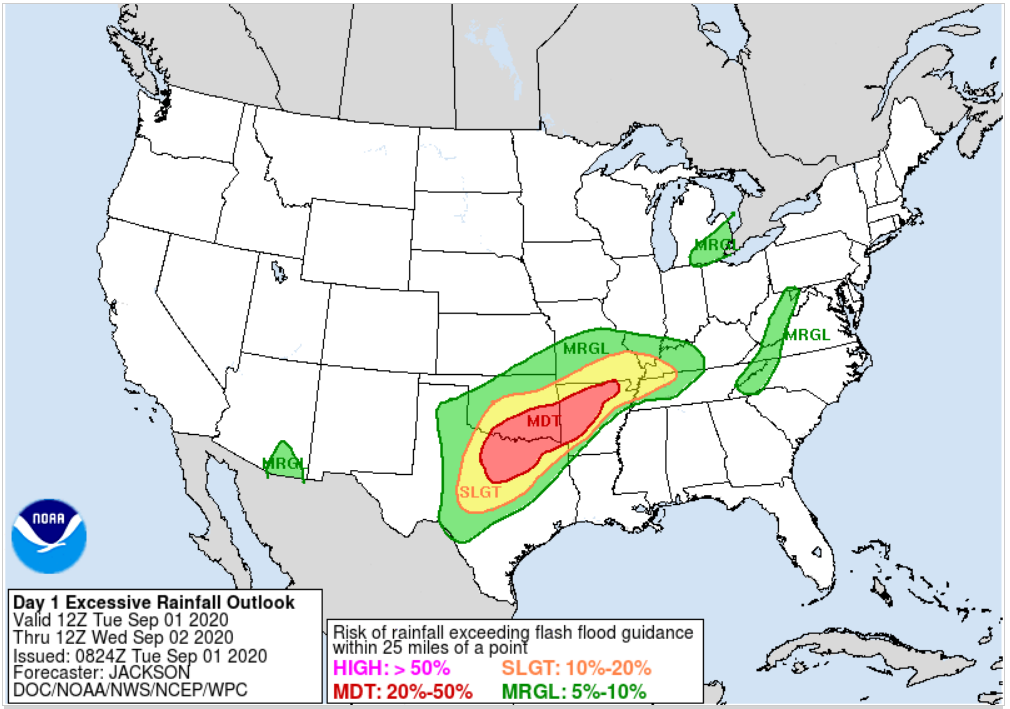
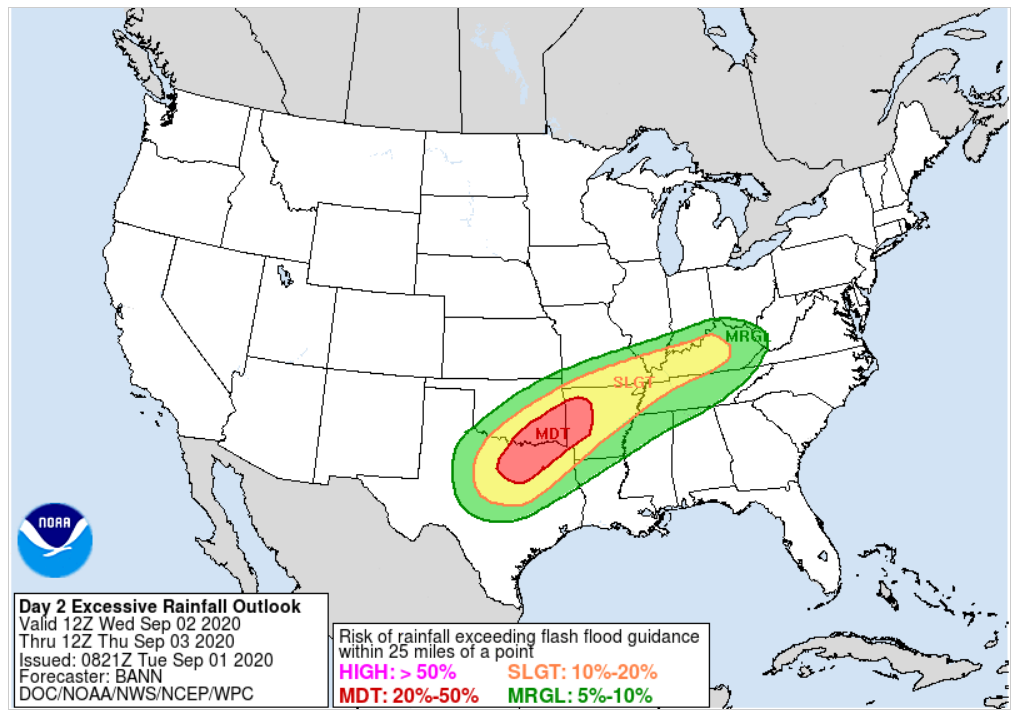
The WPC/NOAA has placed our region in a risk of flash flooding. A level two risk.
And tomorrow
.
Some of the thunderstorms could also produce wind damage and even a tornado later today. The tornado risk is non-zero. Meaning, it is a low risk but not a zero risk.
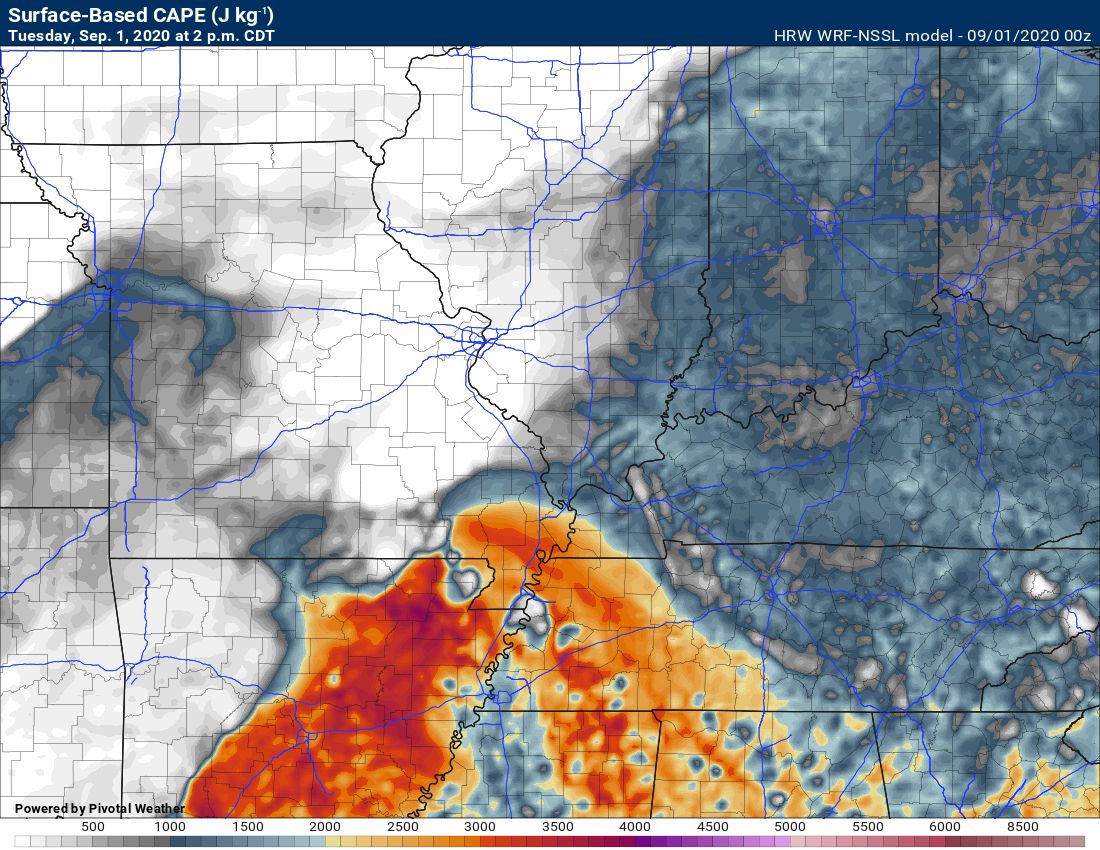
There is some wind shear to work with today. There is instability to work with today.
.
Be sure and make sure you are signed into your Beau Dodson Weather app. I will be sending out messages as needed.
The on and off shower and thunderstorm chances will continue into Thursday night. Additional heavy rain is certainly possible during that time.
We don’t need this much rain but it appears we have no choice in the matter. There will be some very wet fields.
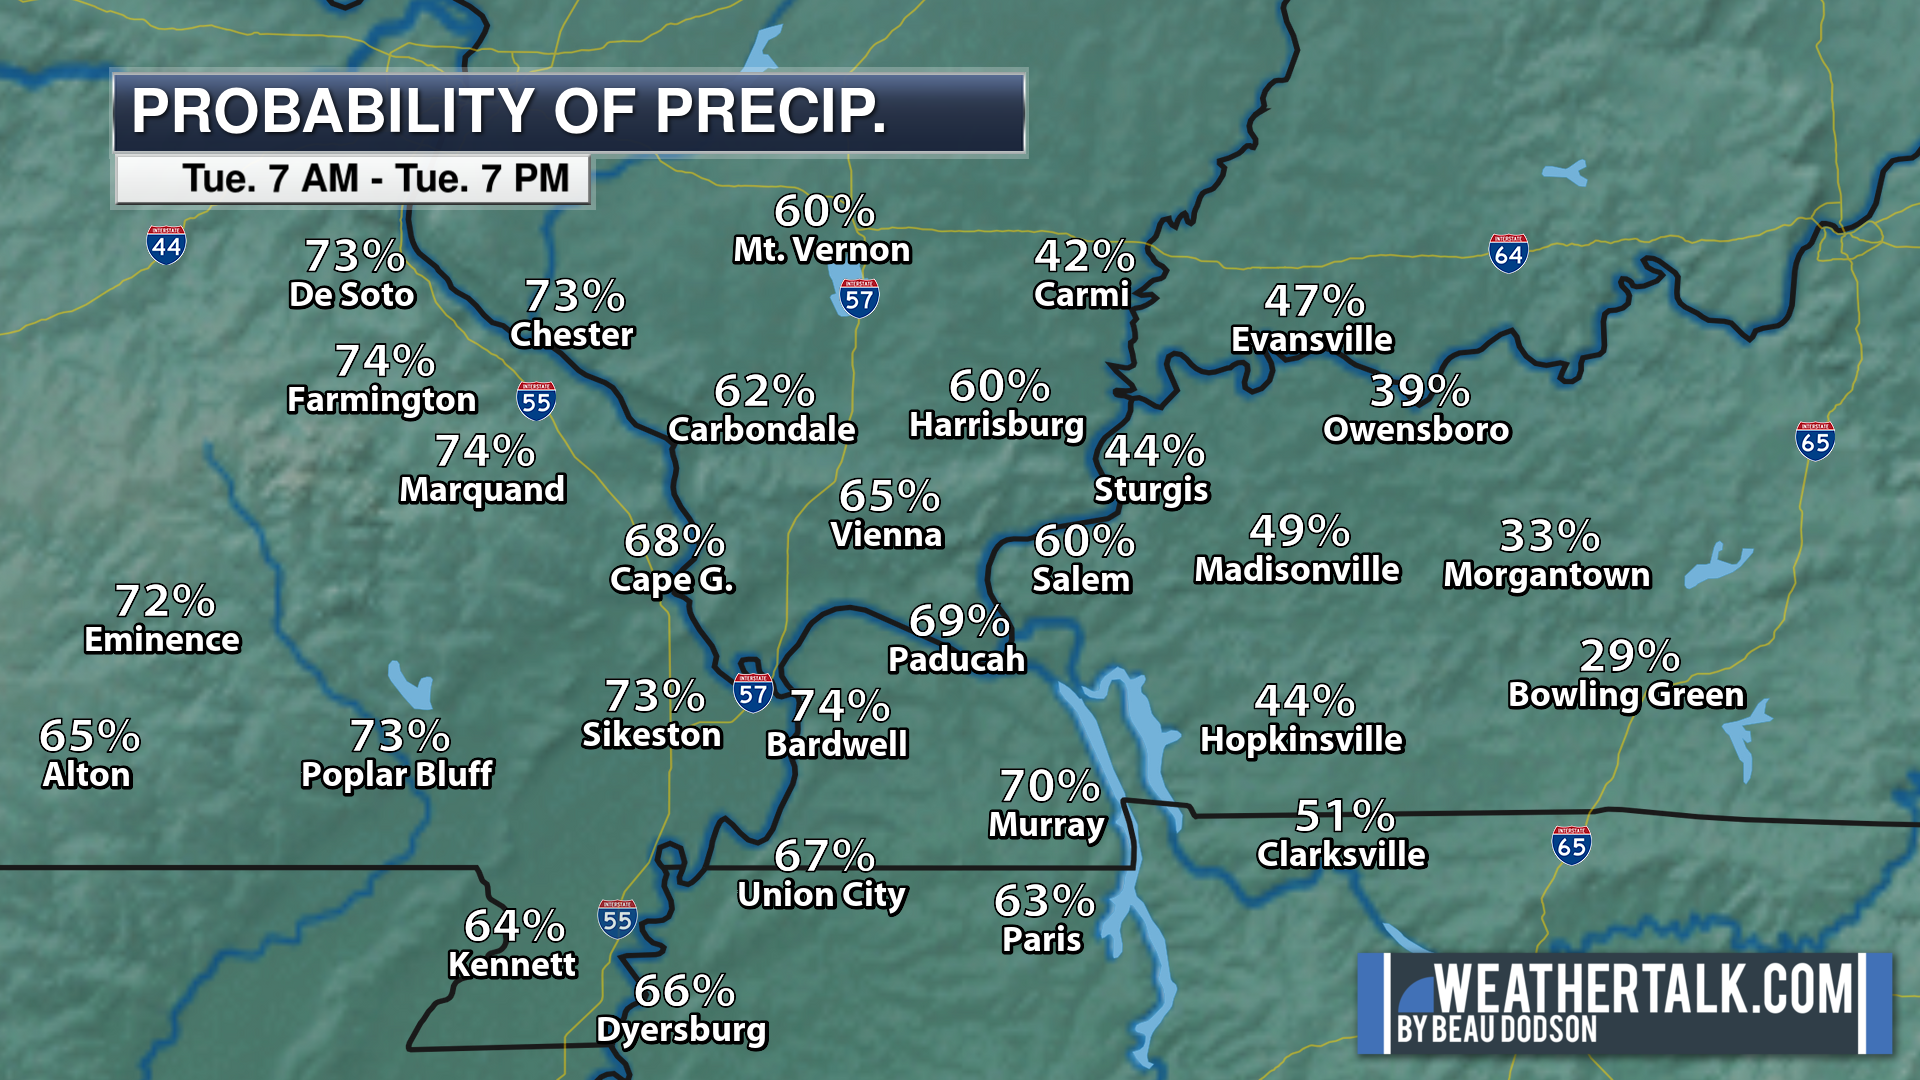
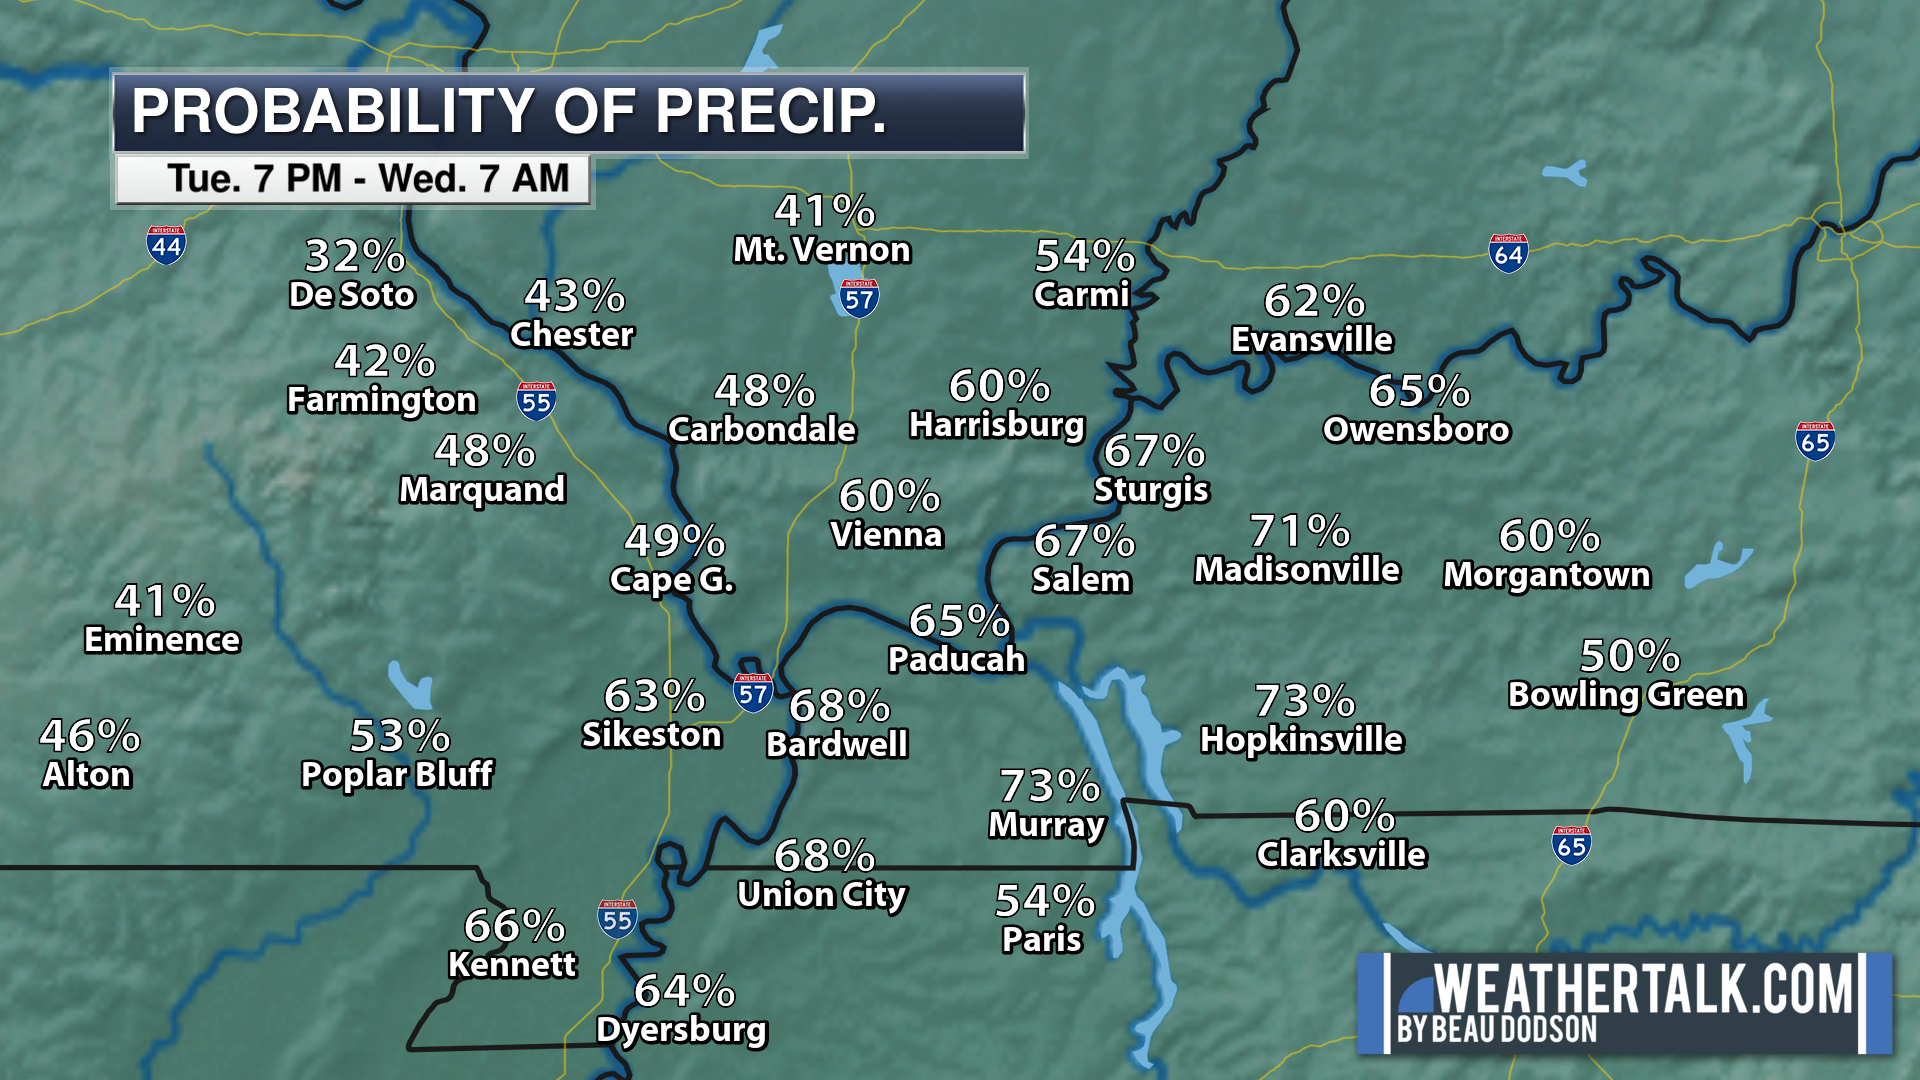
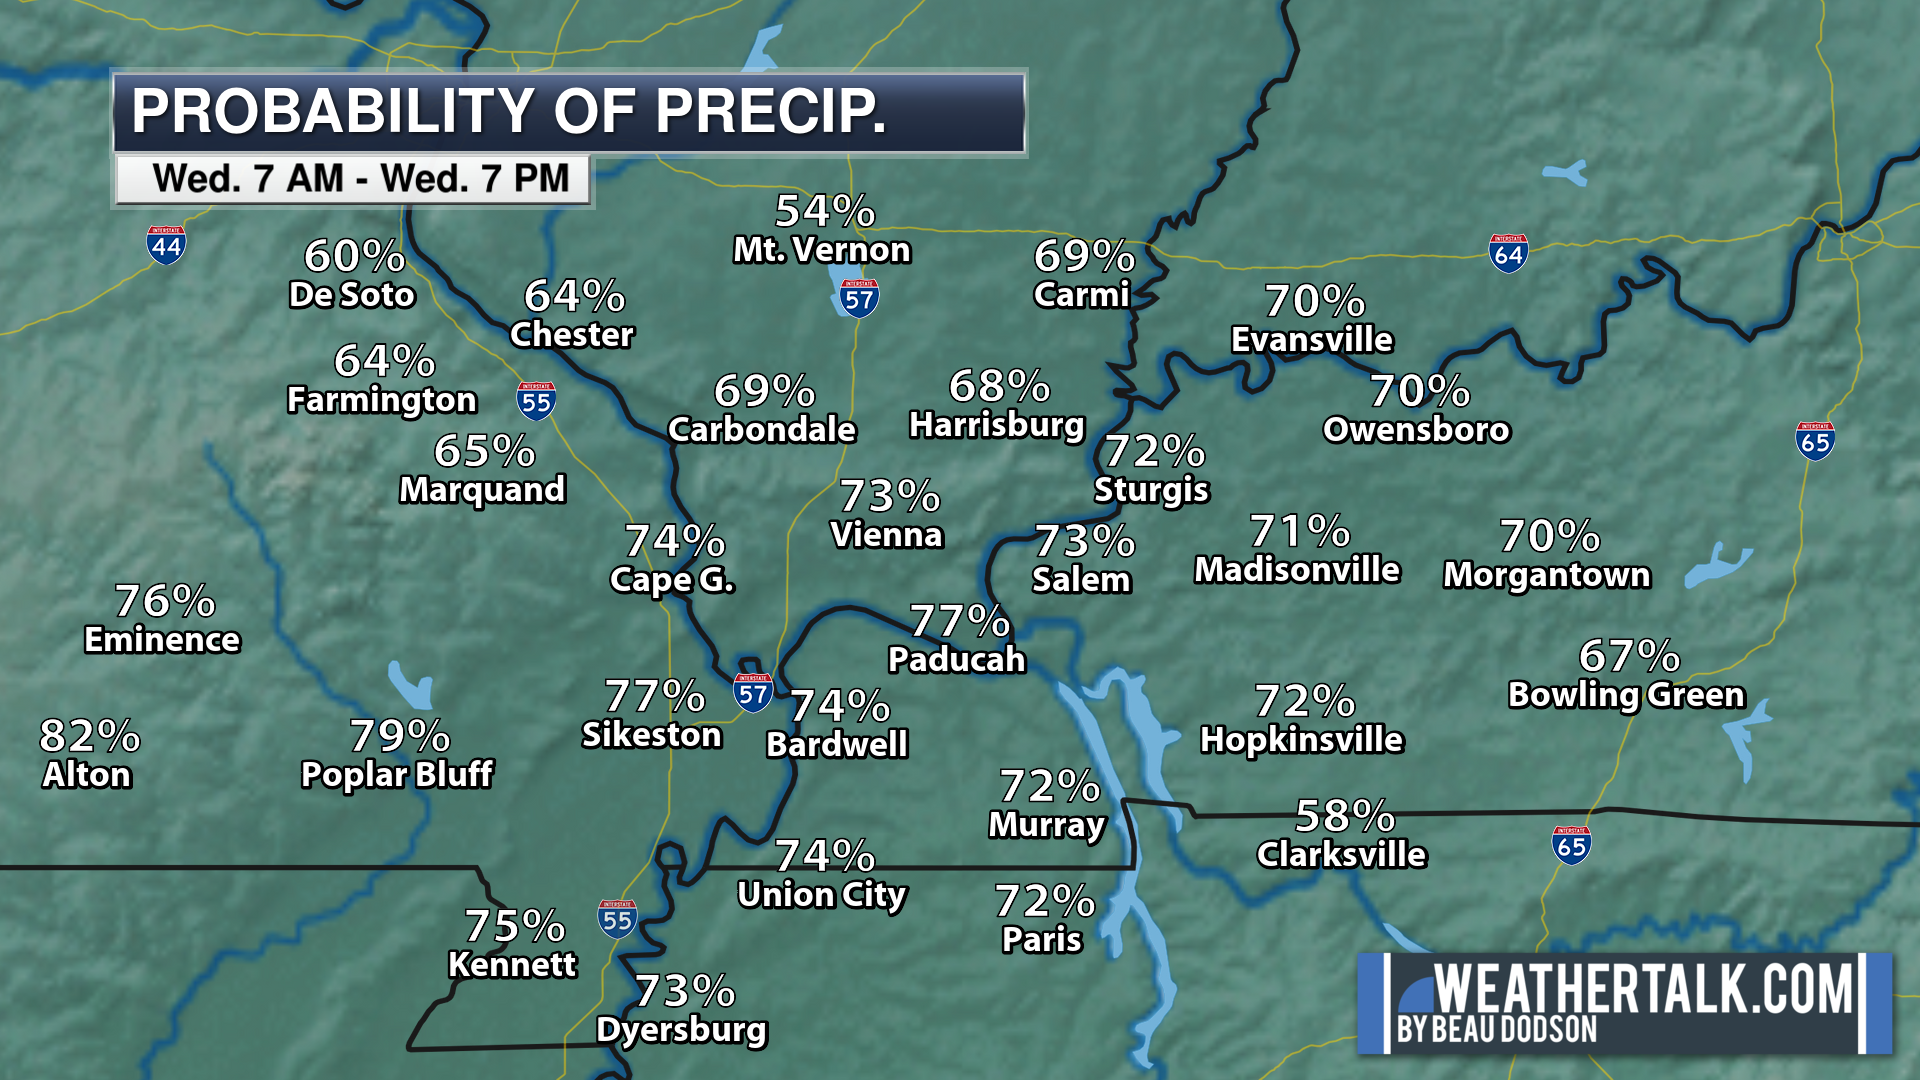
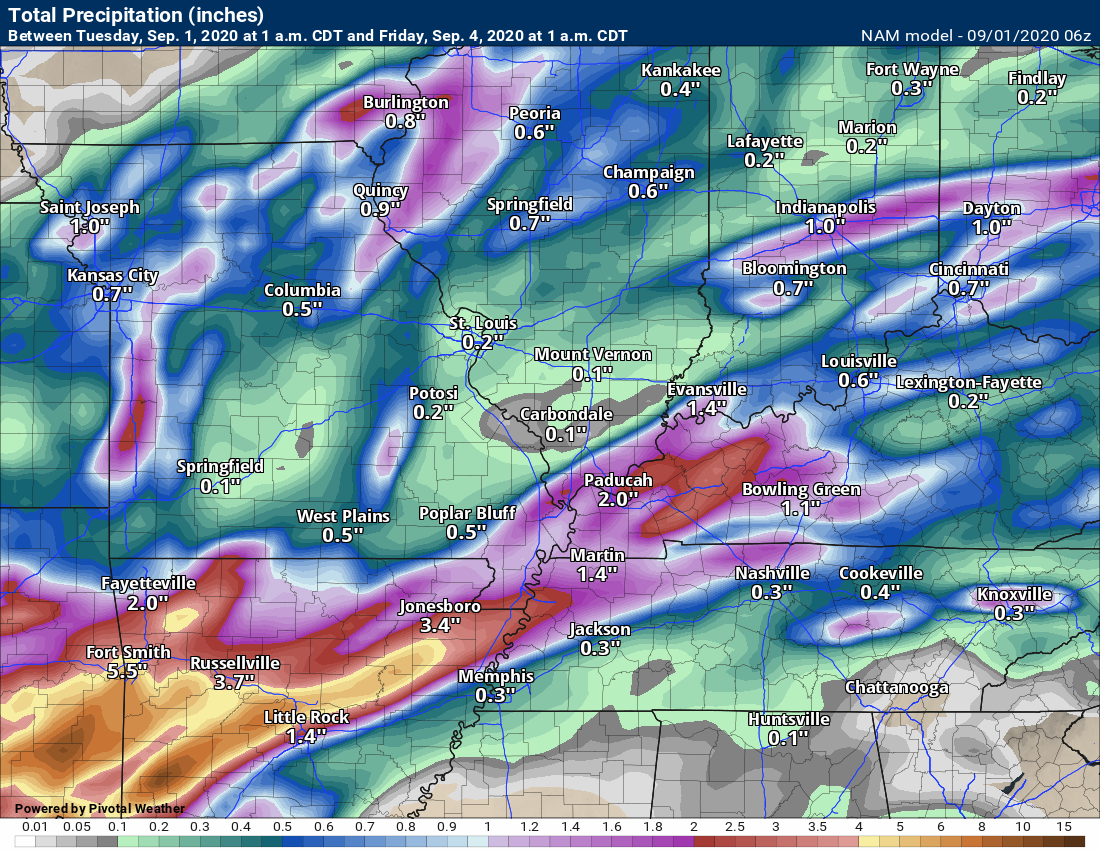
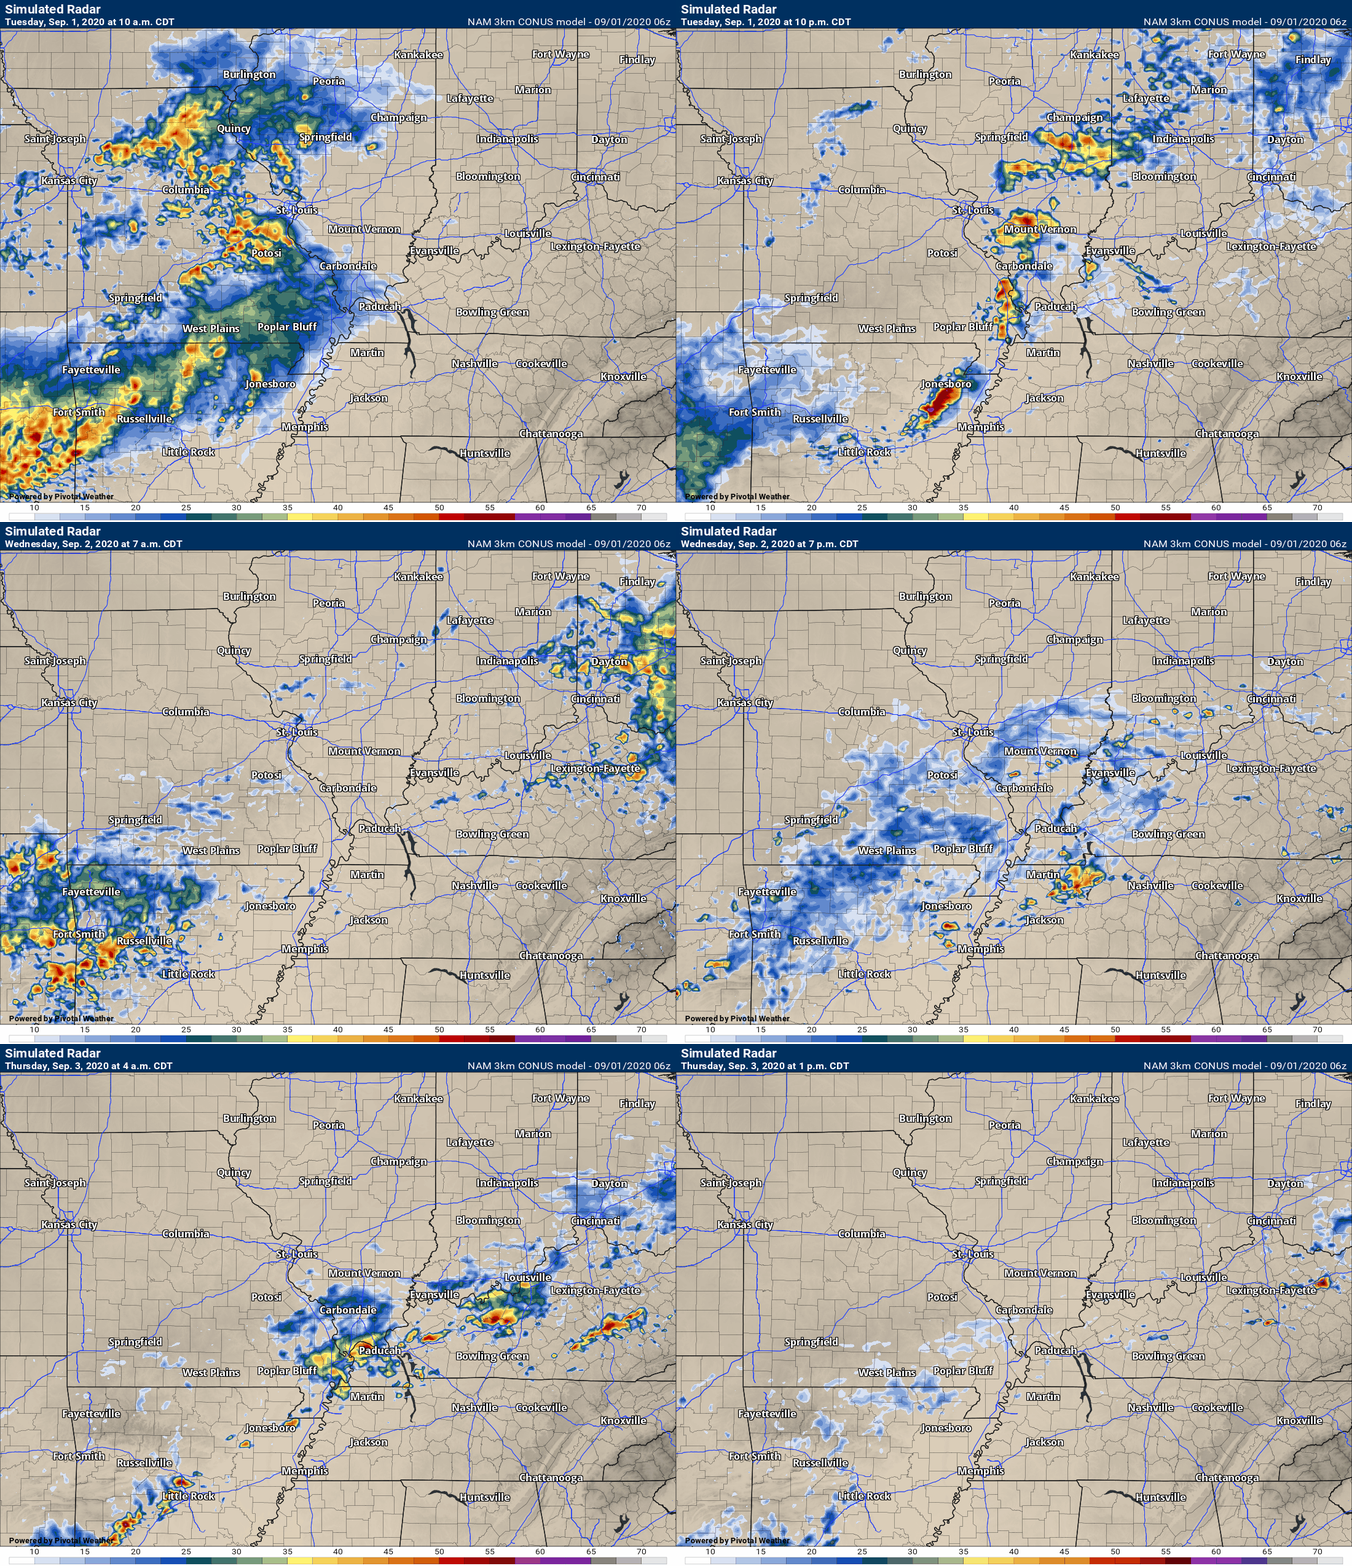
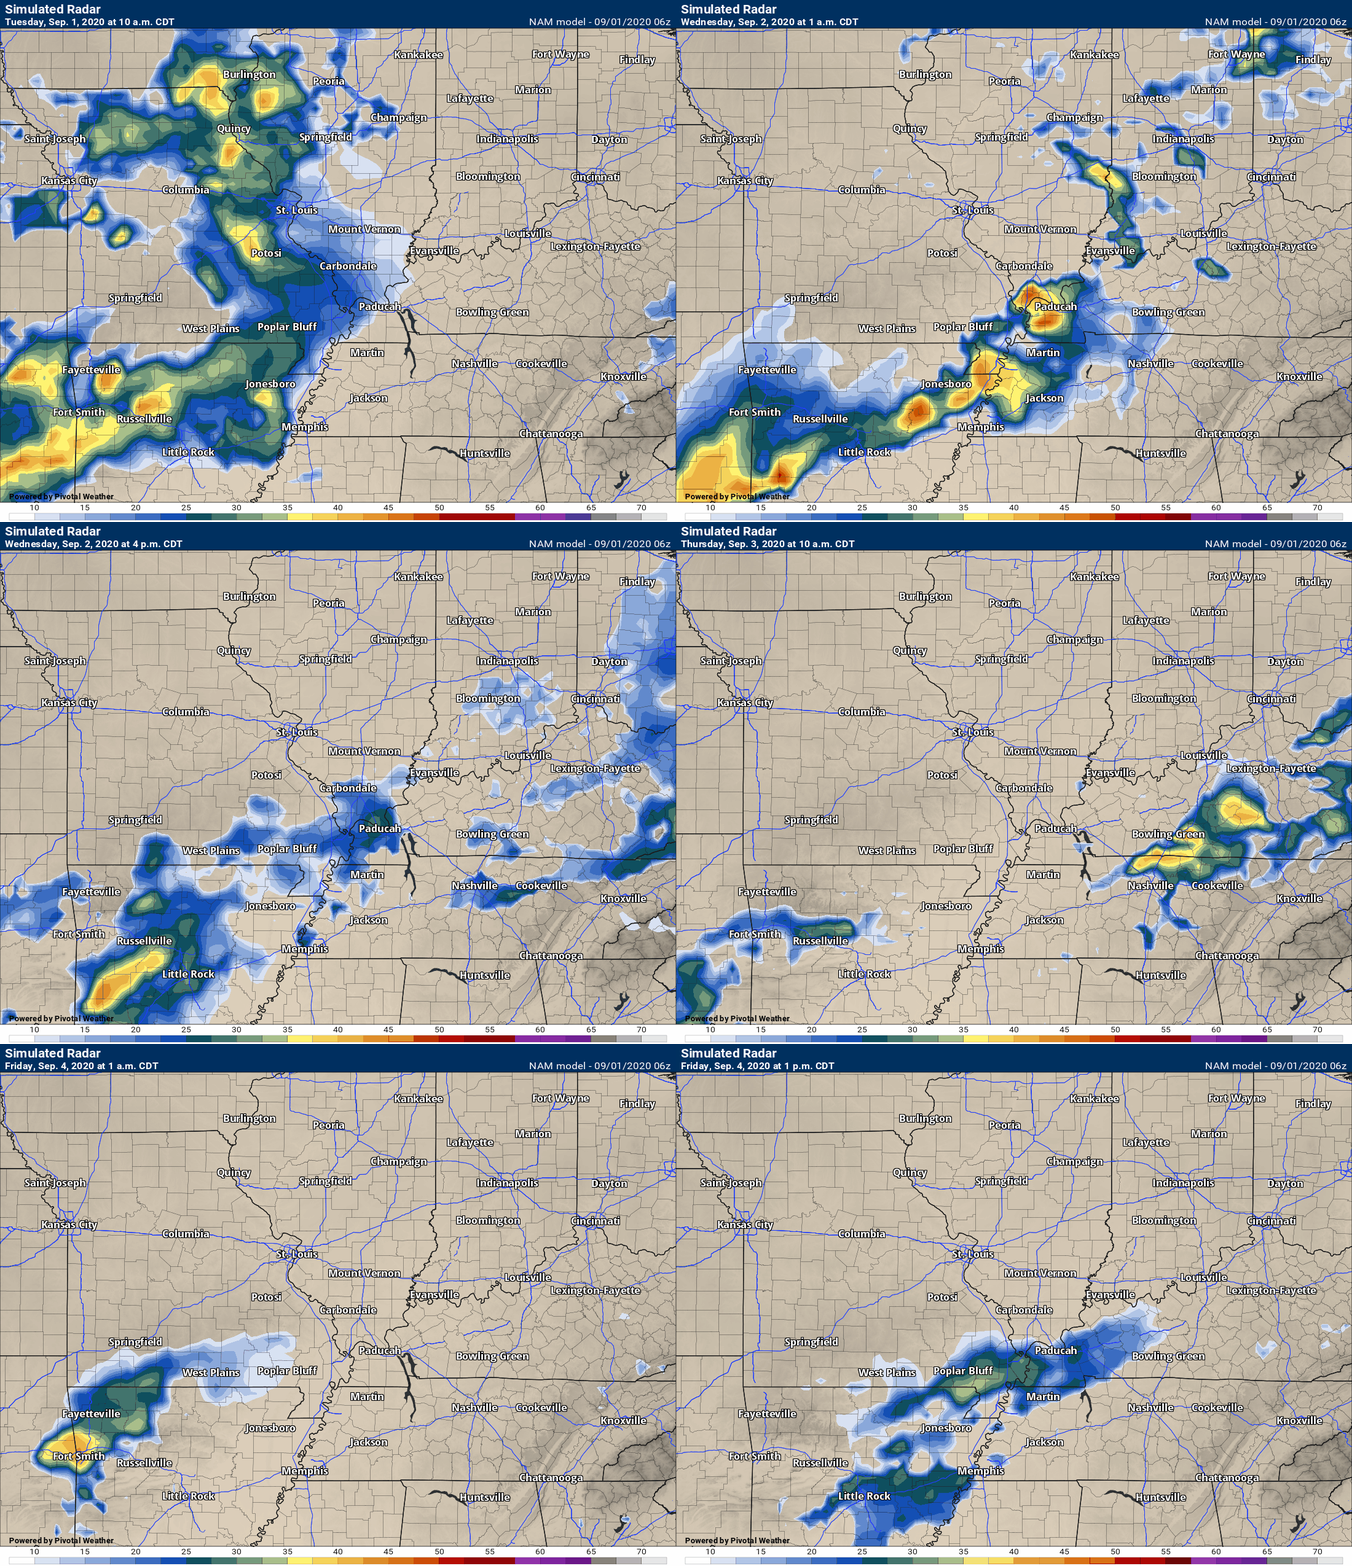
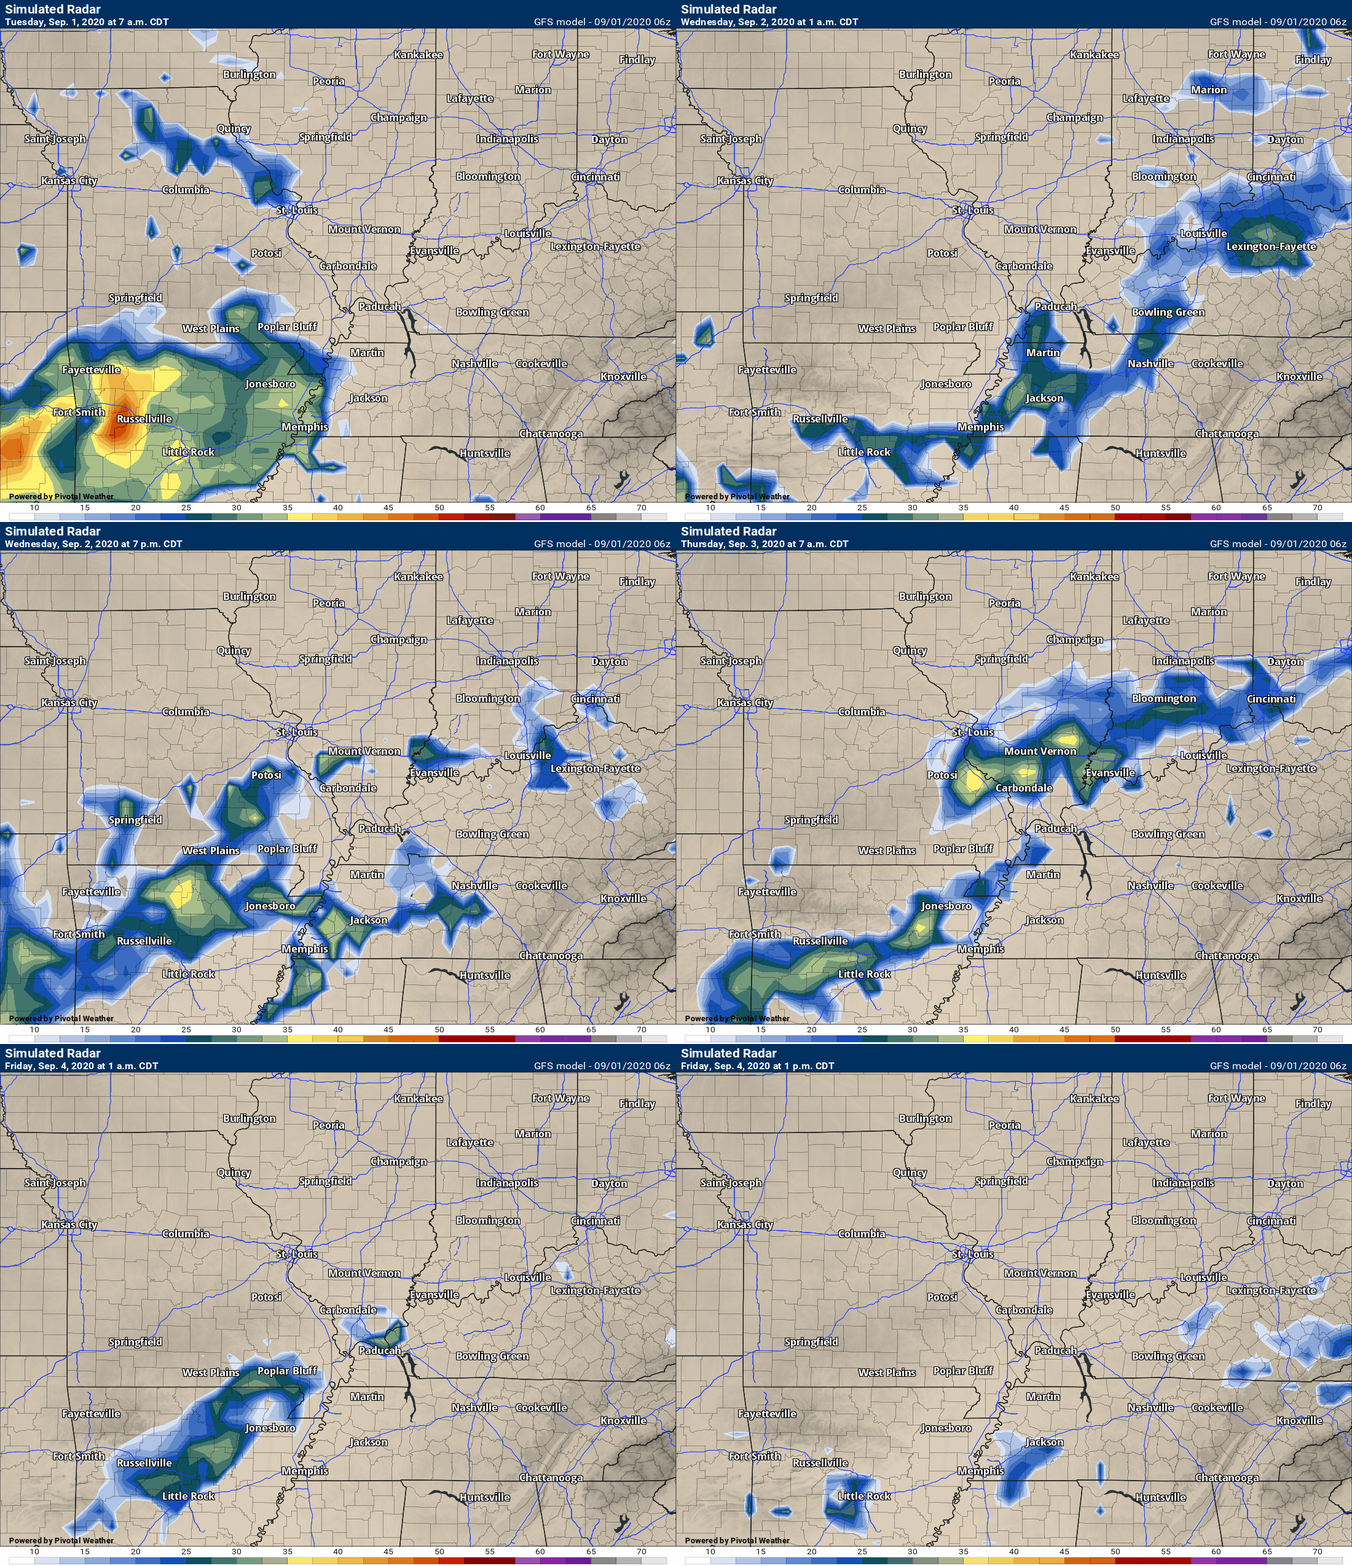
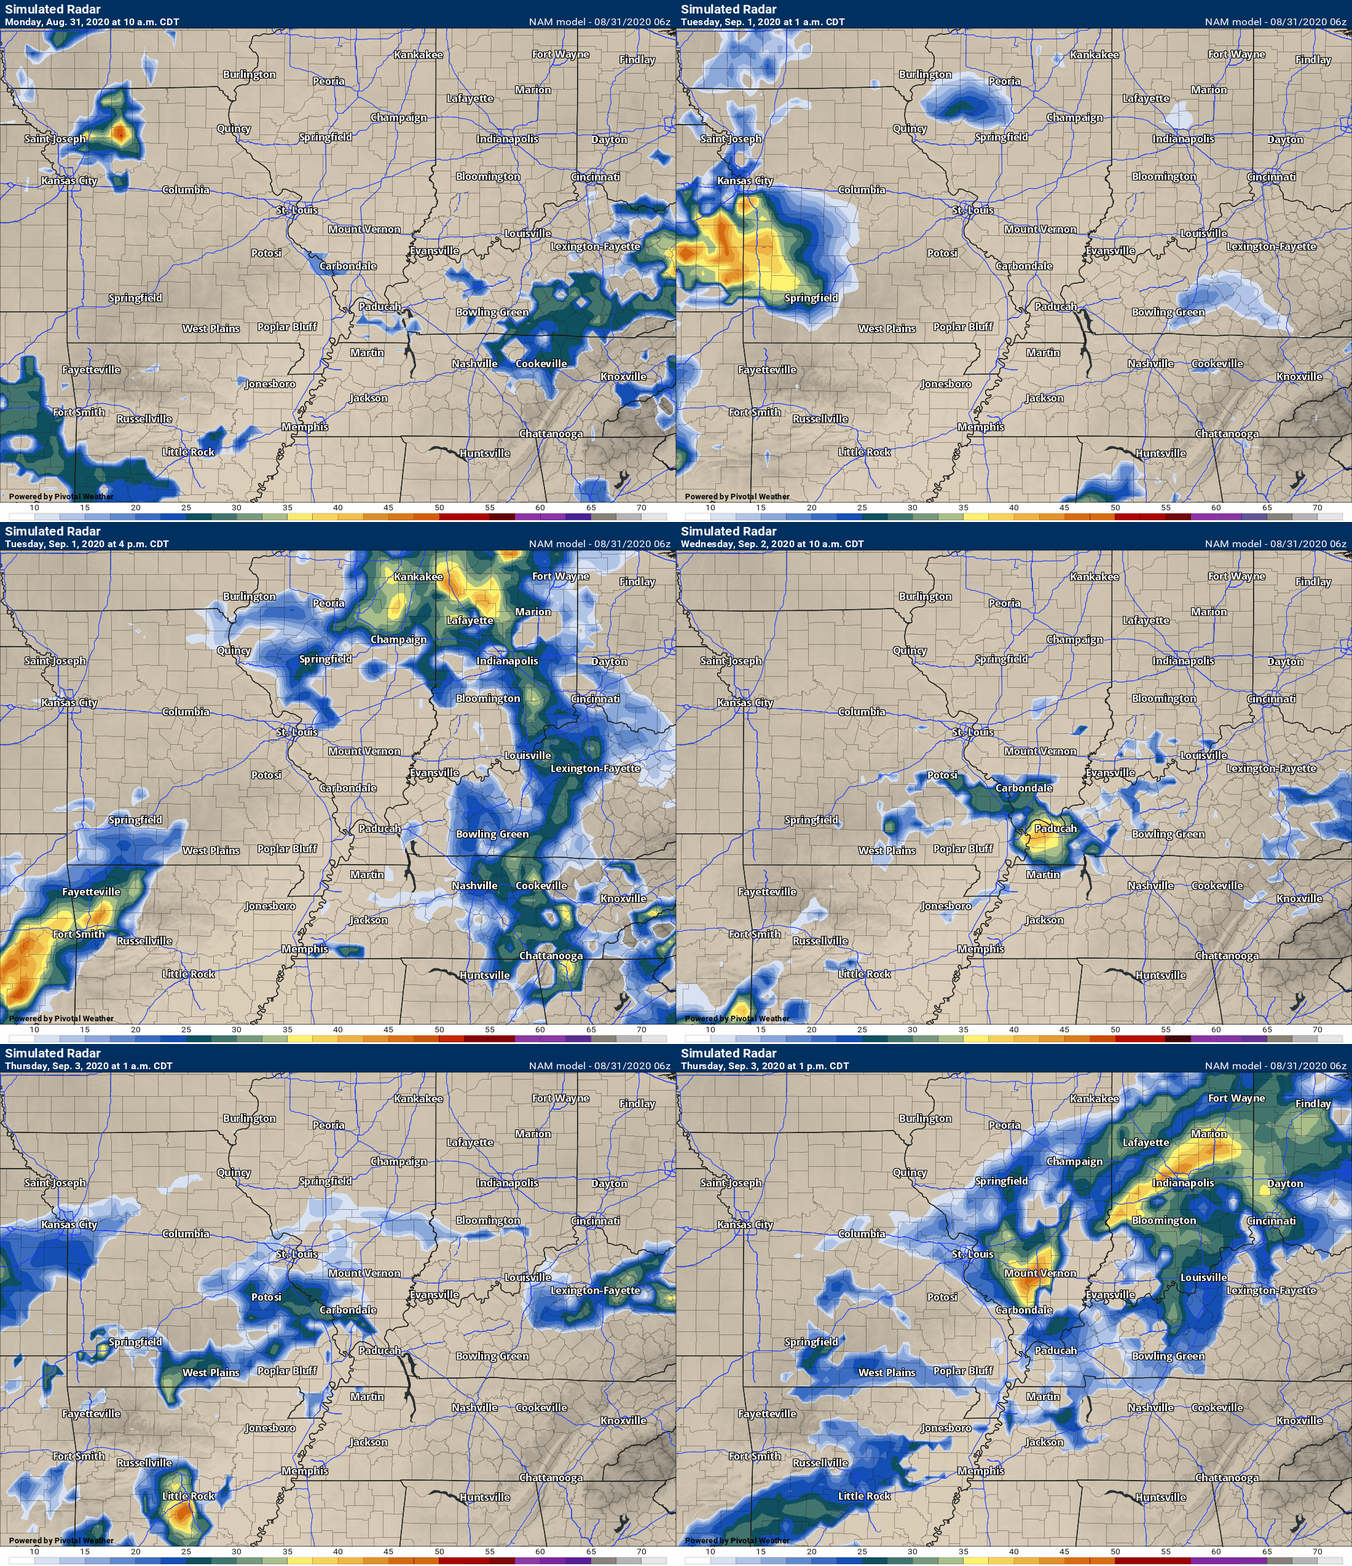
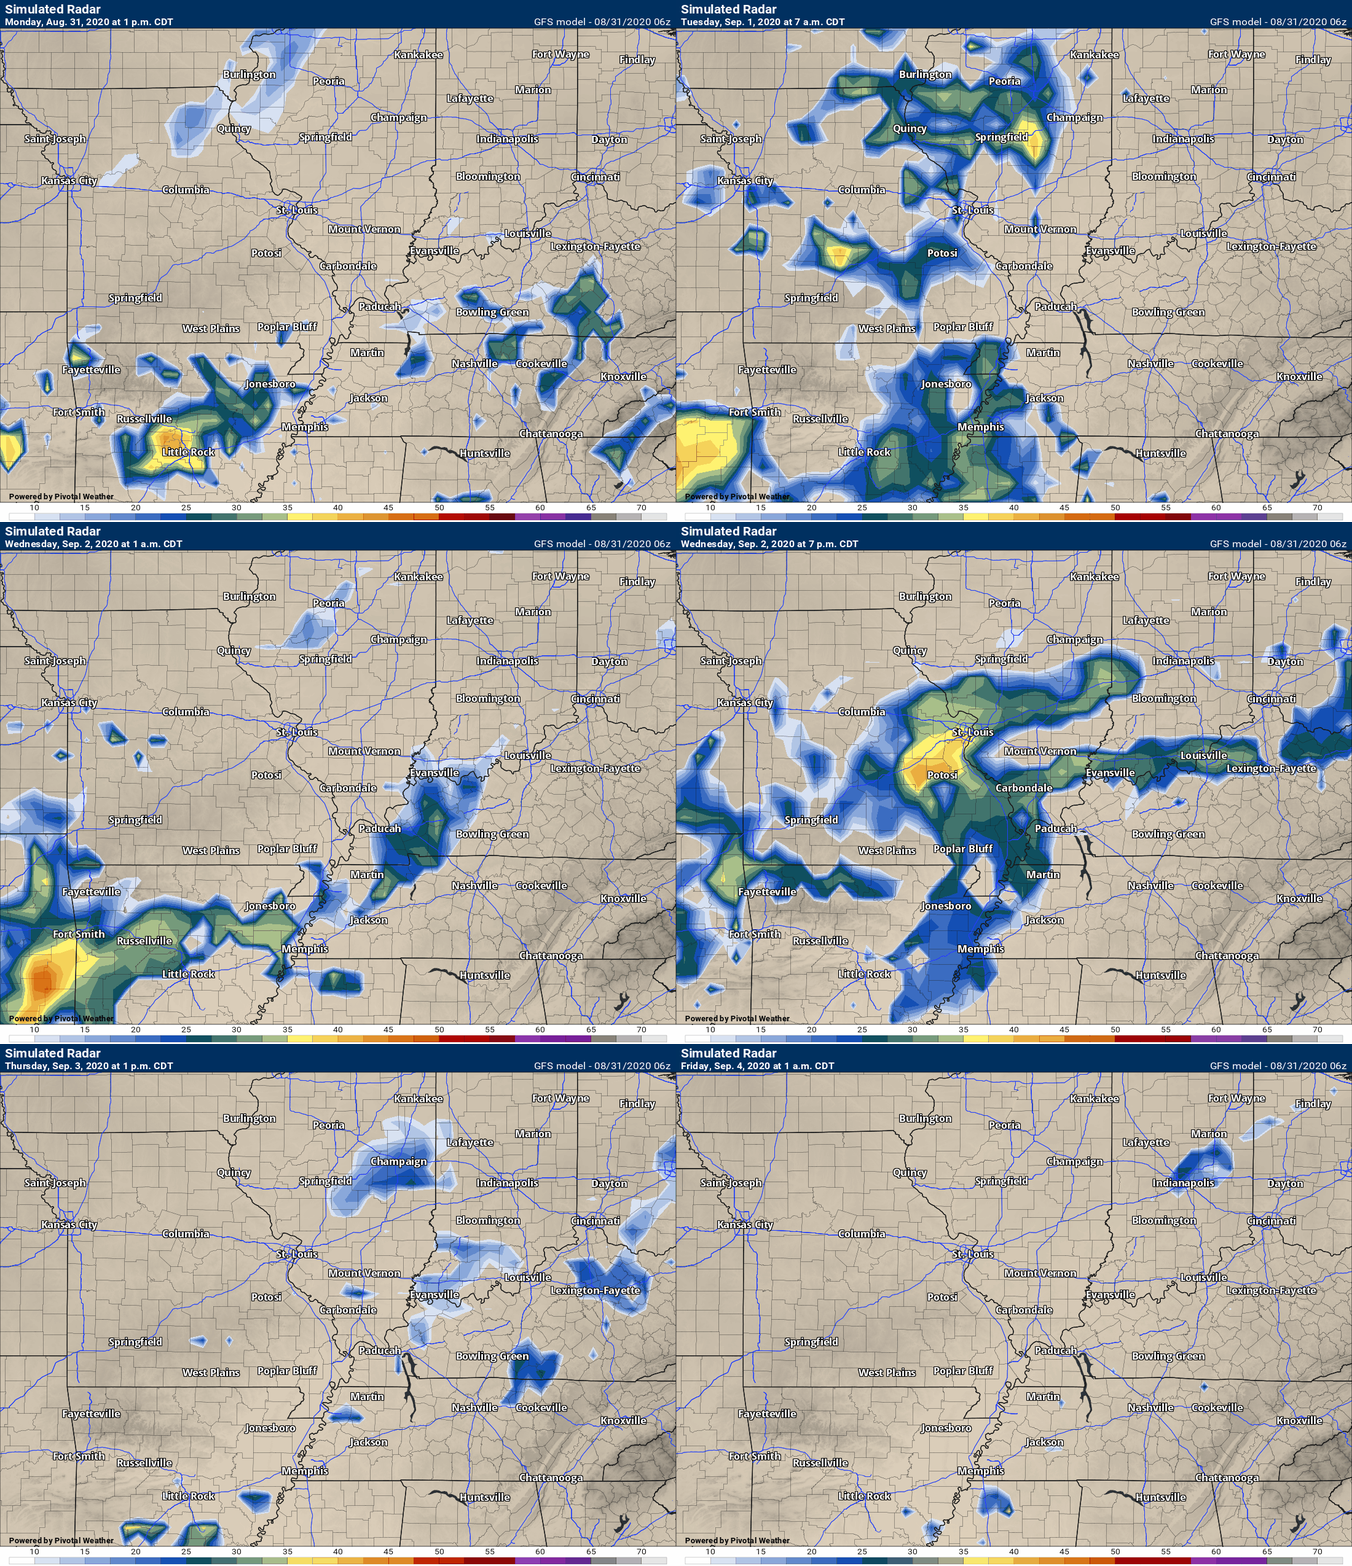
Let me show you what one model has for rain chances over the coming two days. This just gives you an idea.
.
As always, during the summer, rain totals will vary GREATLY.
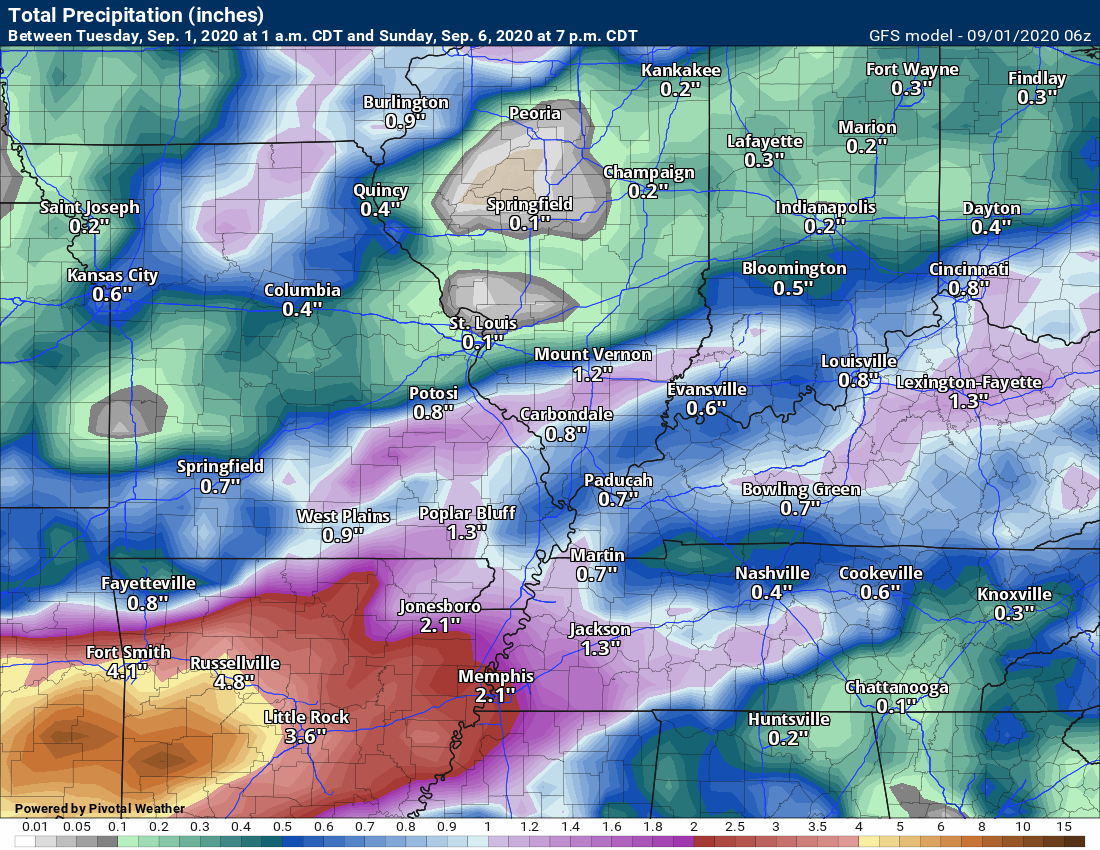
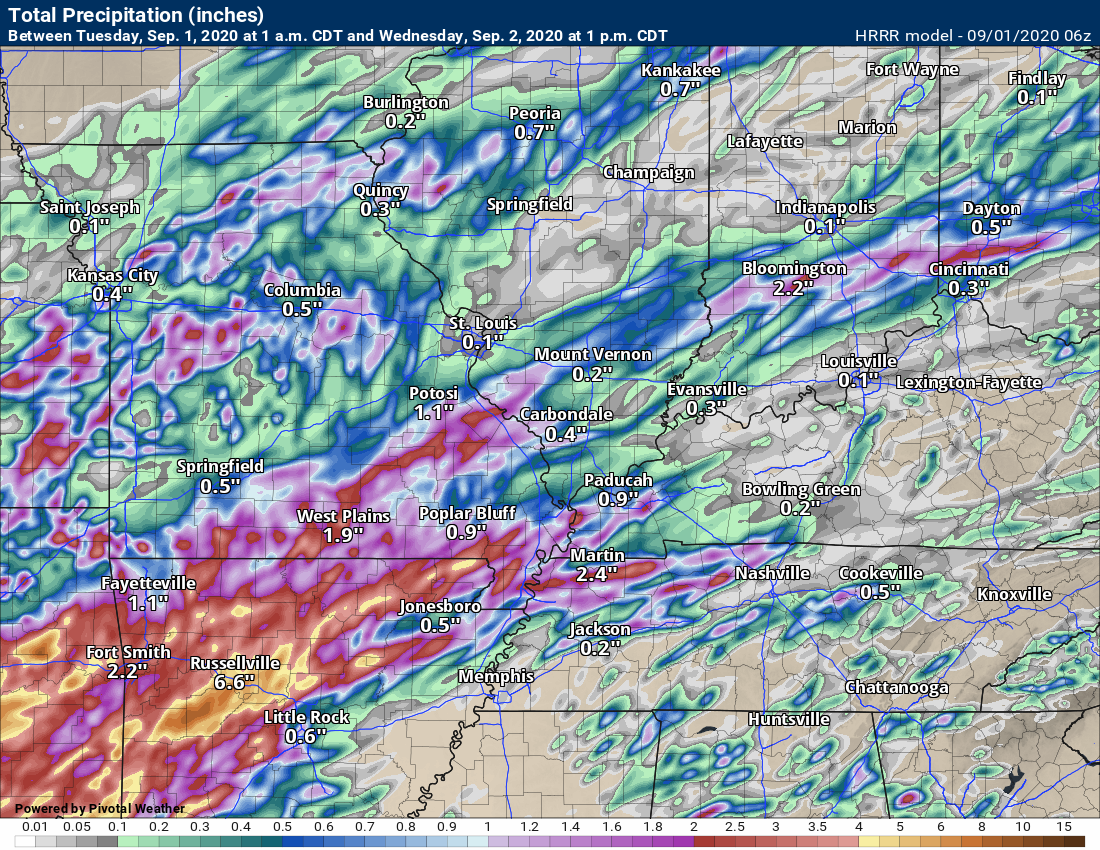
Here are four models and their predictions on rain totals. You can see the wide range.
Models don’t do well with handling training thunderstorms.
GFS model through Thursday.
NAM 3K model through 1 PM Thursday
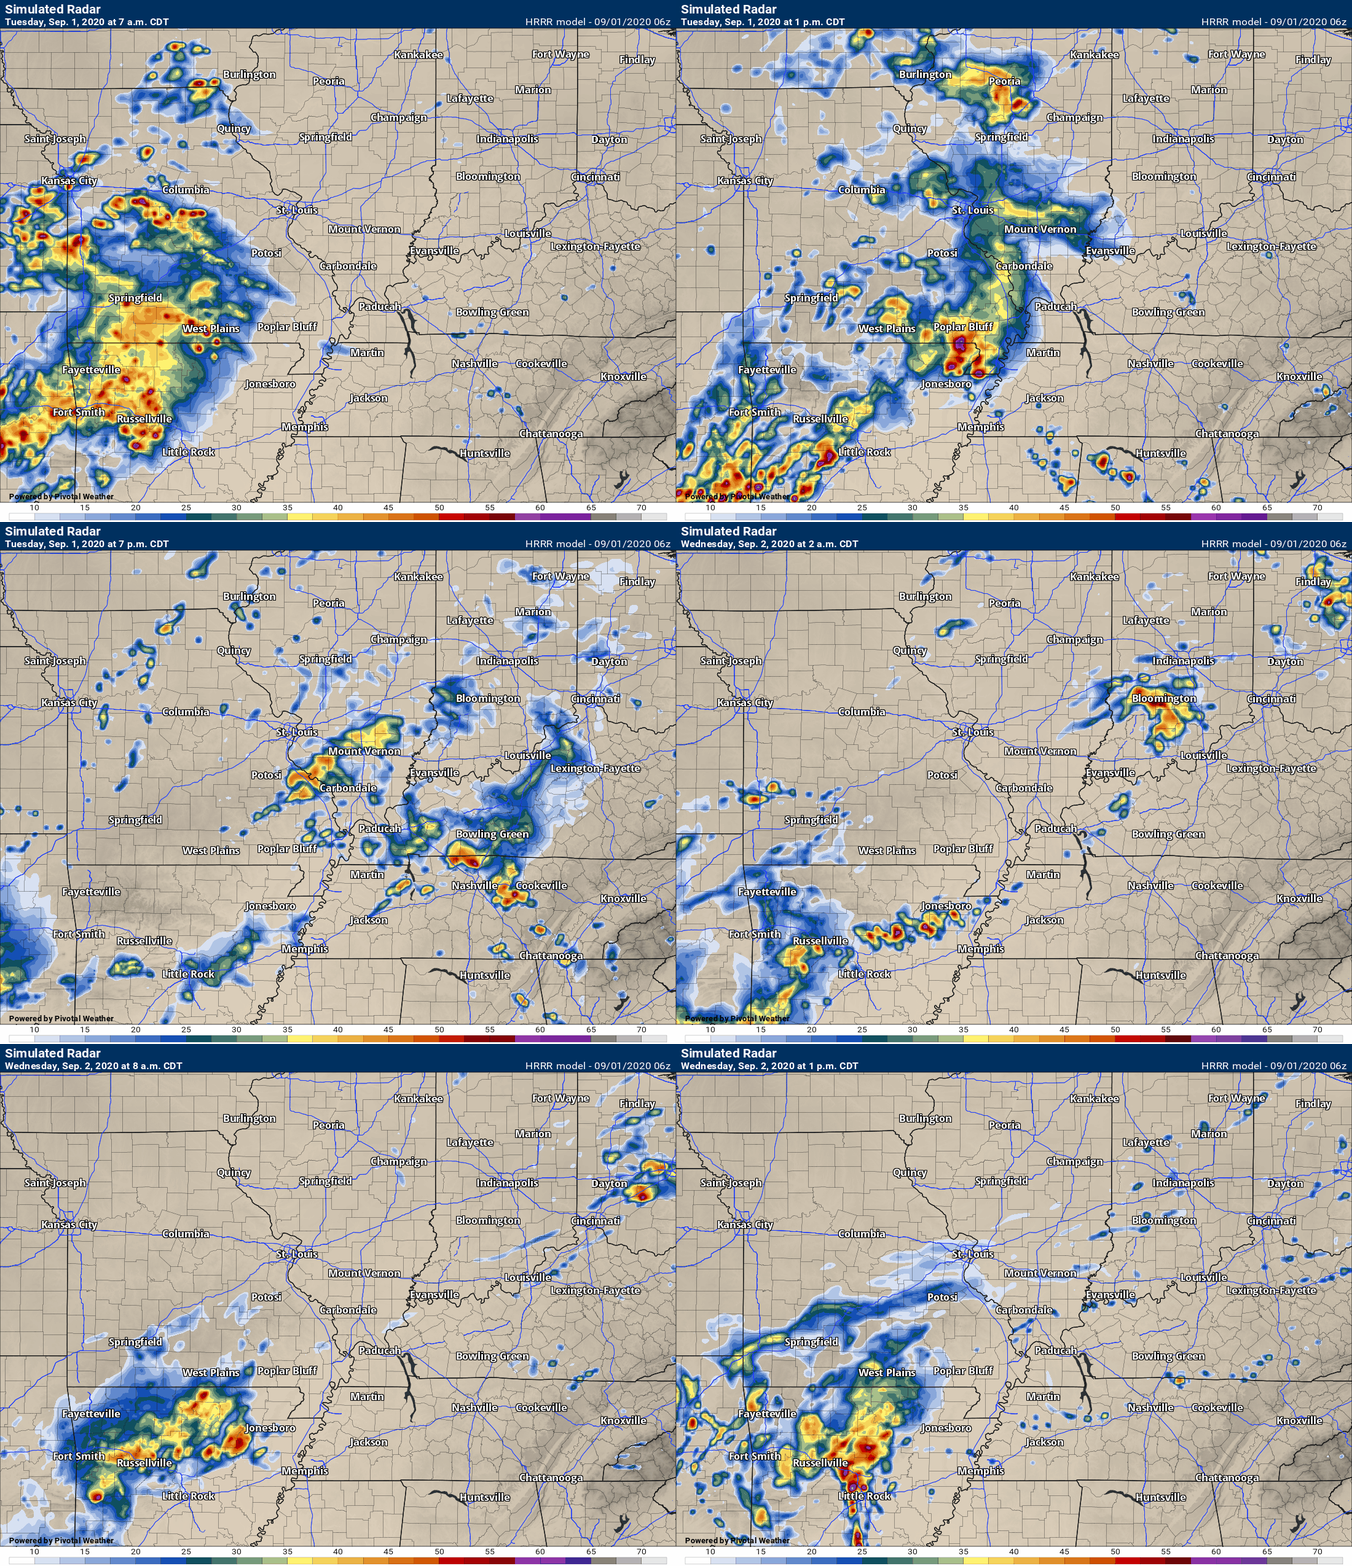
Hrrr model only goes through Wednesday at 1 PM
The NAM model through Thursday
.
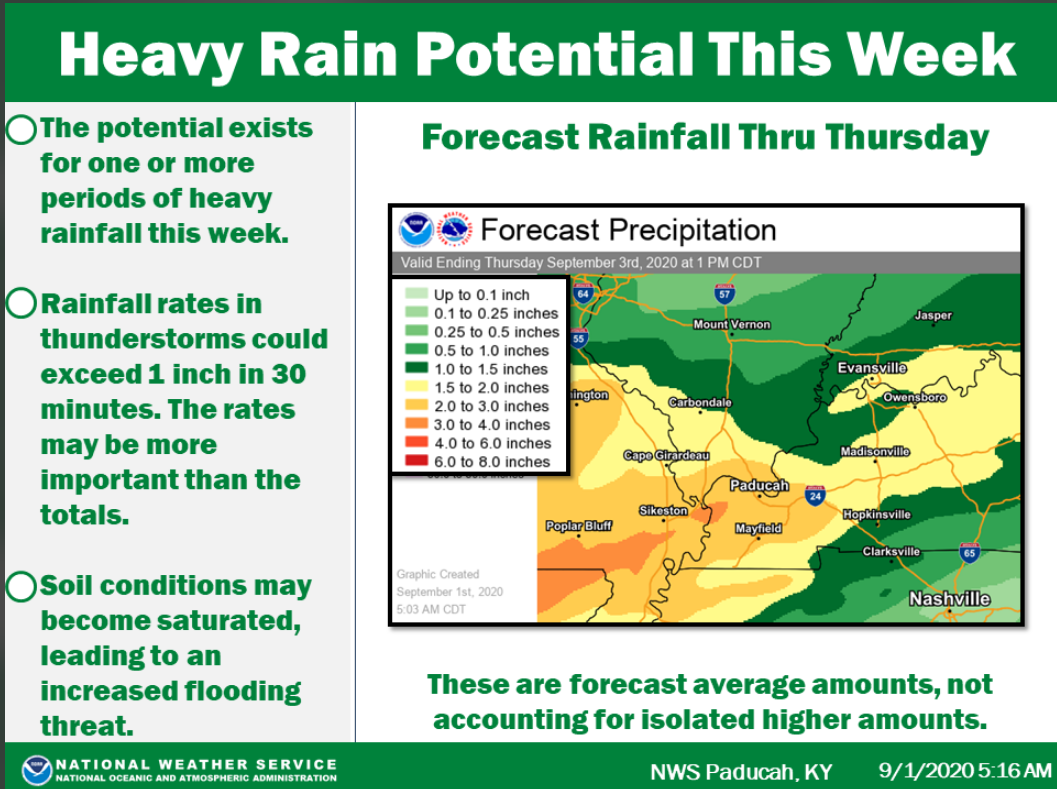
And the NWS posted this graphic.
 .
.
Click here if you would like to return to the top of the page.
Again, as a reminder, these are models. They are never 100% accurate. Take the general idea from them.
What should I take from these?
- The general idea and not specifics. Models usually do well with the generalities.
- The time-stamp is located in the upper left corner.
.
What am I looking at?
You are looking at different models. Meteorologists use many different models to forecast the weather. All models are wrong. Some are more wrong than others. Meteorologists have to make a forecast based on the guidance/models.
I show you these so you can see what the different models are showing as far as precipitation. If most of the models agree, then the confidence in the final weather forecast increases.
.
This animation is the Hrrr model.
This animation shows you what radar might look like as the next system pulls through the region. It is a future-cast radar.
Green is rain. Blue is snow. Pink and red represent sleet and freezing rain.
Time-stamp upper left. Click the animation to enlarge it.
.
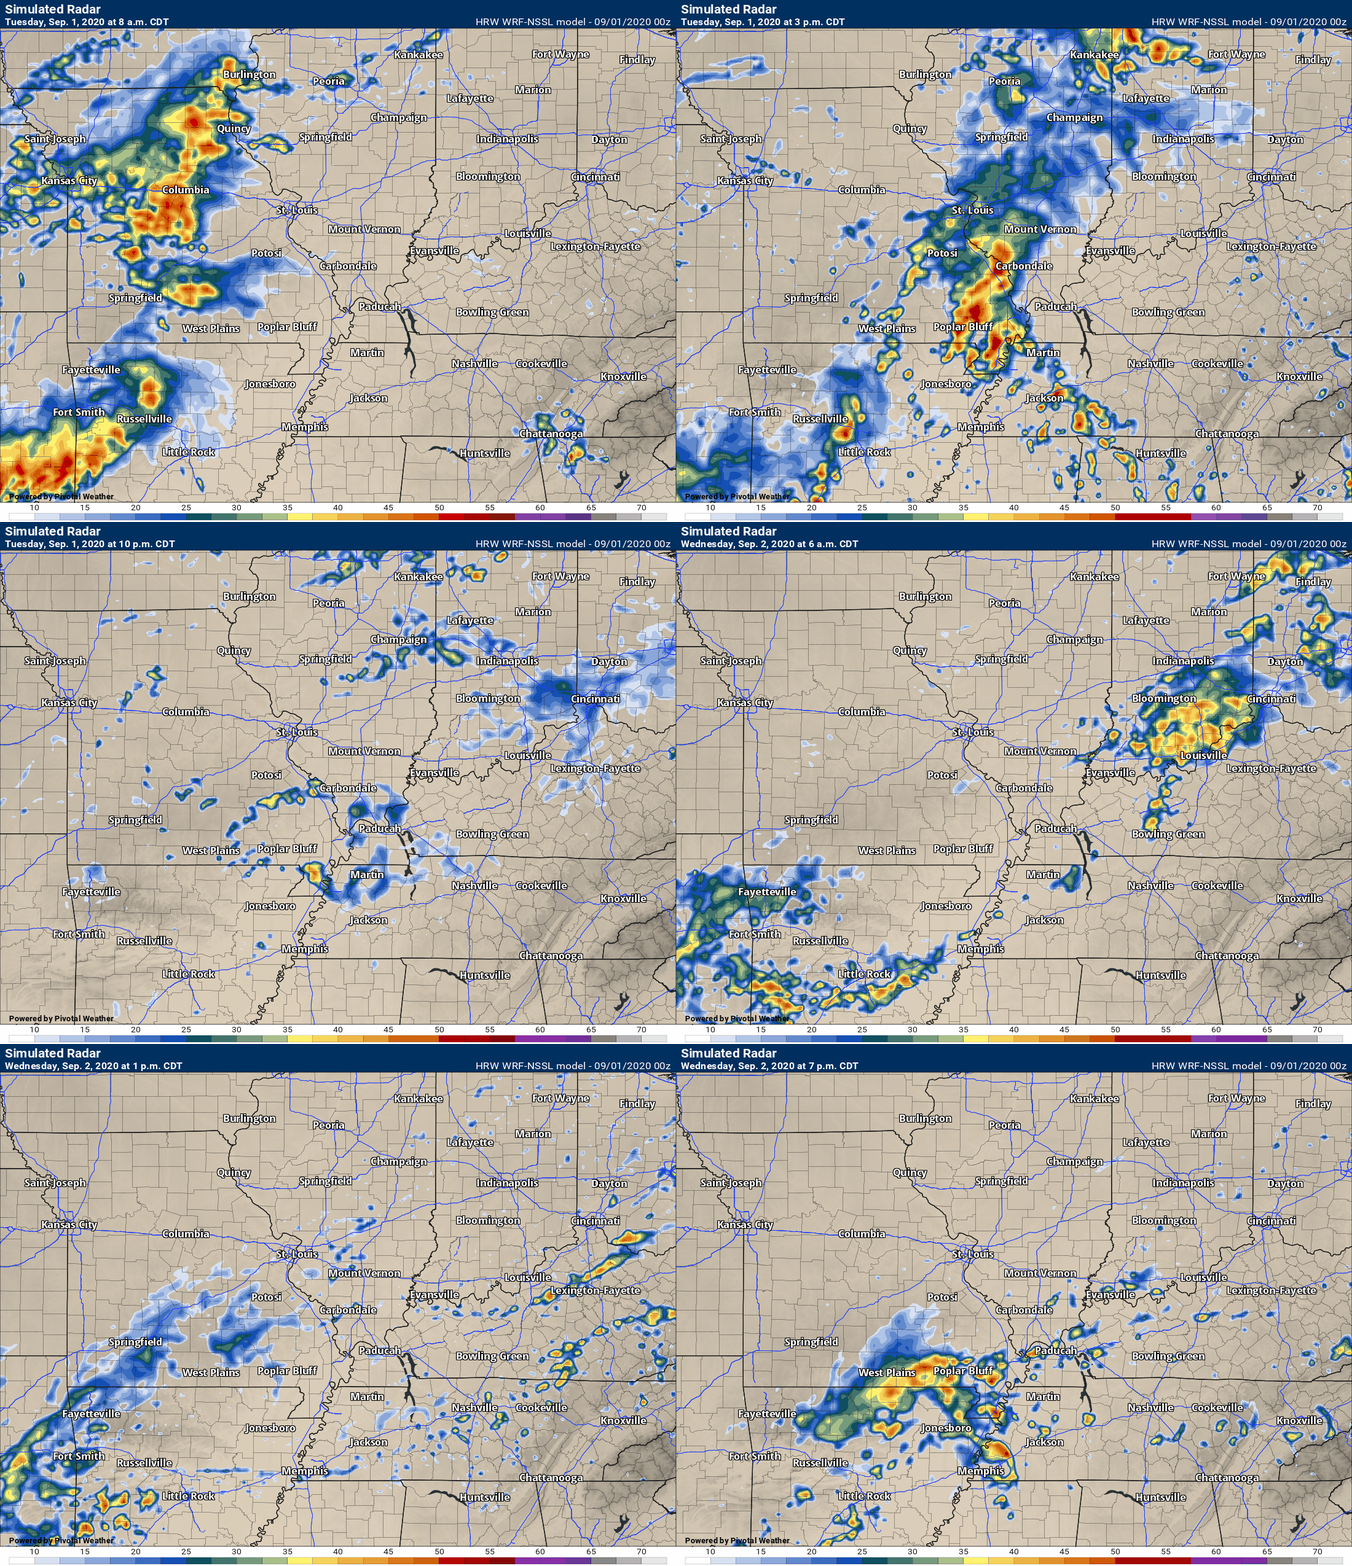
This animation is the SPC WRF model.
This animation shows you what radar might look like as the next system pulls through the region. It is a future-cast radar.
Green is rain. Blue is snow. Pink and red represent sleet and freezing rain.
Time-stamp upper left. Click the animation to enlarge it.
.
This animation is the 3K American Model.
This animation shows you what radar might look like as the next system pulls through the region. It is a future-cast radar.
Green is rain. Blue is snow. Pink and red represent sleet and freezing rain.
Time-stamp upper left. Click the animation to enlarge it.
.
This next animation is the NAM American Model.
This animation shows you what radar might look like as the system pulls through the region. It is a future-cast radar.
Green is rain. Blue is snow. Pink and red represent sleet and freezing rain.
Time-stamp upper left. Click the animation to enlarge it.
This next animation is the GFS American Model.
This animation shows you what radar might look like as the system pulls through the region. It is a future-cast radar.
Green is rain. Blue is snow. Pink and red represent sleet and freezing rain.
Time-stamp upper left. Click the animation to enlarge it.
.
.
Monday, August 31, 2020.
3:46 PM
Storms are remaining below severe levels for the time being. Wind gusts of 30 to 45 mph have been reported with the heavier cells.
A severe thunderstorm warning is issued when one reaches around 60 mph.
Storms for the most part will likely remain just below severe levels over the next few hours.
There has been some weakening over the past hour with the entire line of storms.
.
3 PM
2:20 PM
Storms moving through could produce 30 to 45 mph wind gusts. Frequent cloud to ground lightning. Very heavy rain and small hail. Avoid flooded roadways.
A flash flood warning has been issued for Bollinger County, Missouri.
.
1:33 PM
Radars
Interactive city-view radars
http://weatherobservatory.com/weather-radar.htm
A third backup radar
https://weathertalk.com/morani
Clickable watches and warnings can be viewed on the local city-view interactive radars (link above). Be sure and turn on the warnings above the local radars.
A new regional radar we offer
https://imagery.weathertalk.com/prx/RadarLoop.mp4
Lightning data
https://wtalk.co/7QT7WHKU
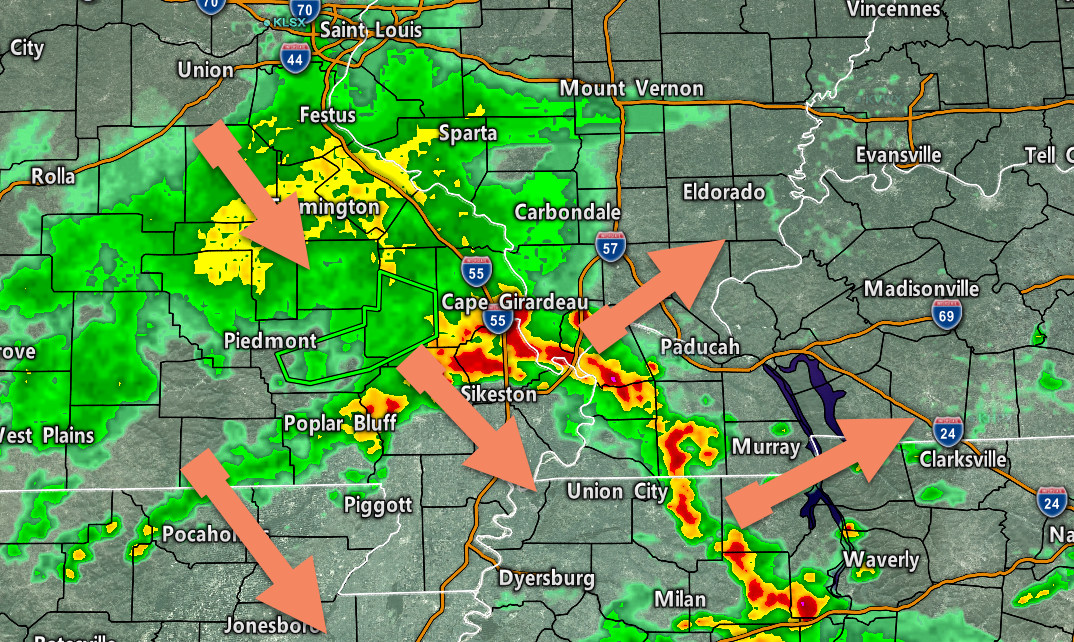
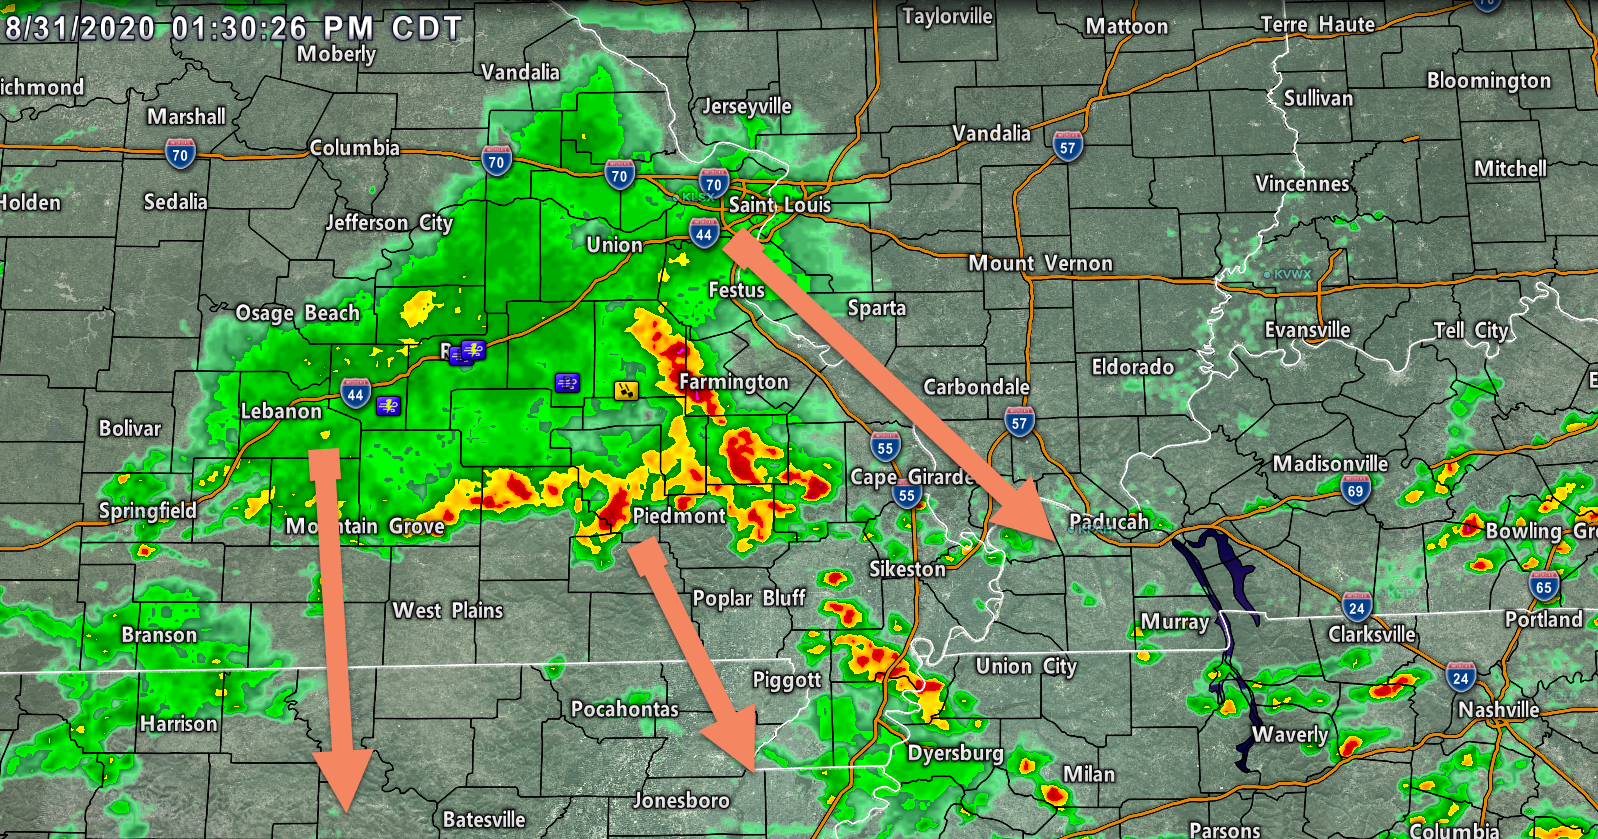
Storms continue to move south southeast.
12:47 PM
.
12:16 PM update
.
11:32 AM
Ste. Genevieve, Perry, Bollinger, and Cape Girardeau counties in SE MO. Randolph and Jackson Counties in southern IL.
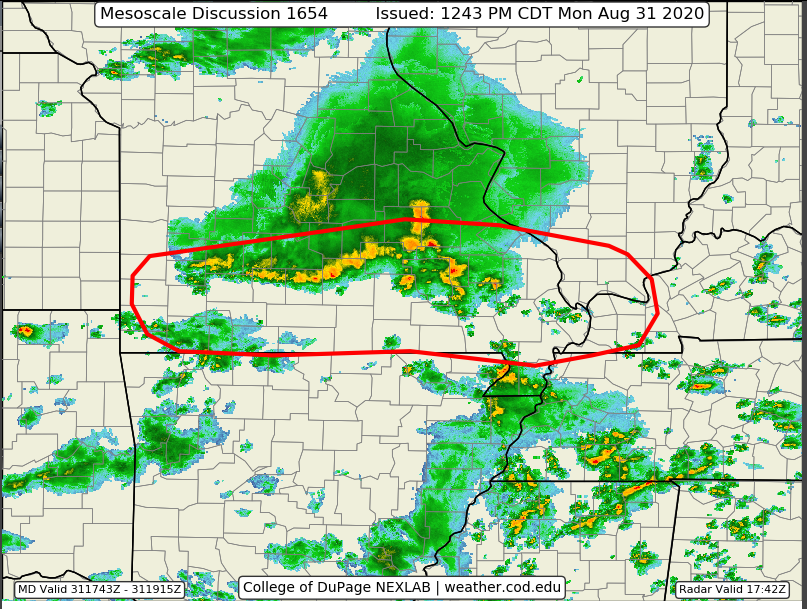
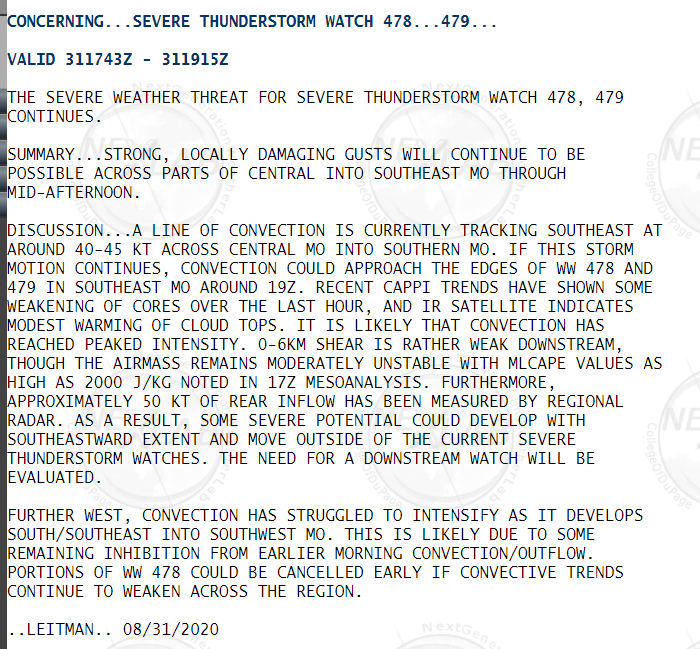
A severe thunderstorm watch has been issued in or near your area.
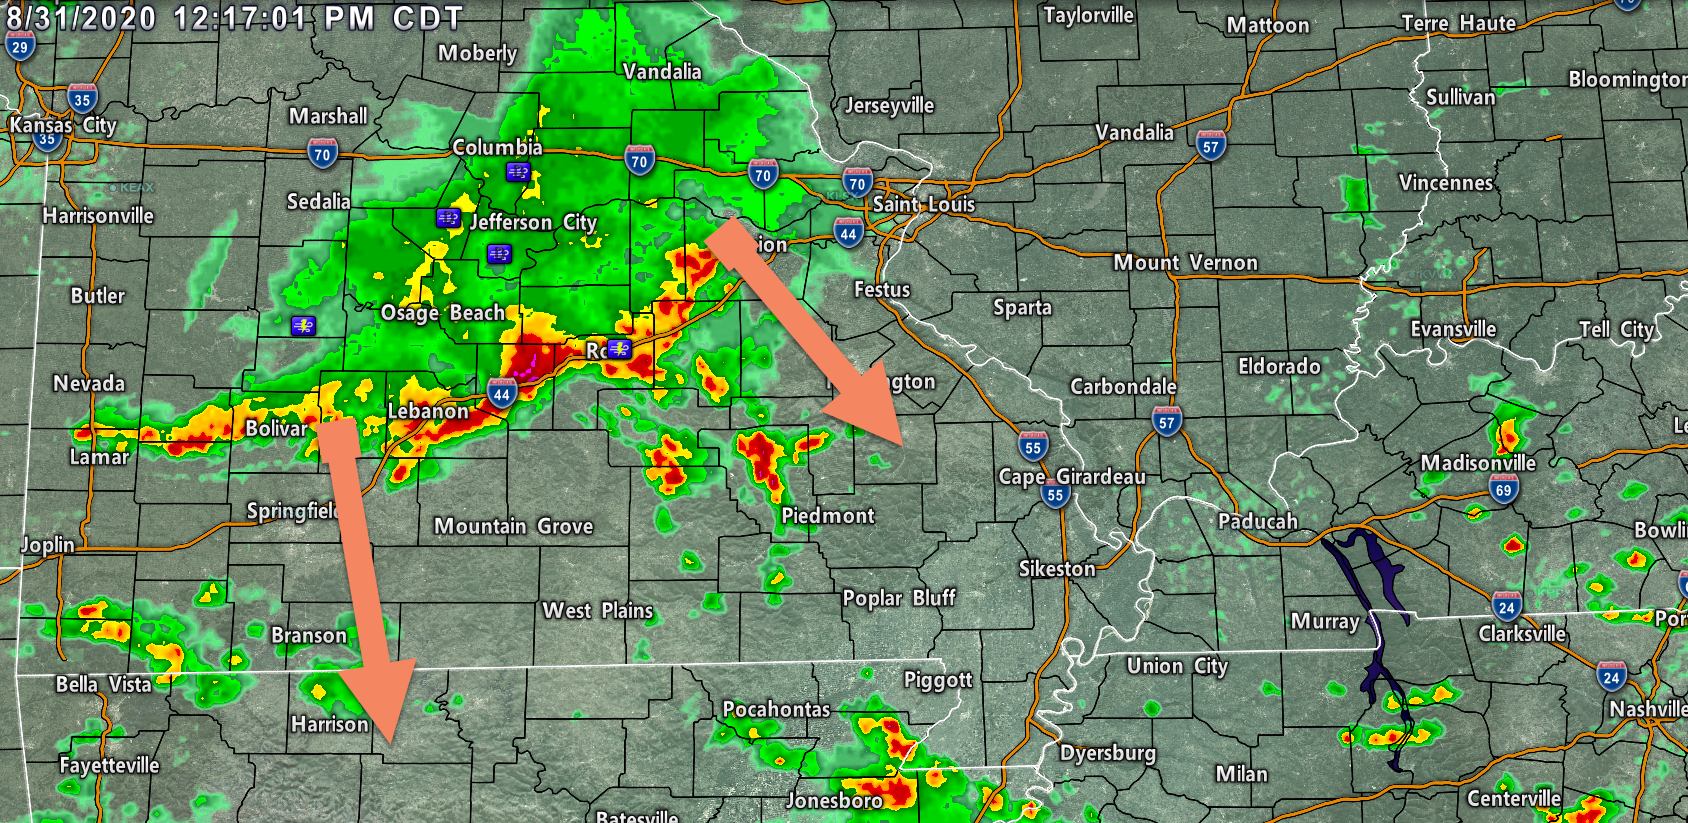
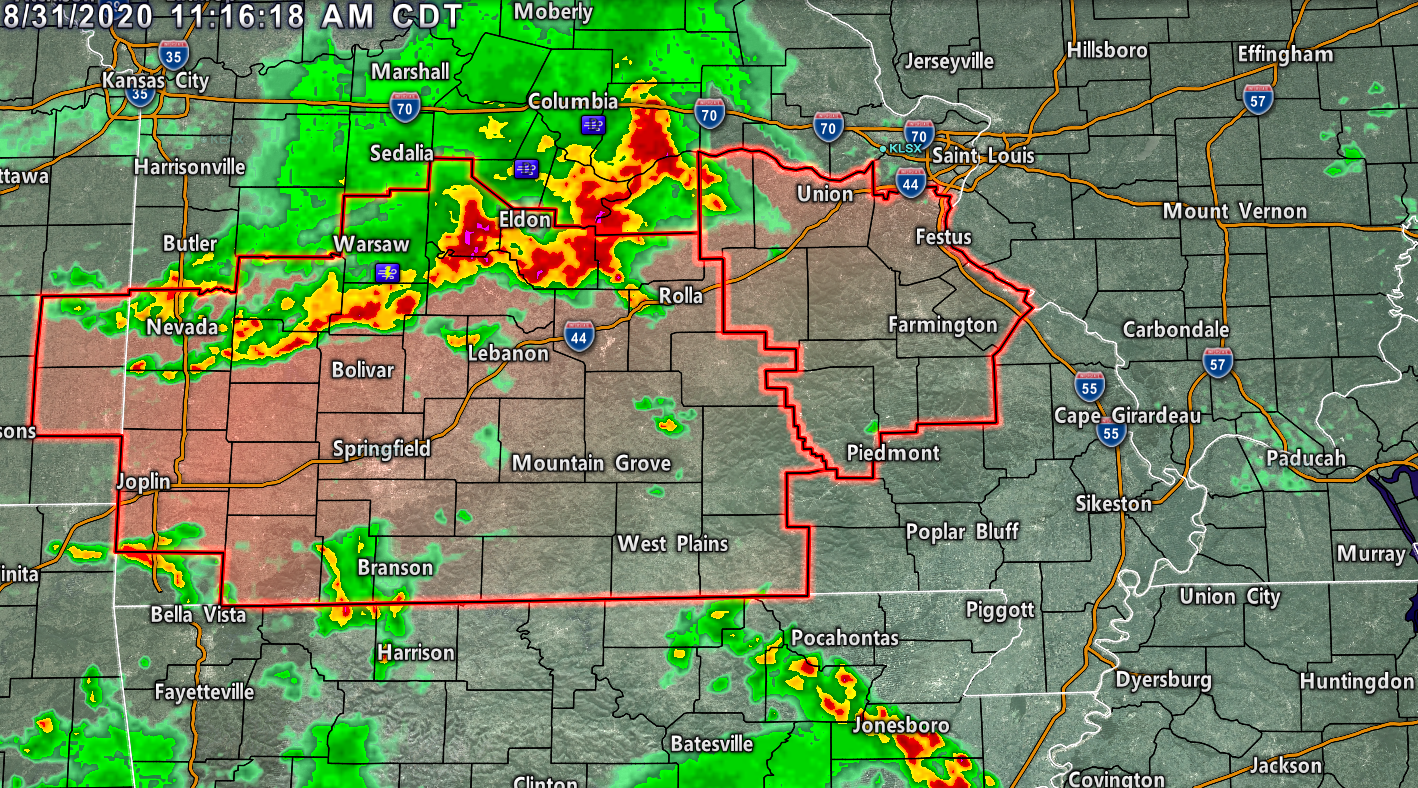
A line of thunderstorms is pushing east/southeast across east central Missouri.
The line is moving at a speed of 40 to 50 mph.
This line of thunderstorms will push towards the above mentioned counties over the coming hours. Damaging wind gusts, torrential downpours, frequent lightning, and small hail will be possible as the line moves through.
Monitor app messages in case warnings are issued.
.
11:10 AM
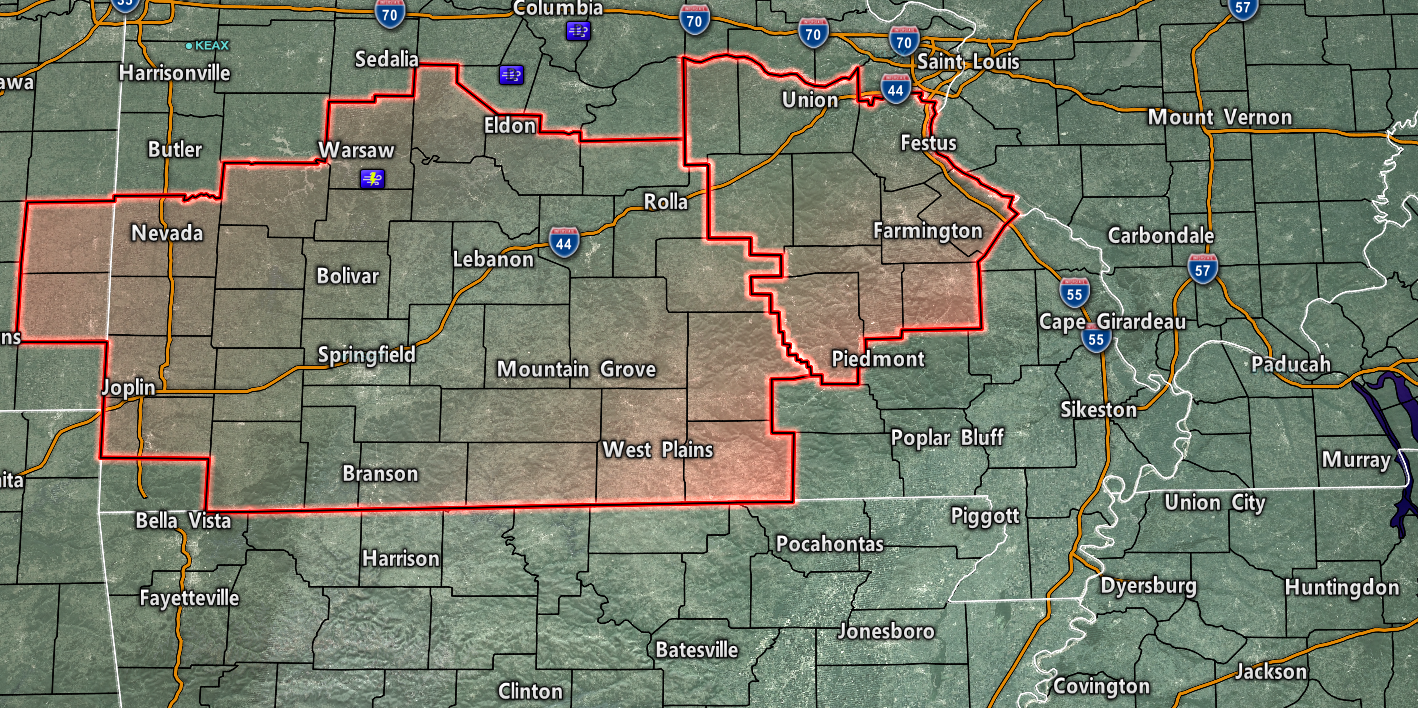
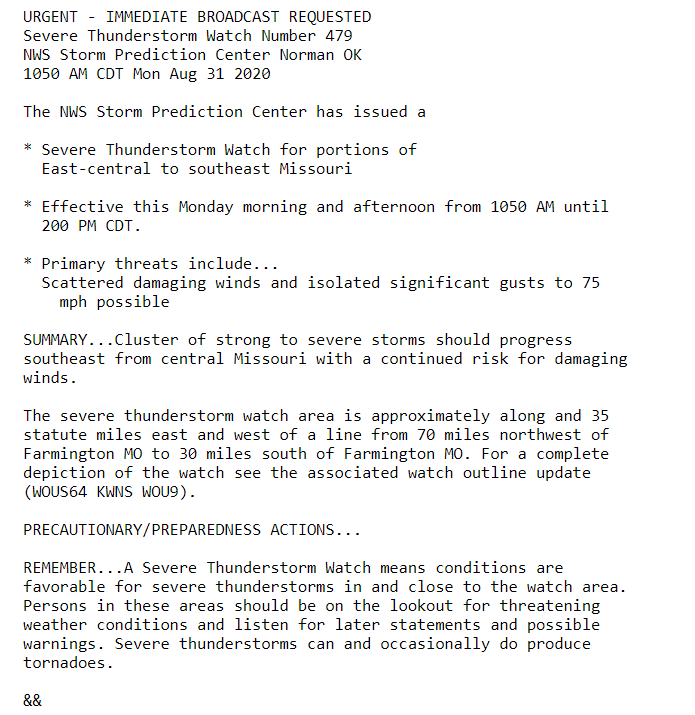
A severe thunderstorm watch has been issued in the red zone.
.
9:15 AM
Monday morning comments.
There is a higher than usual amount of uncertainty about how this afternoons thunderstorms develop. I did reluctantly increase rain chances.
Model guidance shows everything from a line of severe thunderstorms to nothing at all.
I am forecasting the higher chances of storms over southeast Missouri vs Illinois, Kentucky, and Tennessee.
Confidence in the final outcome is not very high.
Monitor the app for any severe weather messages (if storms do form).
.
8:30 AM Update
The Storm Prediction Center has outlined portions of the region for severe thunderstorms today.
Light green is where thunderstorms may occur but should be below severe levels.
Dark green is a level one risk. Yellow is a level two risk. Orange is a level three (enhanced) risk. Red is a level four (moderate) risk. Pink is a level five (high) risk.
One is the lowest risk. Five is the highest risk.
A severe storm is one that produces 58 mph wind or higher, quarter size hail, and/or a tornado.

The primary concern will be wind damage. A secondary concern will be frequent lightning, quarter size hail, and isolated flash flooding.
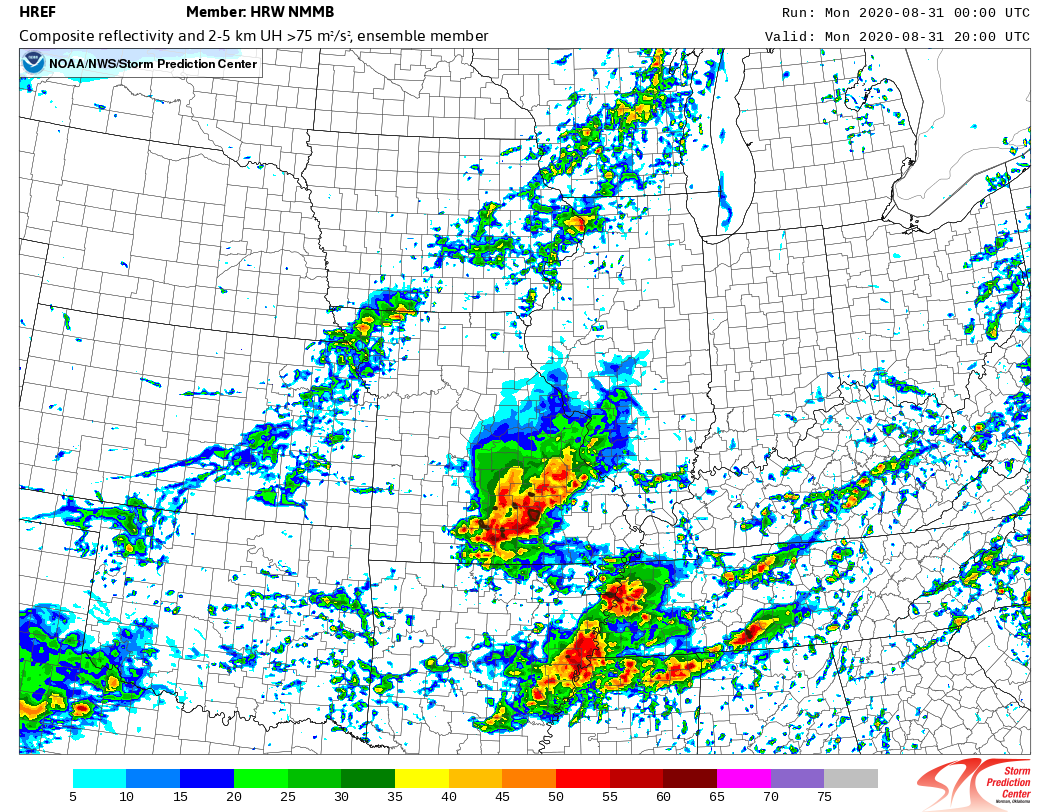
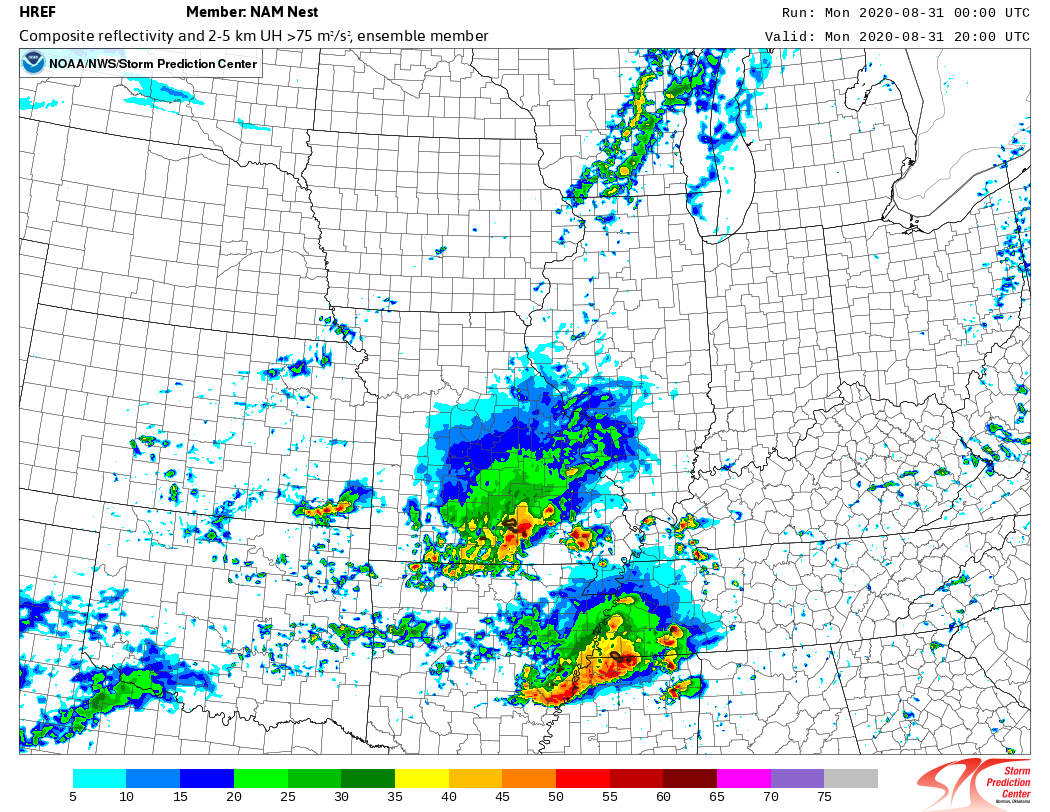
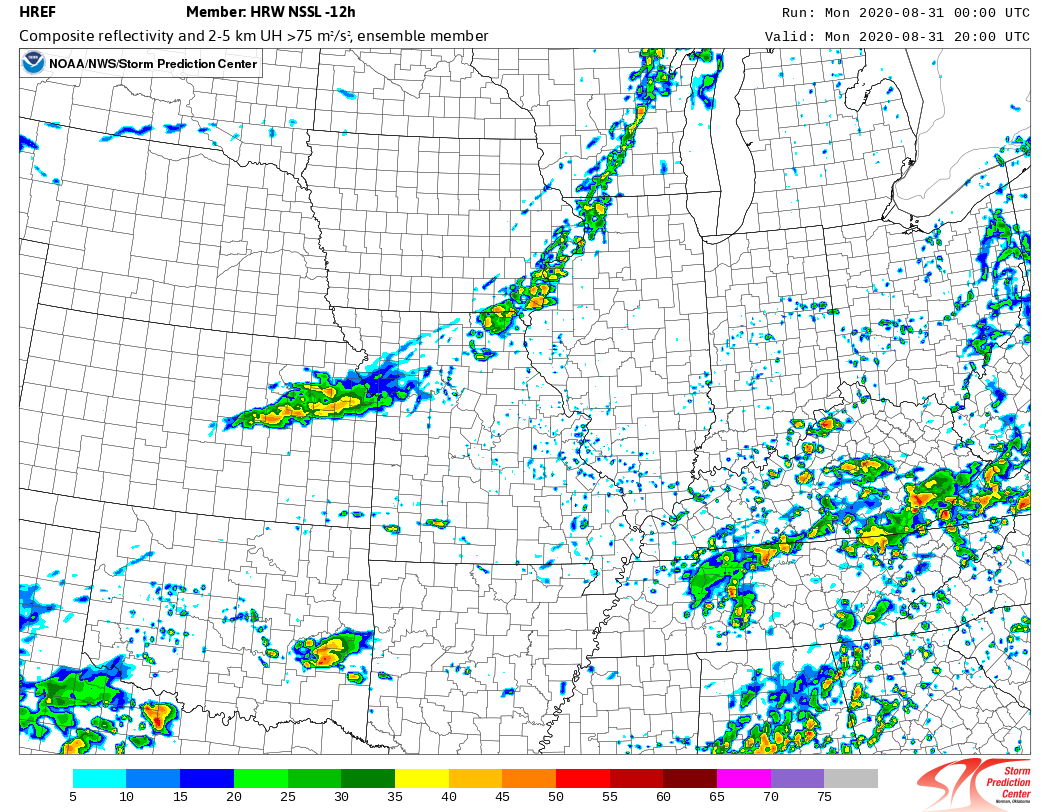
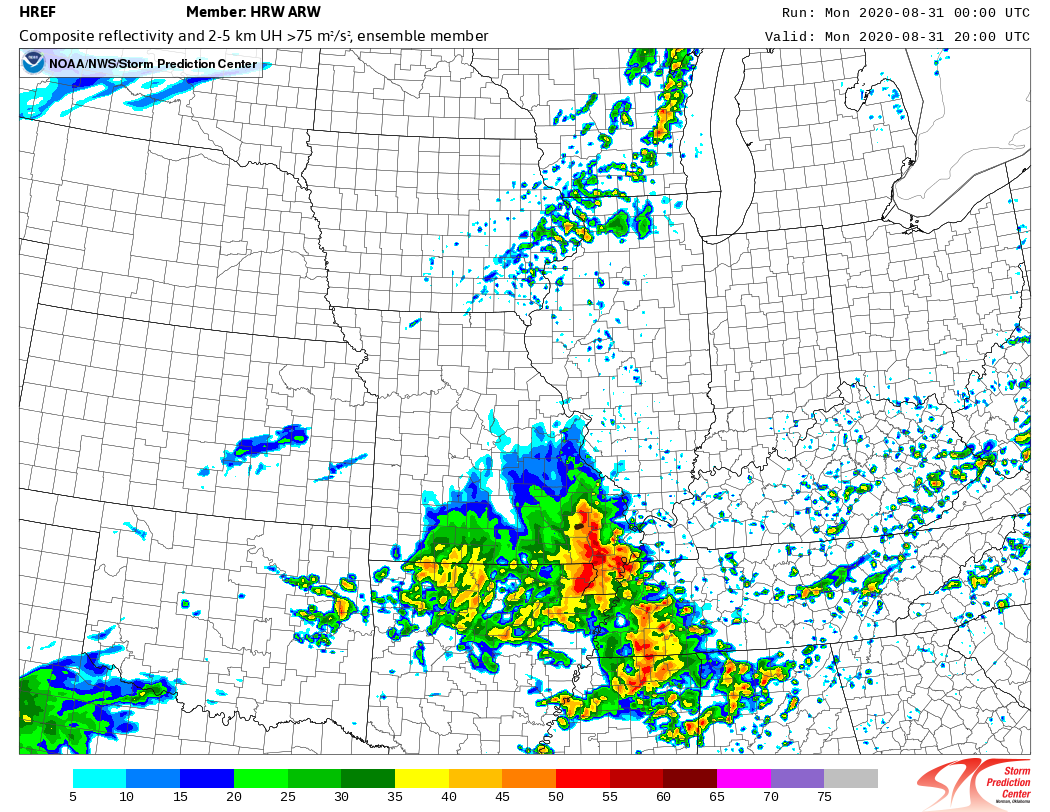
The storms will move northwest to southeast across Missouri later this morning into the afternoon hours. See the future cast radars below for a general idea. There are model disagreements.
A severe thunderstorm watch may need to be issued for portions of the region later today.
I will keep the live blog updated.
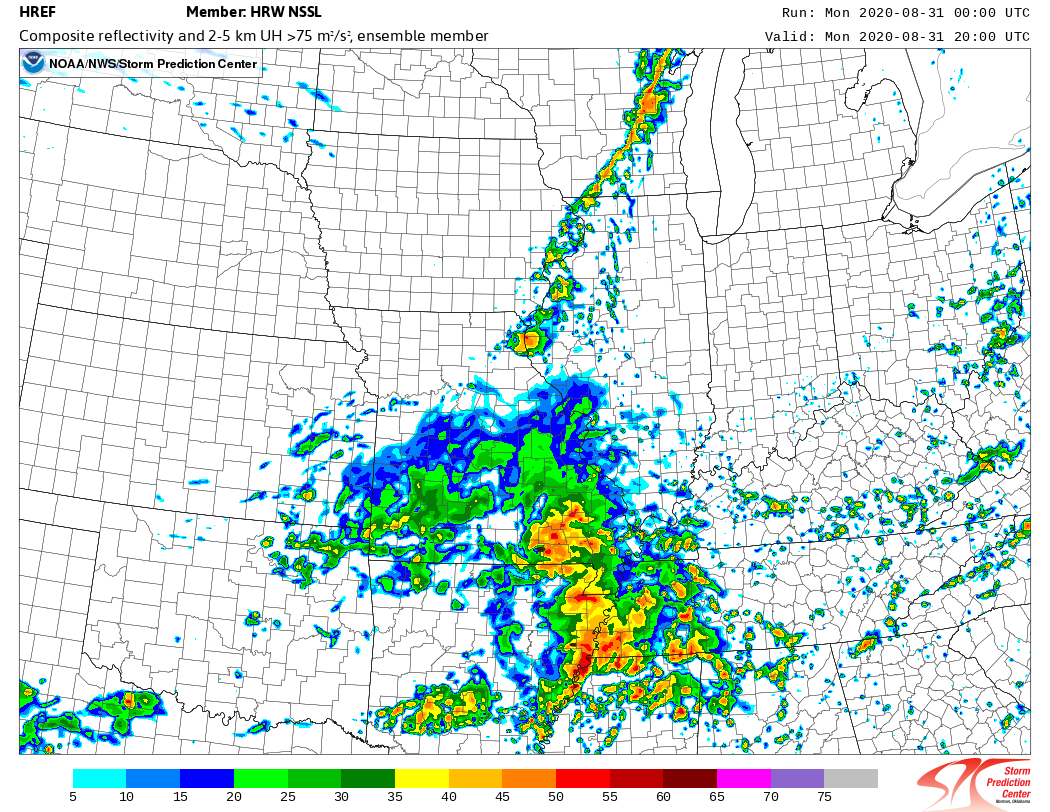
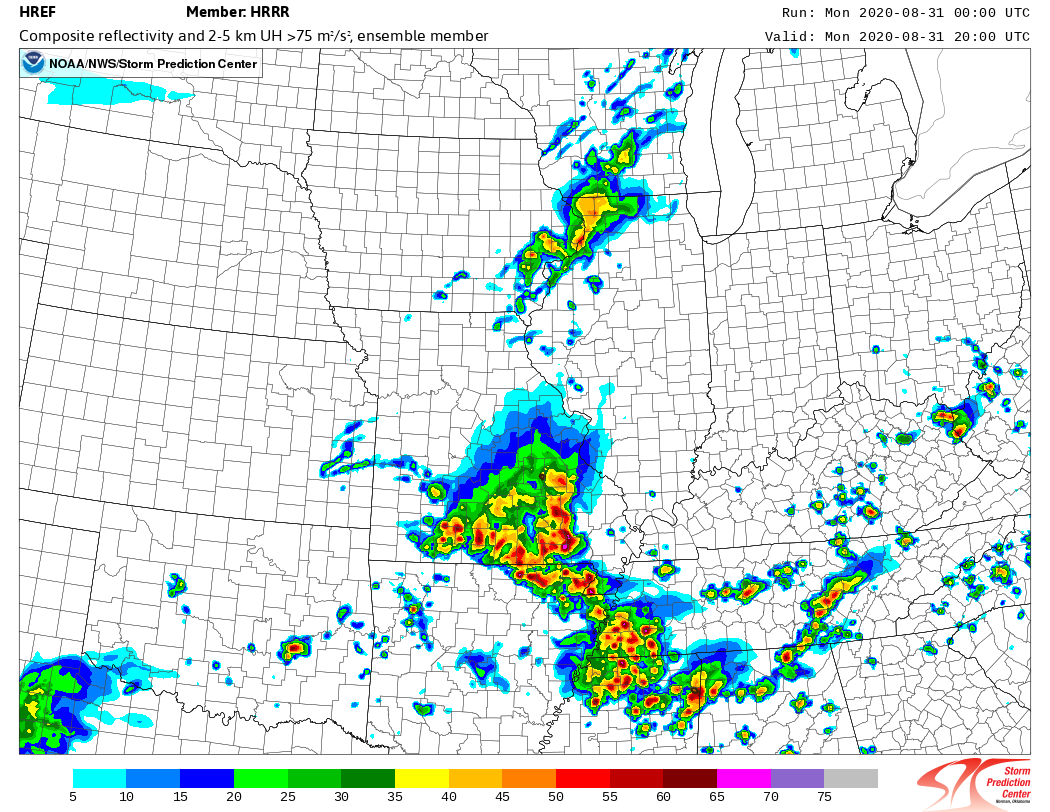
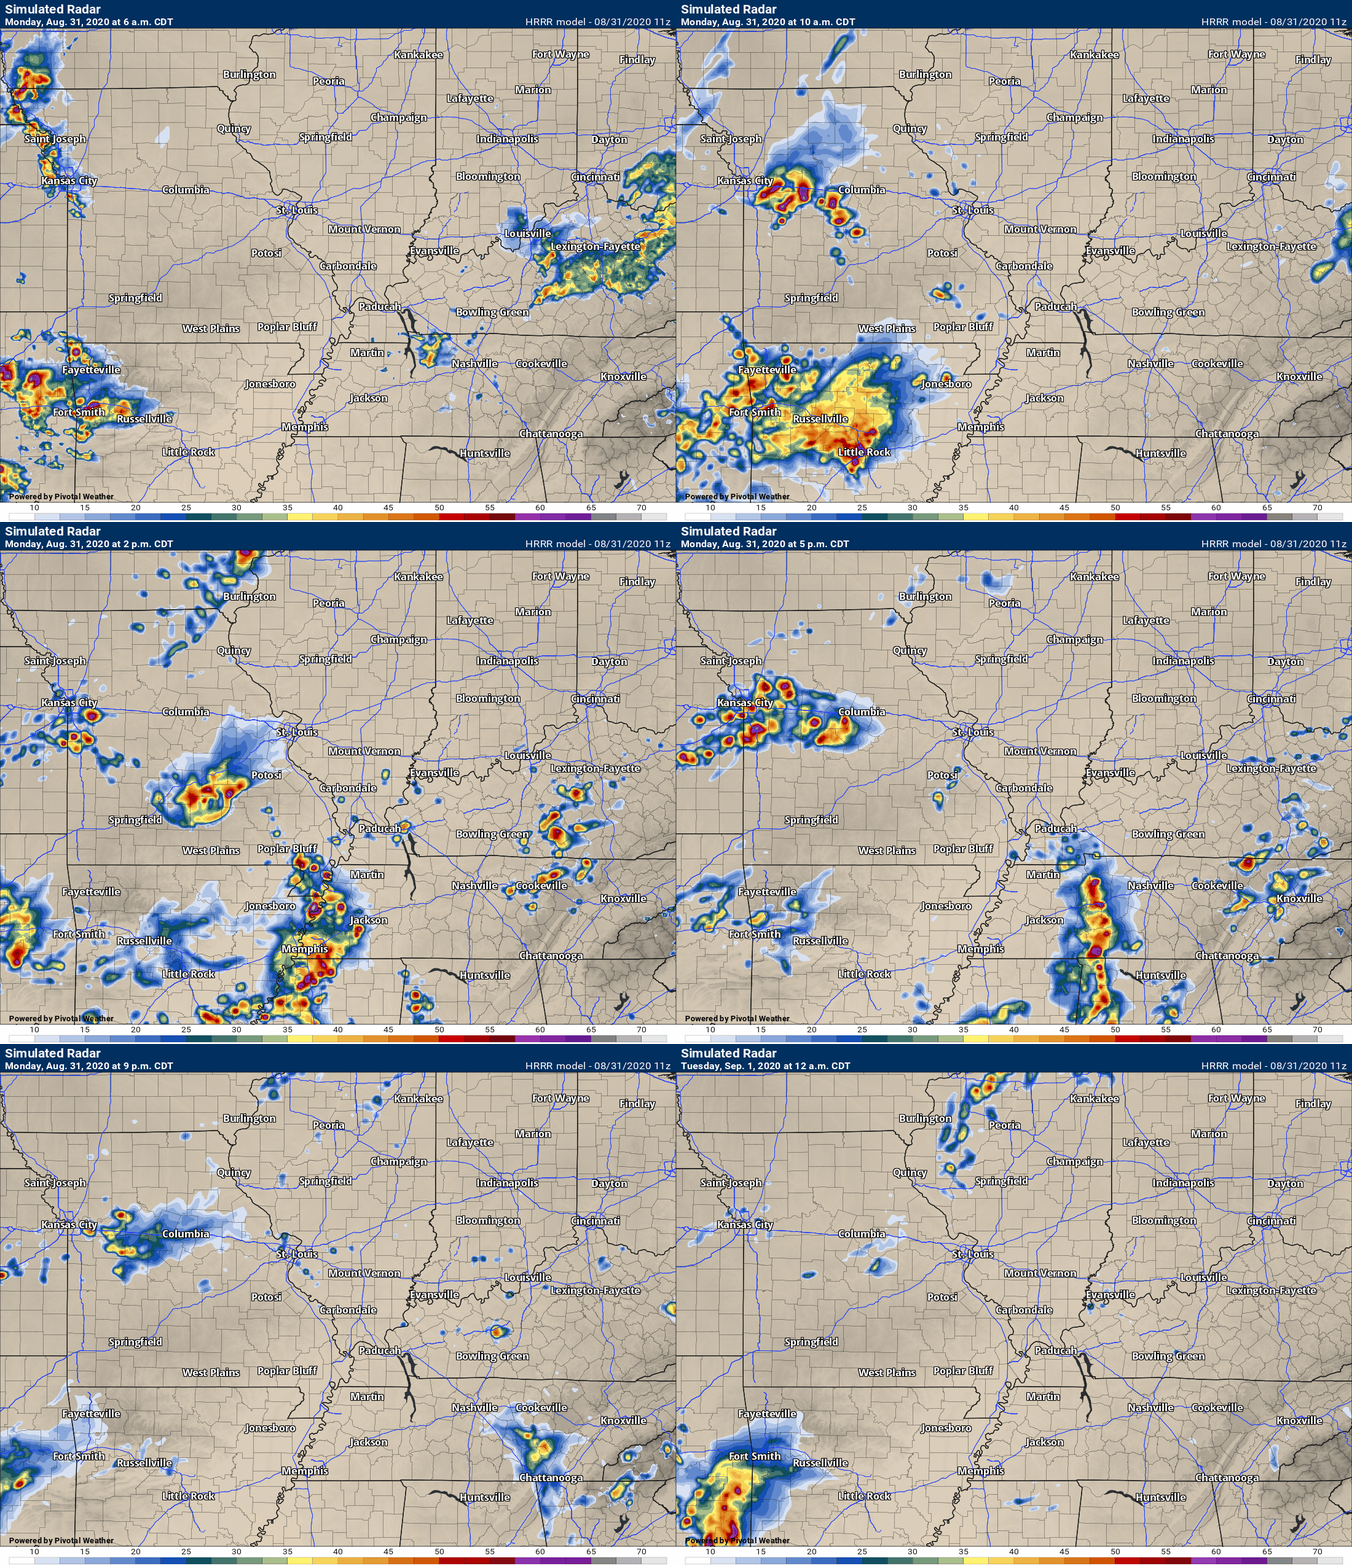
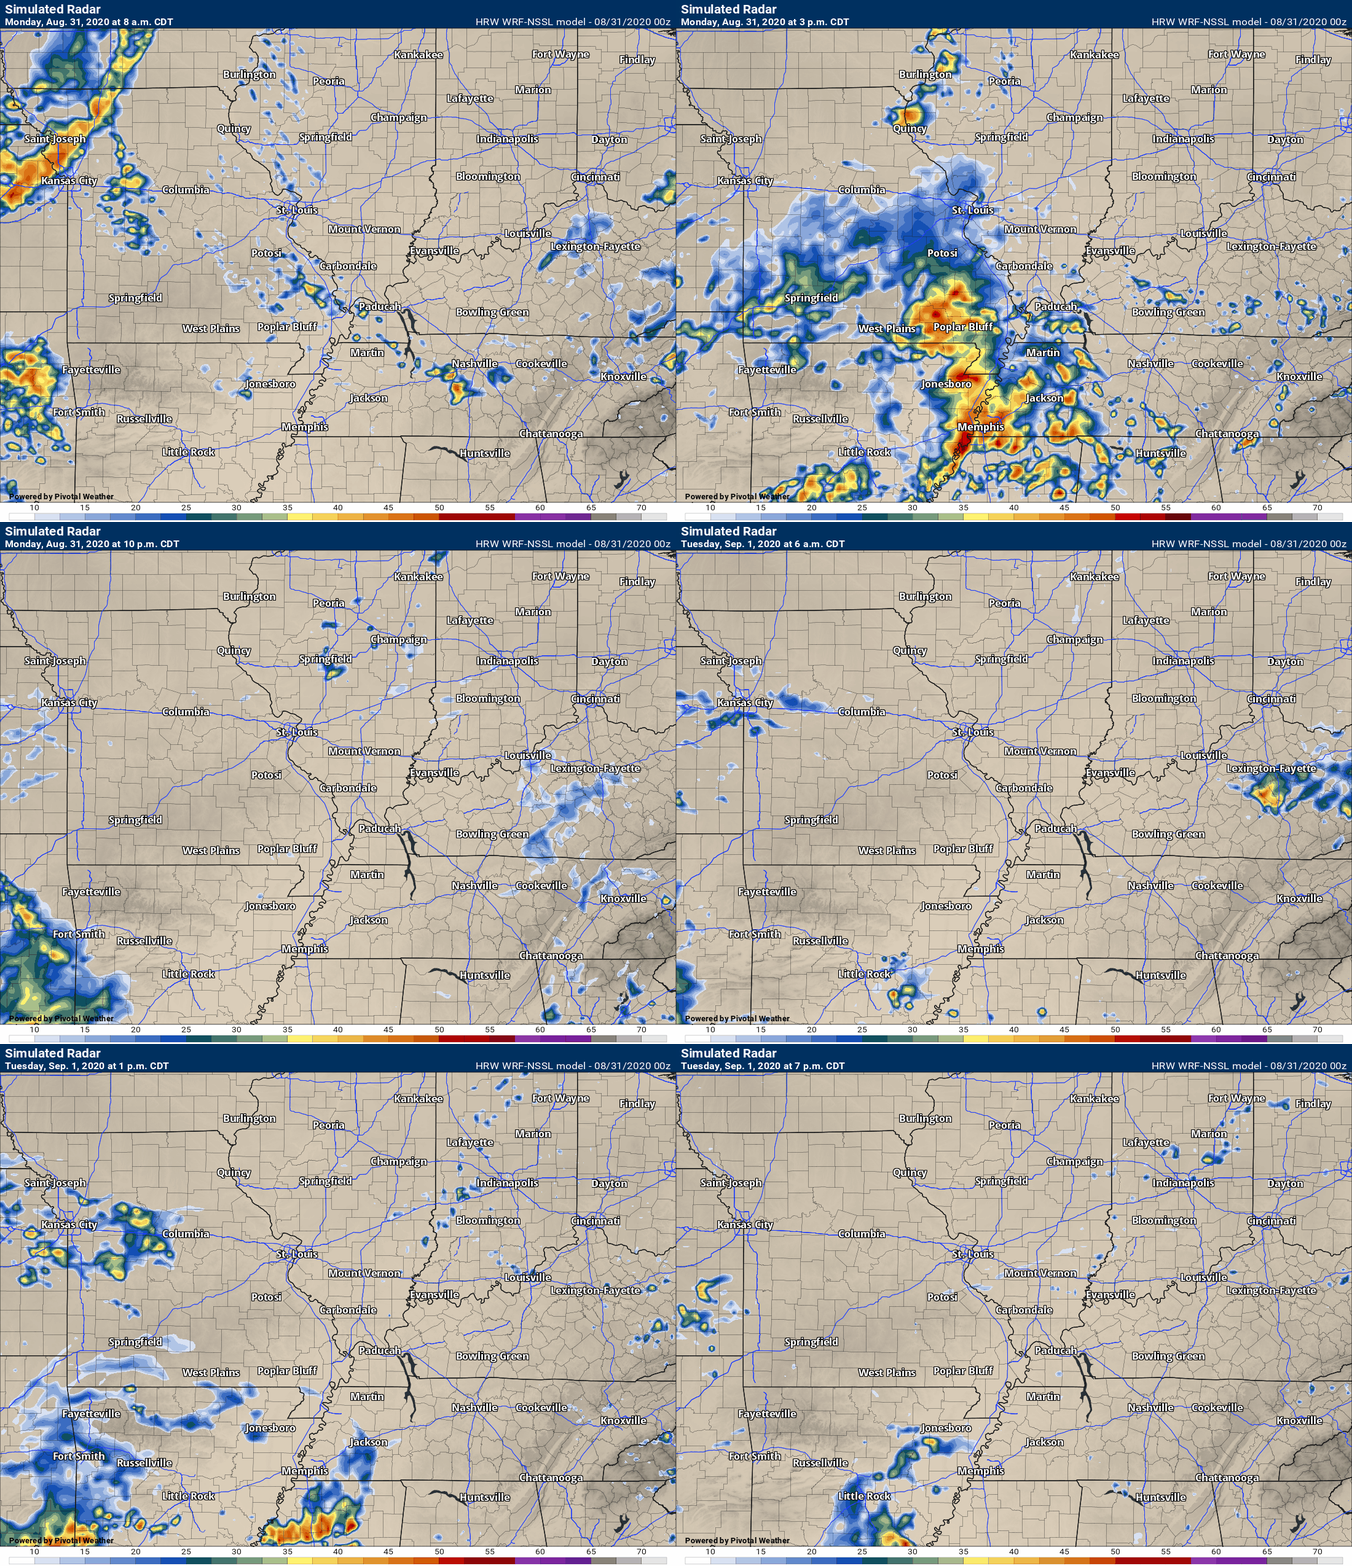
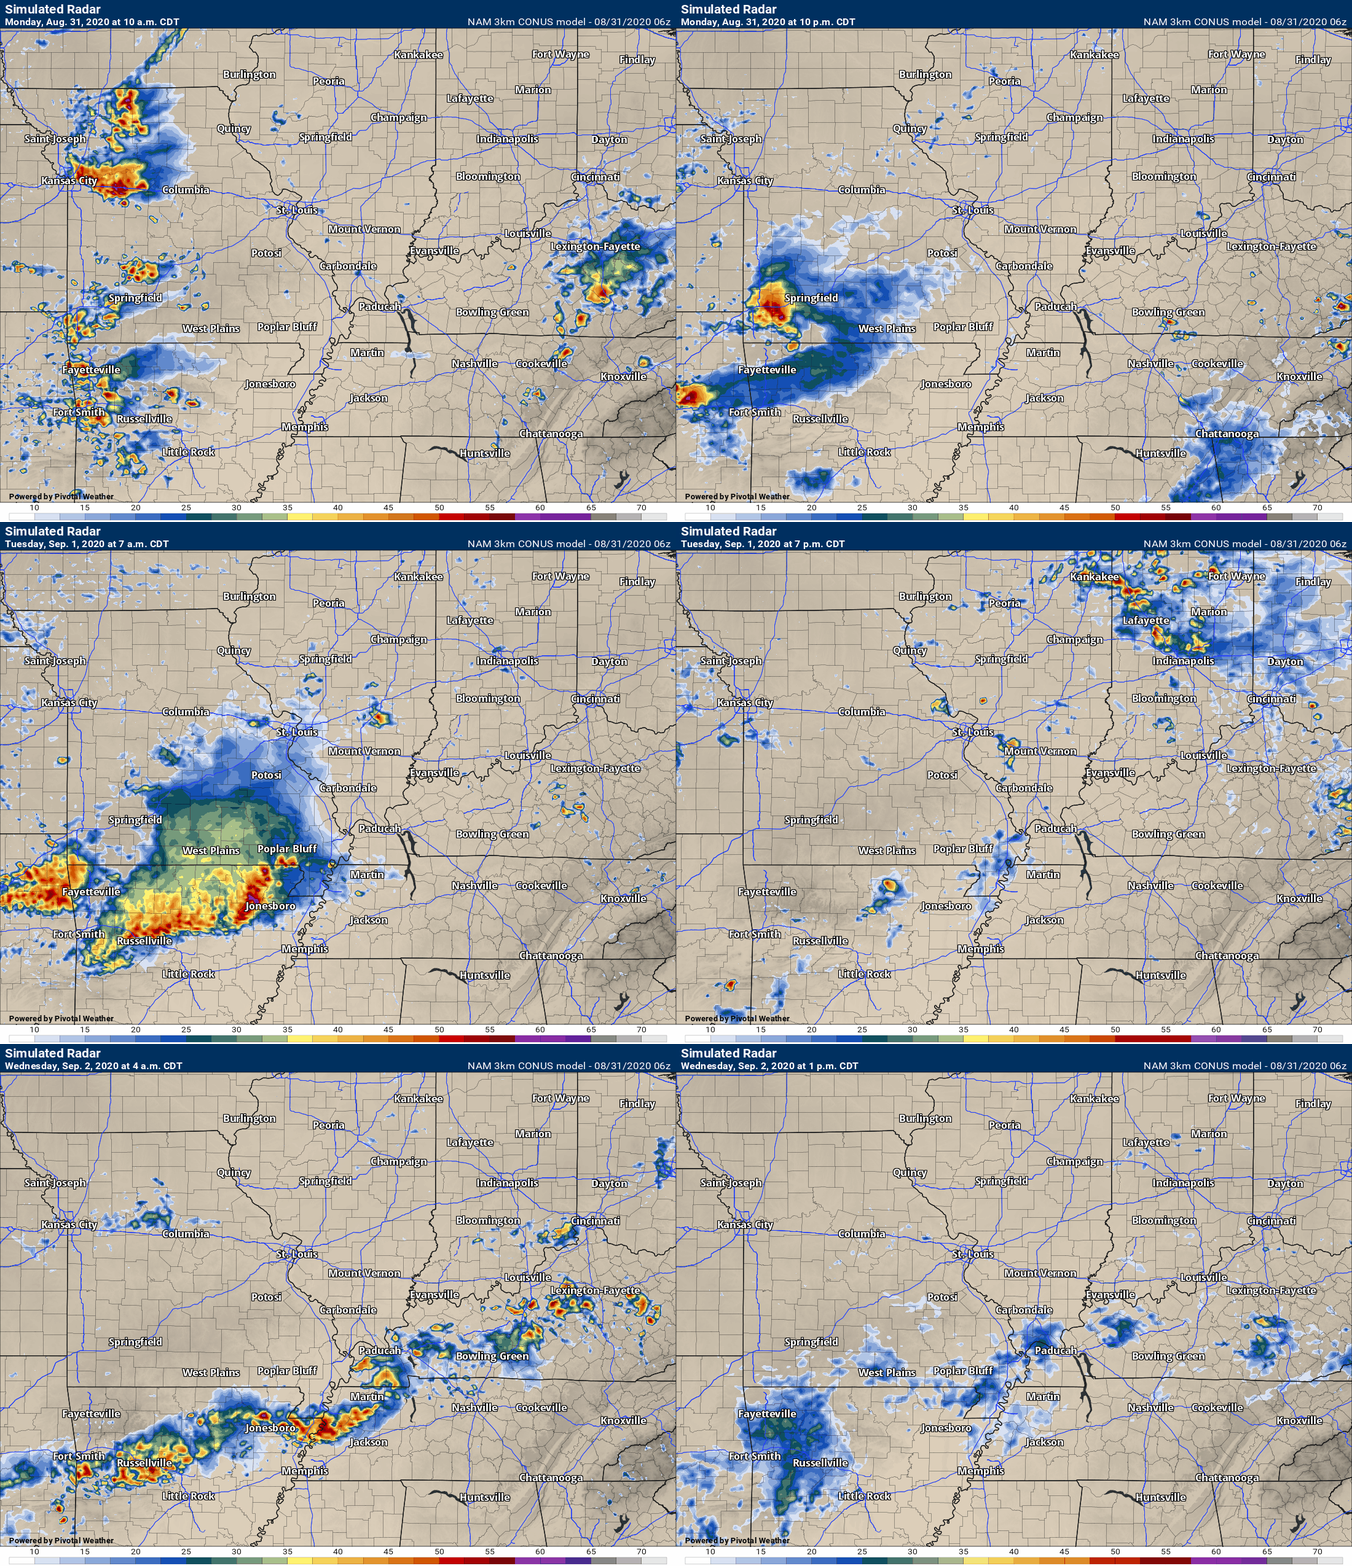
There are differing opinions from the models. Most, however, do show storms this afternoon.
Examples from different models. This is for mid-afternoon.
Each one of these is a different model.
.
Again, as a reminder, these are models. They are never 100% accurate. Take the general idea from them.
What should I take from these?
- The general idea and not specifics. Models usually do well with the generalities.
- The time-stamp is located in the upper left corner.
.
What am I looking at?
You are looking at different models. Meteorologists use many different models to forecast the weather. All models are wrong. Some are more wrong than others. Meteorologists have to make a forecast based on the guidance/models.
I show you these so you can see what the different models are showing as far as precipitation. If most of the models agree, then the confidence in the final weather forecast increases.
This animation is the Hrrr model.
This animation shows you what radar might look like as the next system pulls through the region. It is a future-cast radar.
Green is rain. Blue is snow. Pink and red represent sleet and freezing rain.
Time-stamp upper left. Click the animation to enlarge it.
.
This animation is the SPC WRF model.
This animation shows you what radar might look like as the next system pulls through the region. It is a future-cast radar.
Green is rain. Blue is snow. Pink and red represent sleet and freezing rain.
Time-stamp upper left. Click the animation to enlarge it.
.
This animation is the 3K American Model.
This animation shows you what radar might look like as the next system pulls through the region. It is a future-cast radar.
Green is rain. Blue is snow. Pink and red represent sleet and freezing rain.
Time-stamp upper left. Click the animation to enlarge it.
.
This next animation is the NAM American Model.
This animation shows you what radar might look like as the system pulls through the region. It is a future-cast radar.
Green is rain. Blue is snow. Pink and red represent sleet and freezing rain.
Time-stamp upper left. Click the animation to enlarge it.
This next animation is the GFS American Model.
This animation shows you what radar might look like as the system pulls through the region. It is a future-cast radar.
Green is rain. Blue is snow. Pink and red represent sleet and freezing rain.
Time-stamp upper left. Click the animation to enlarge it.
.
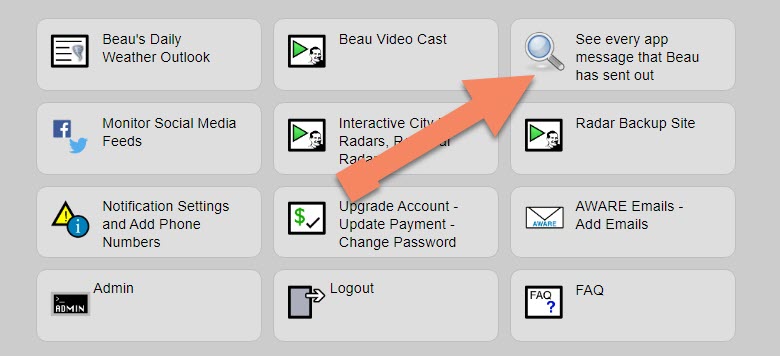
Note: We added a “see all” button on the website. This allows you to see every message that I have sent out (to all my forecast counties).
Here is the link. Click here.
To view the live radars, visit these links.
Radars
Interactive city-view radars
http://weatherobservatory.com/weather-radar.htm
A third backup radar
https://weathertalk.com/morani
Clickable watches and warnings can be viewed on the local city-view interactive radars (link above). Be sure and turn on the warnings above the local radars.
A new regional radar we offer
https://imagery.weathertalk.com/prx/RadarLoop.mp4
Lightning data
https://wtalk.co/7QT7WHKU
.
Storm Prediction Center severe weather outlook.
Here is the latest Storm Prediction Center outlook. Remember, don’t pay too much attention to the different colors. Focus on the actual forecast. The forecast is for a few severe thunderstorms.
The black outline is our local area.
Light green is where thunderstorms may occur but should be below severe levels.
Dark green is a level one risk. Yellow is a level two risk. Orange is a level three (enhanced) risk. Red is a level four (moderate) risk. Pink is a level five (high) risk.
One is the lowest risk. Five is the highest risk.
A severe storm is one that produces 58 mph wind or higher, quarter size hail, and/or a tornado.

.
Tomorrow’s severe weather outlook.

Not receiving app/text messages?
USE THE APP. ATT and Verizon are slowing or stopping the text messages.
Make sure you have the correct app/text options turned on. Find those under the personal notification settings tab at www.weathertalk.com. Red is off. Green is on.
Subscribers, PLEASE USE THE APP. ATT and Verizon are not reliable during severe weather. They are delaying text messages.
The app is under WeatherTalk in the app store.
Apple users click here
Android users click here
.

Live lightning data: Click here.


