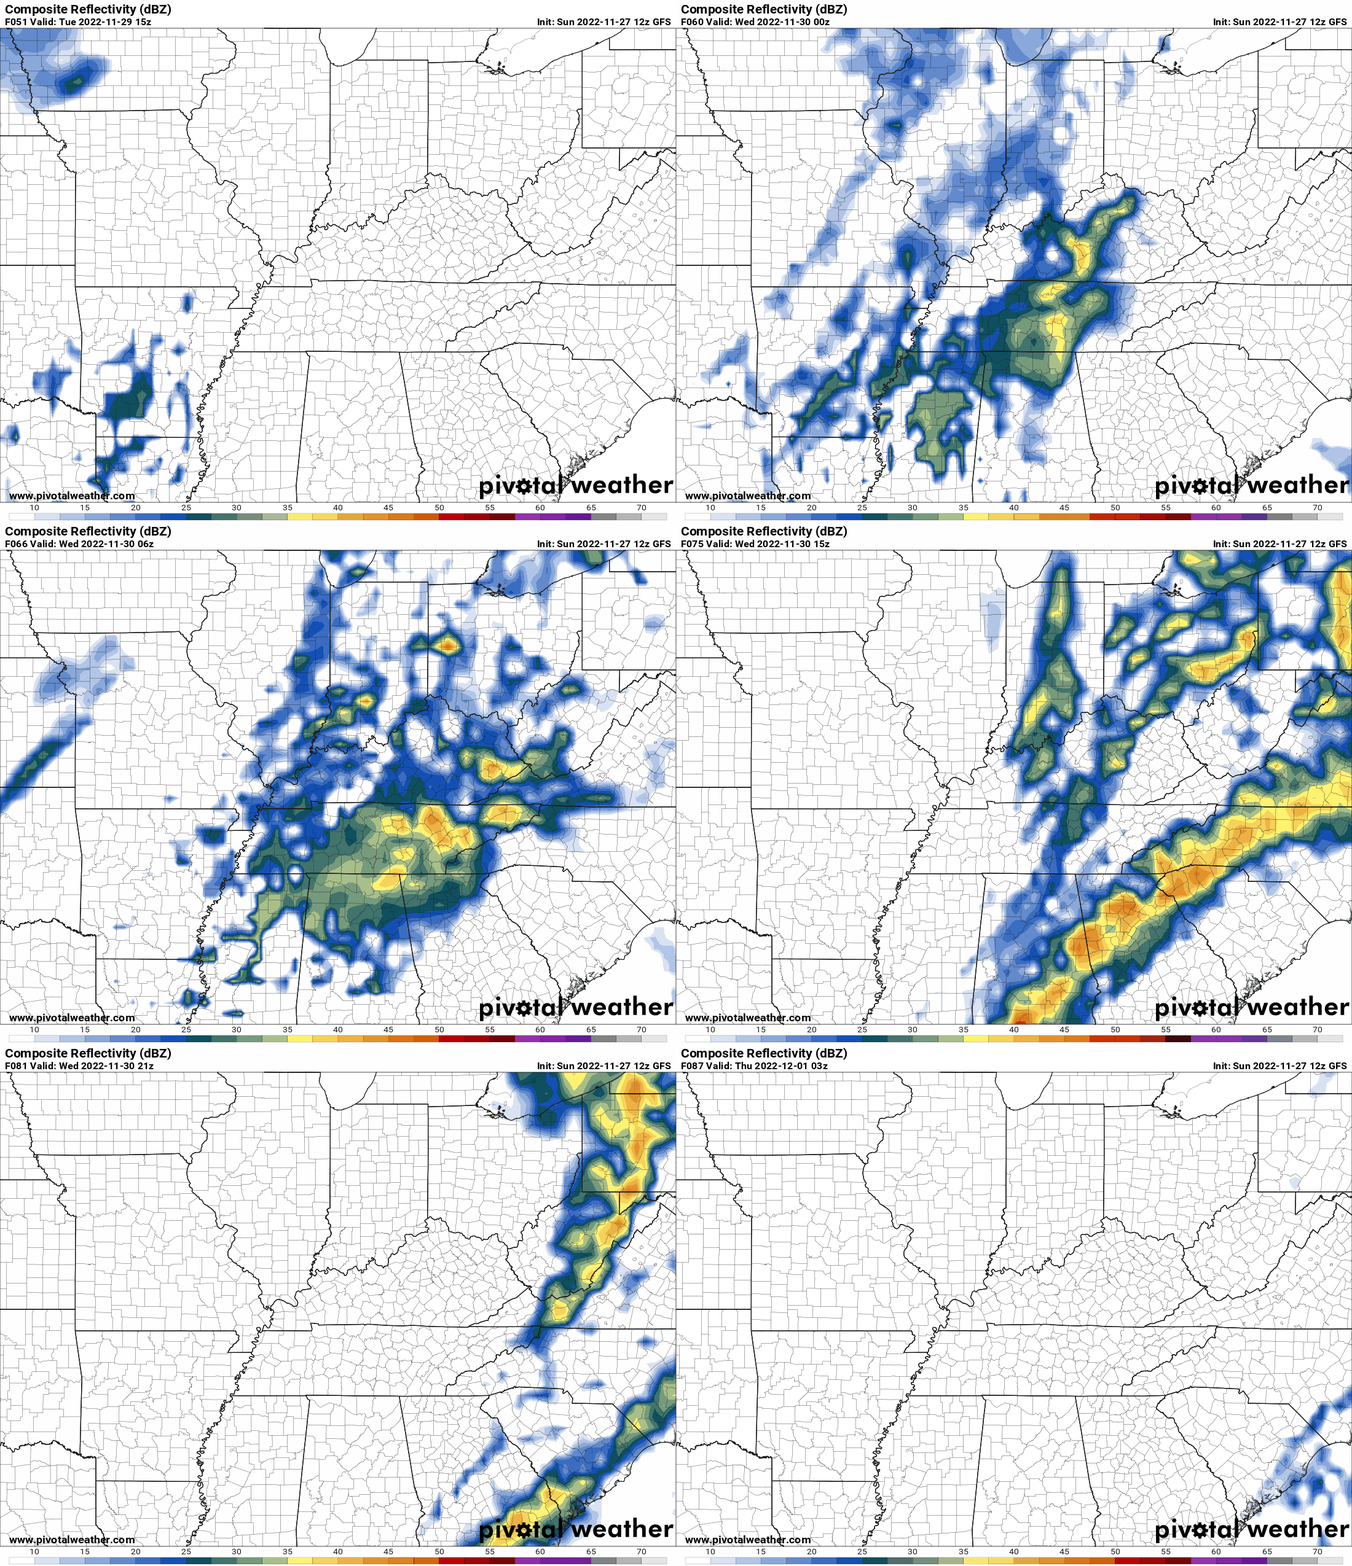
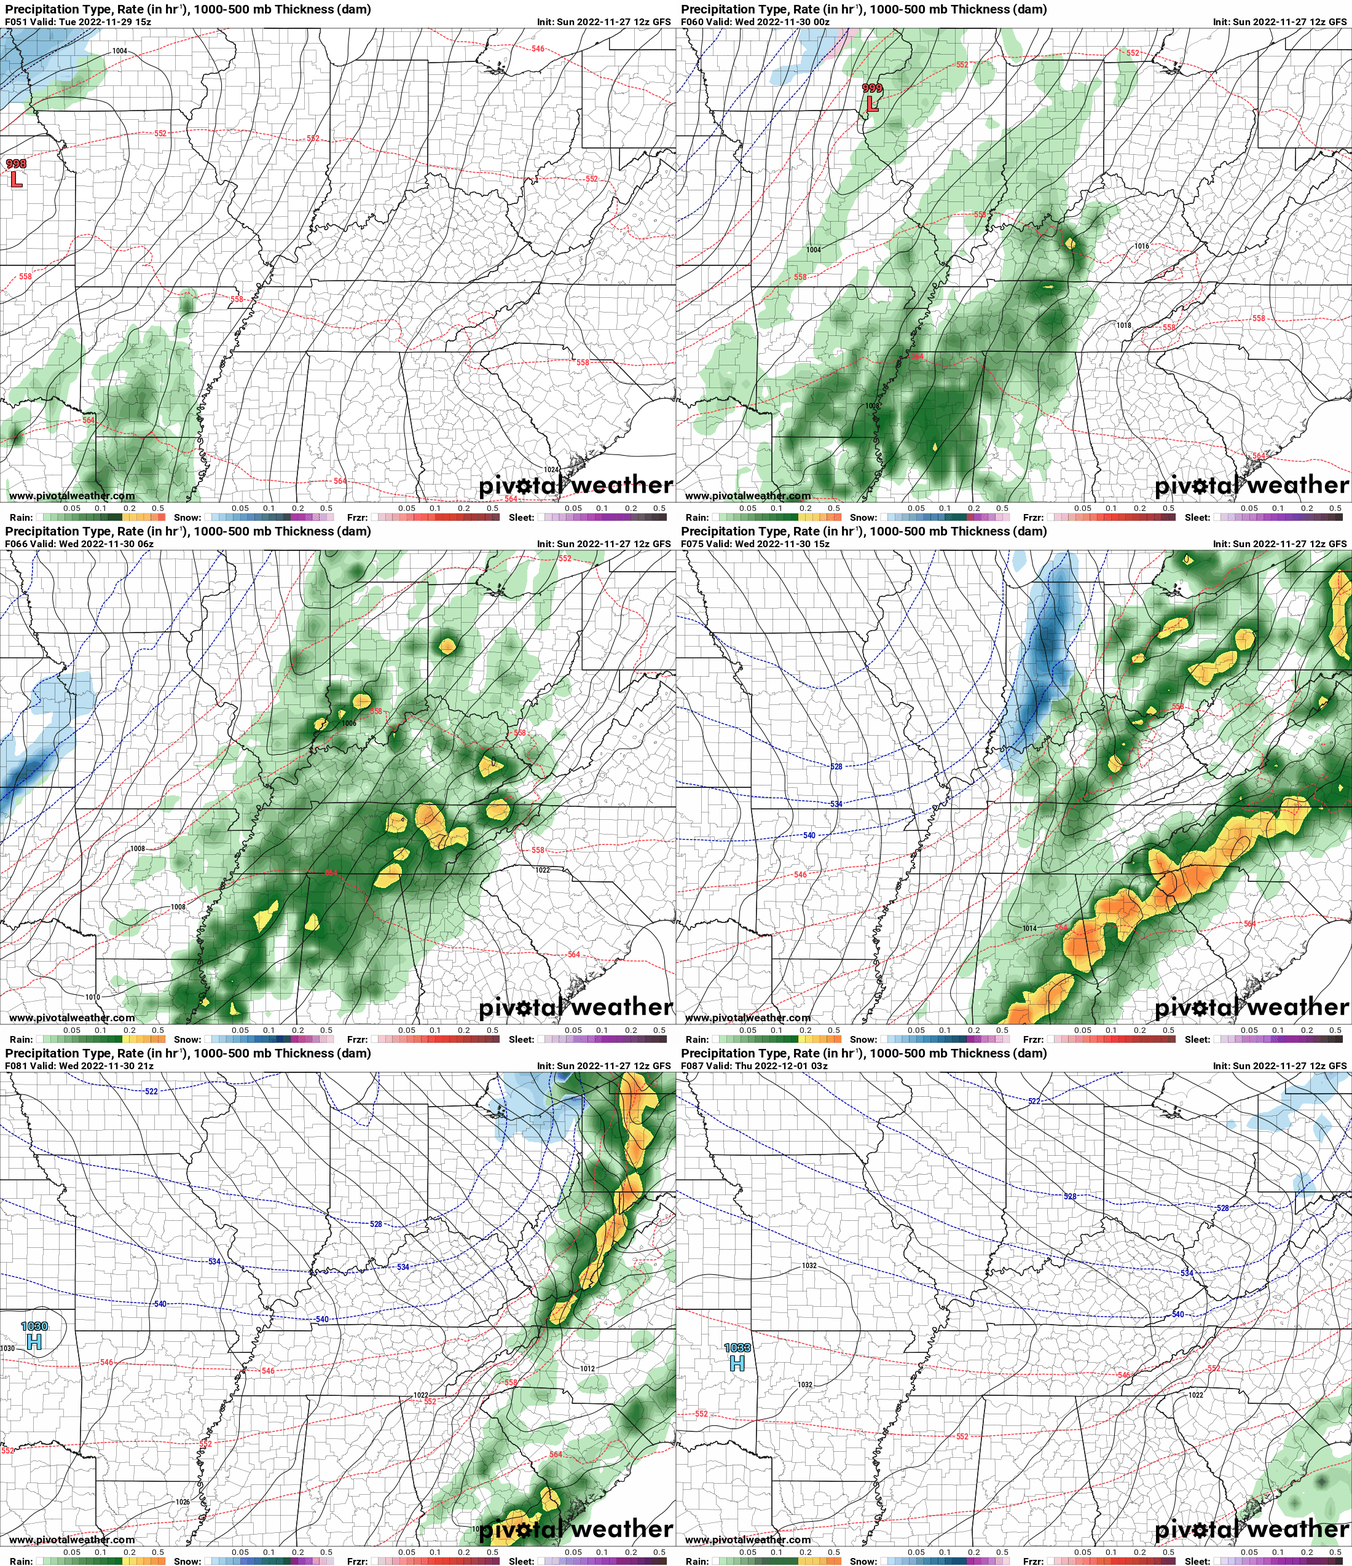
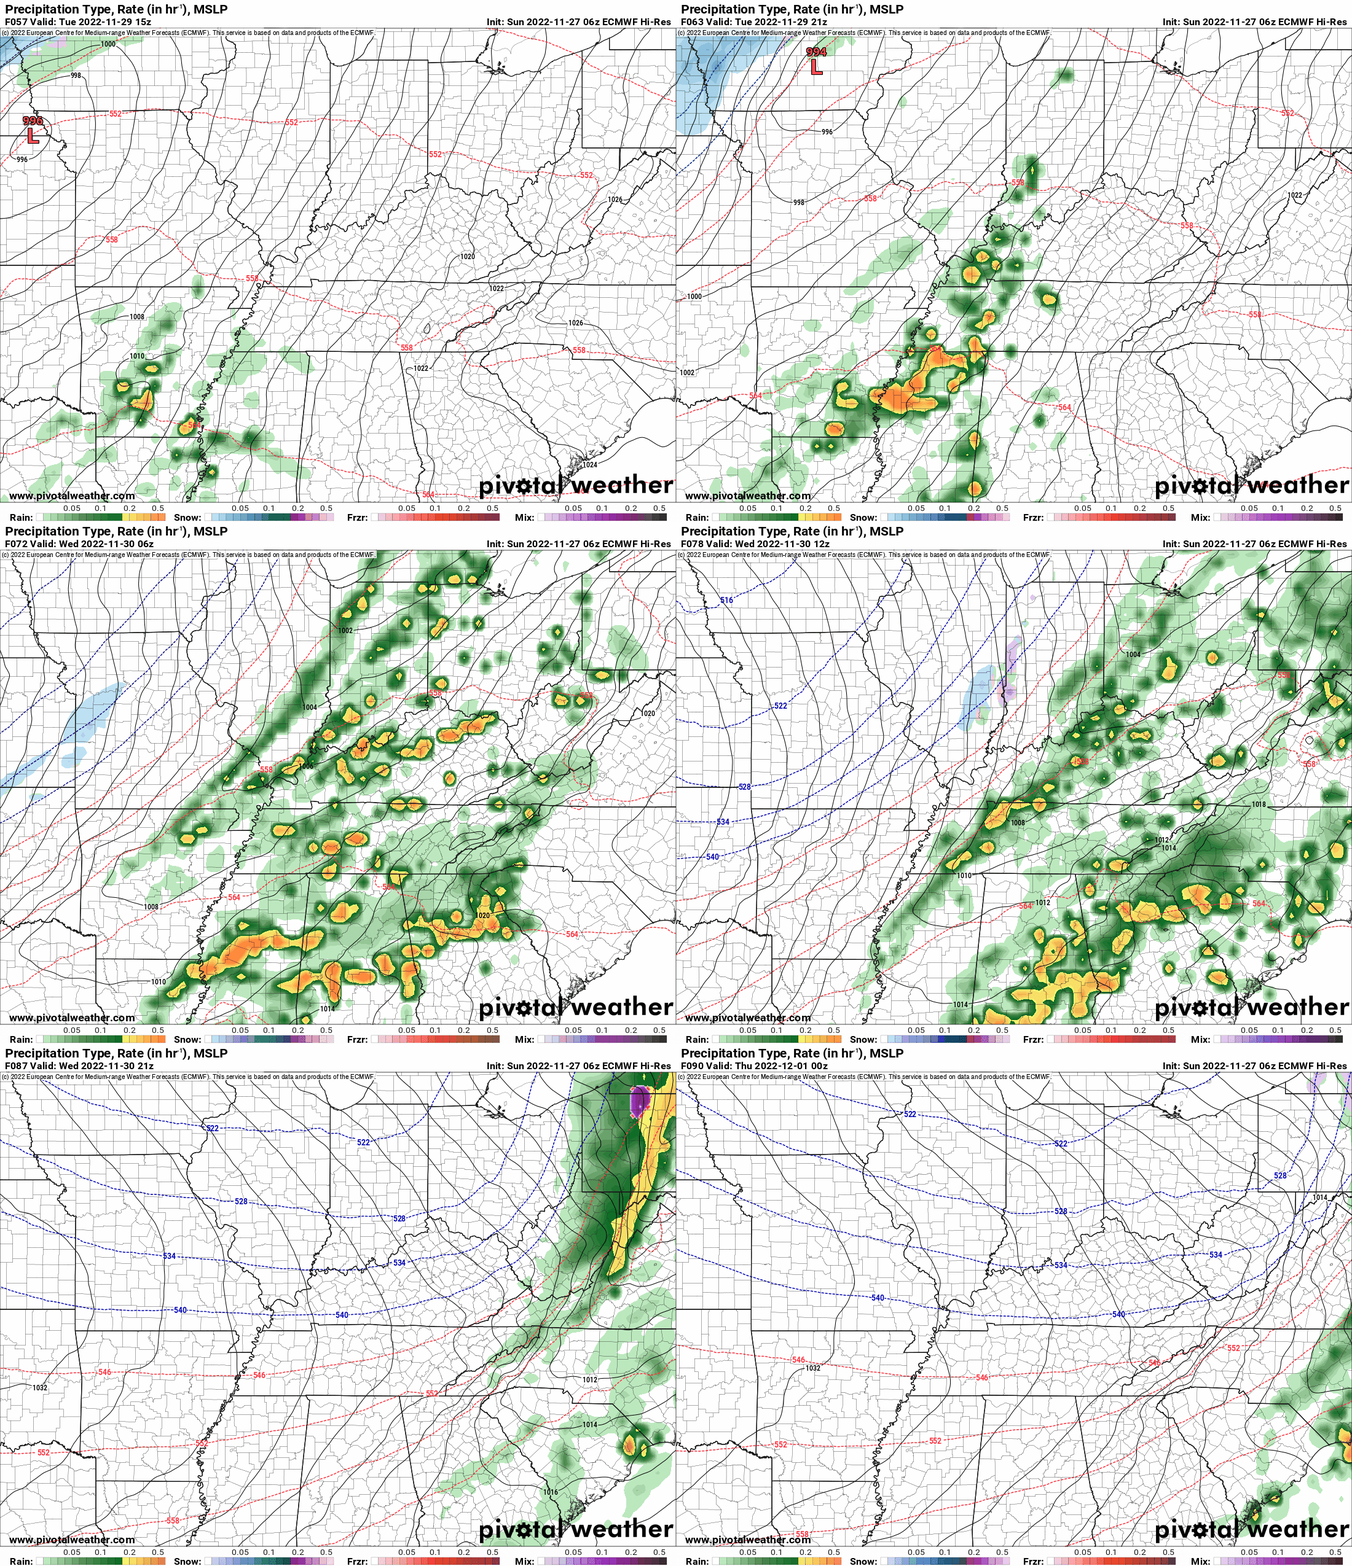
.
SCROLL DOWN THE PAGE FOR UPDATES
Click on the words below to subscribe
Storm Tracking Links
Interactive local city-view radars. Clickable watches and warnings.
https://wtalk.co/B3XHASFZ
Backup radar site in case the above one is not working.
https://weathertalk.com/morani
Regional Radar
https://imagery.weathertalk.com/prx/RadarLoop.mp4
*NEW* Zoom interactive radar (with storm chaser streams)
https://wtalk.co/AVWG7GM7
Real time lightning tracker system two.
https://map.blitzortung.org/#5.02/37.95/-86.99
Lightning Data (zoom in and out of your local area)
https://wtalk.co/WJ3SN5UZ
The app is for www.weathertalk.com subscribers. Subscriber first and then download the app.
Apple users click here. Android users click here.
What you need to know
Key Points
- There is a risk of severe thunderstorms Tuesday afternoon into early Wednesday morning. The primary time of concern will be 3 PM Tuesday through 3 AM Wednesday.
- Have your Beau Dodson Weather app on. Check it. Make sure you have not logged out of the app. Check your accounts to make sure they are up to date. Do that my logging into the www.weathertalk.com website. Click here www.weathertalk.com
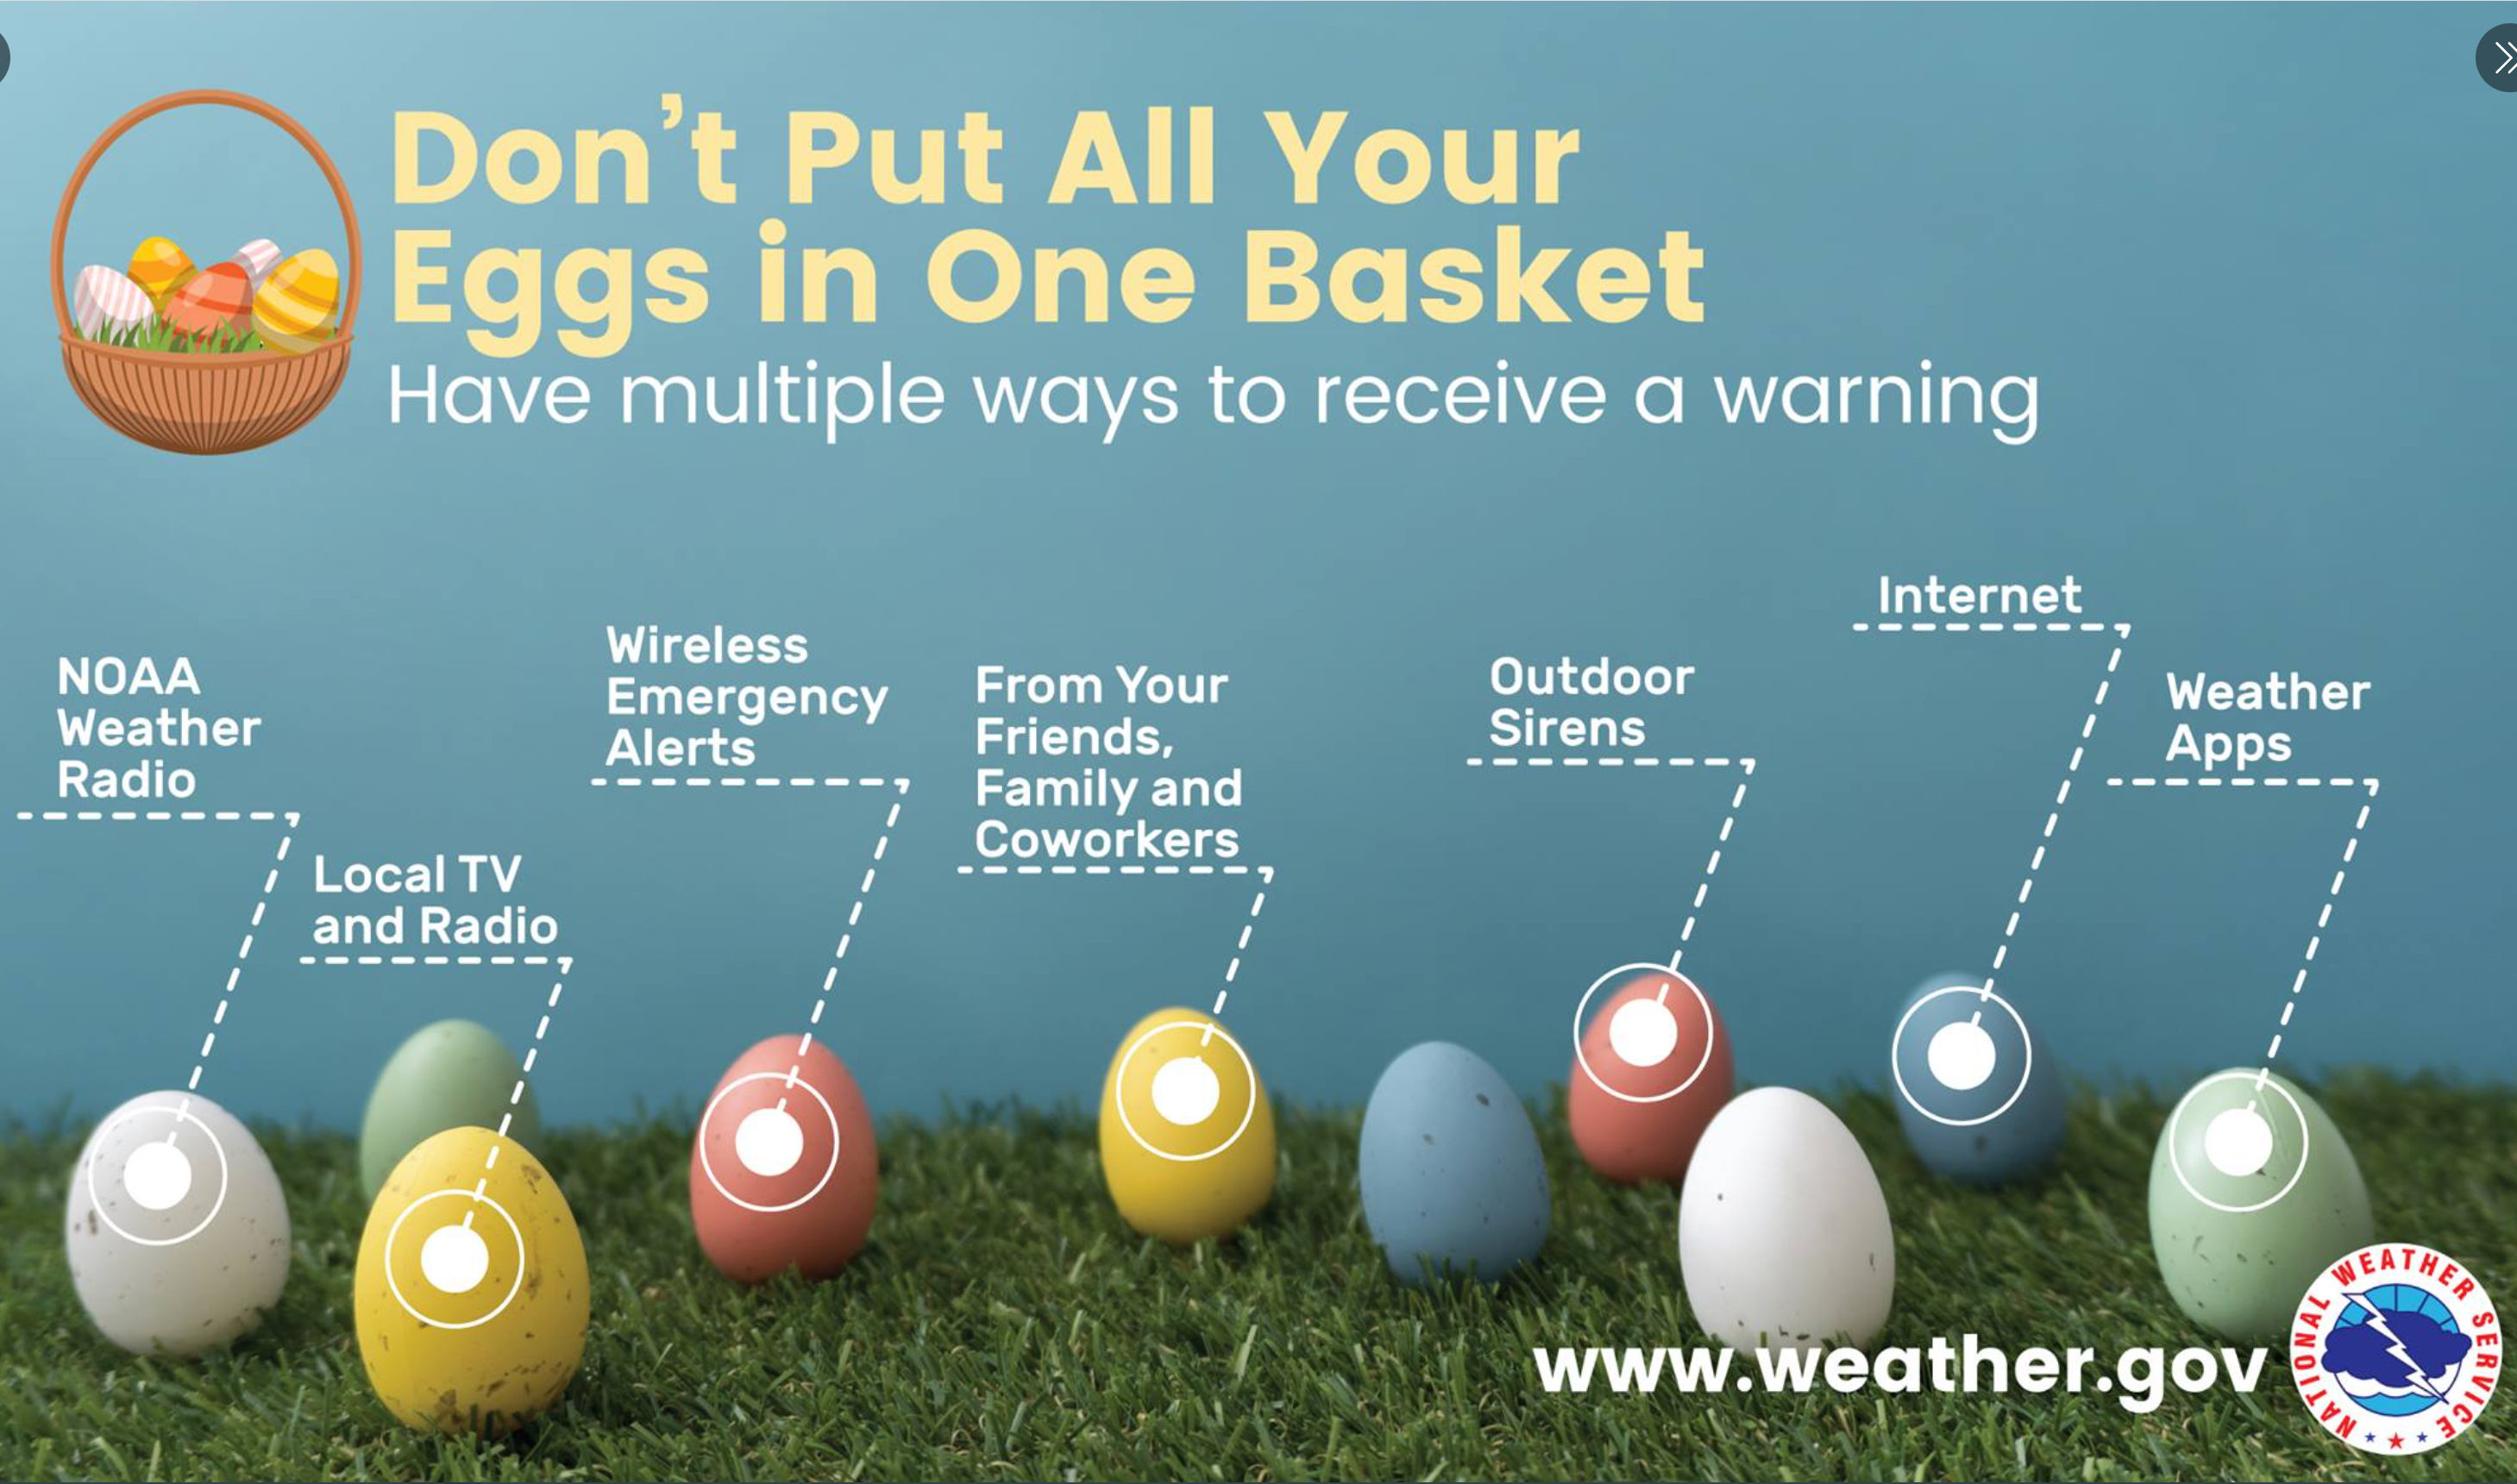
- Have THREE to FIVE ways of receiving your severe weather warnings.
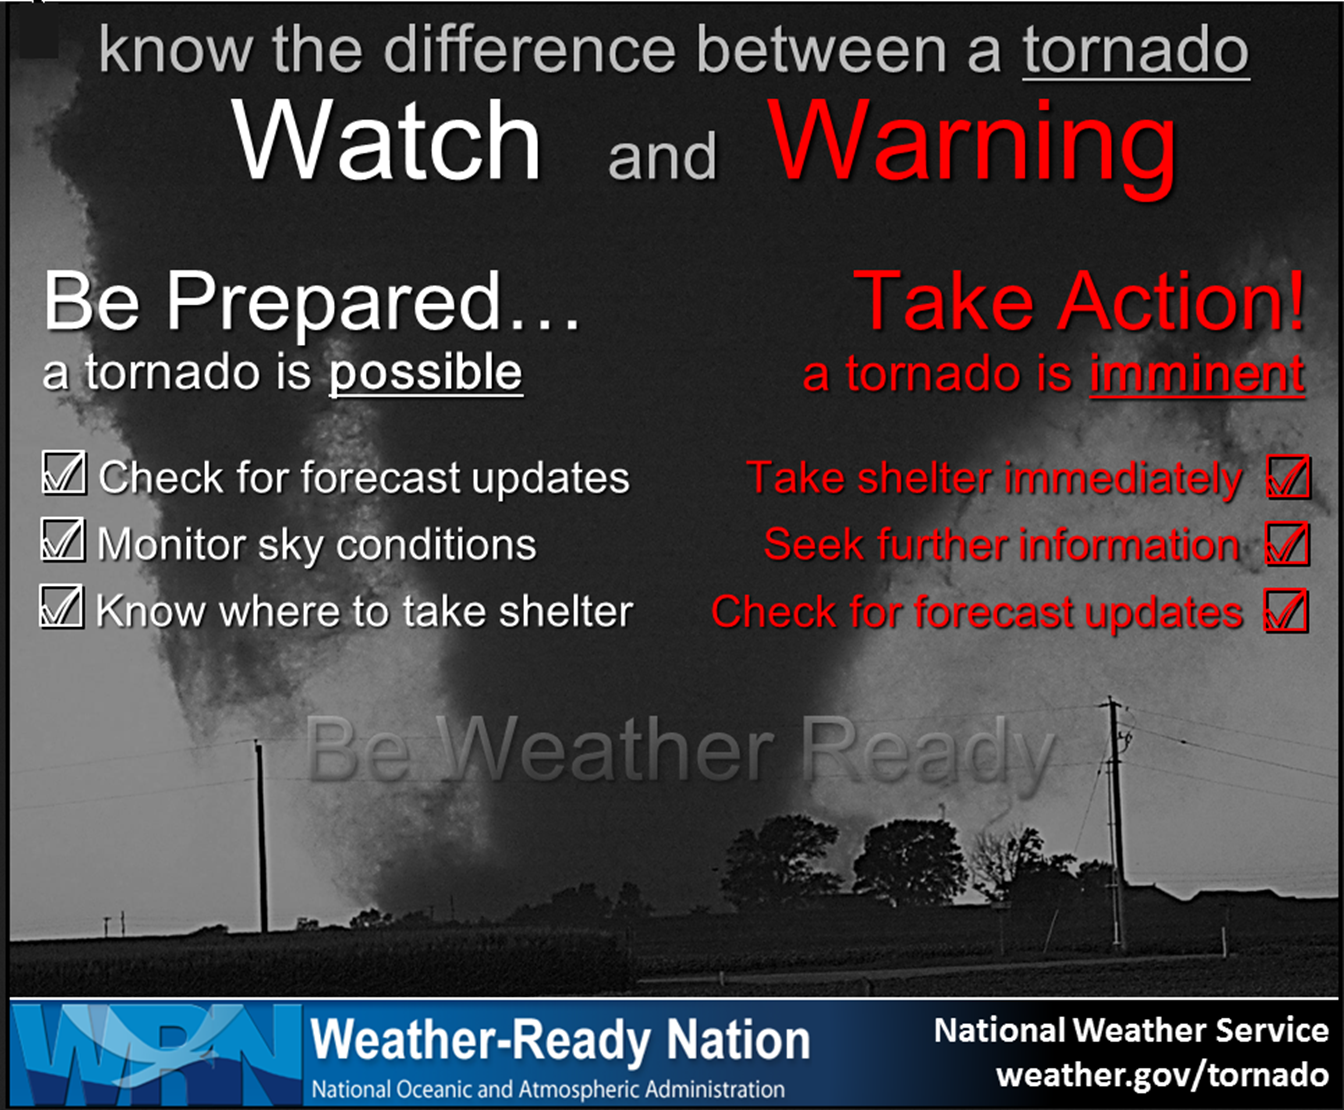
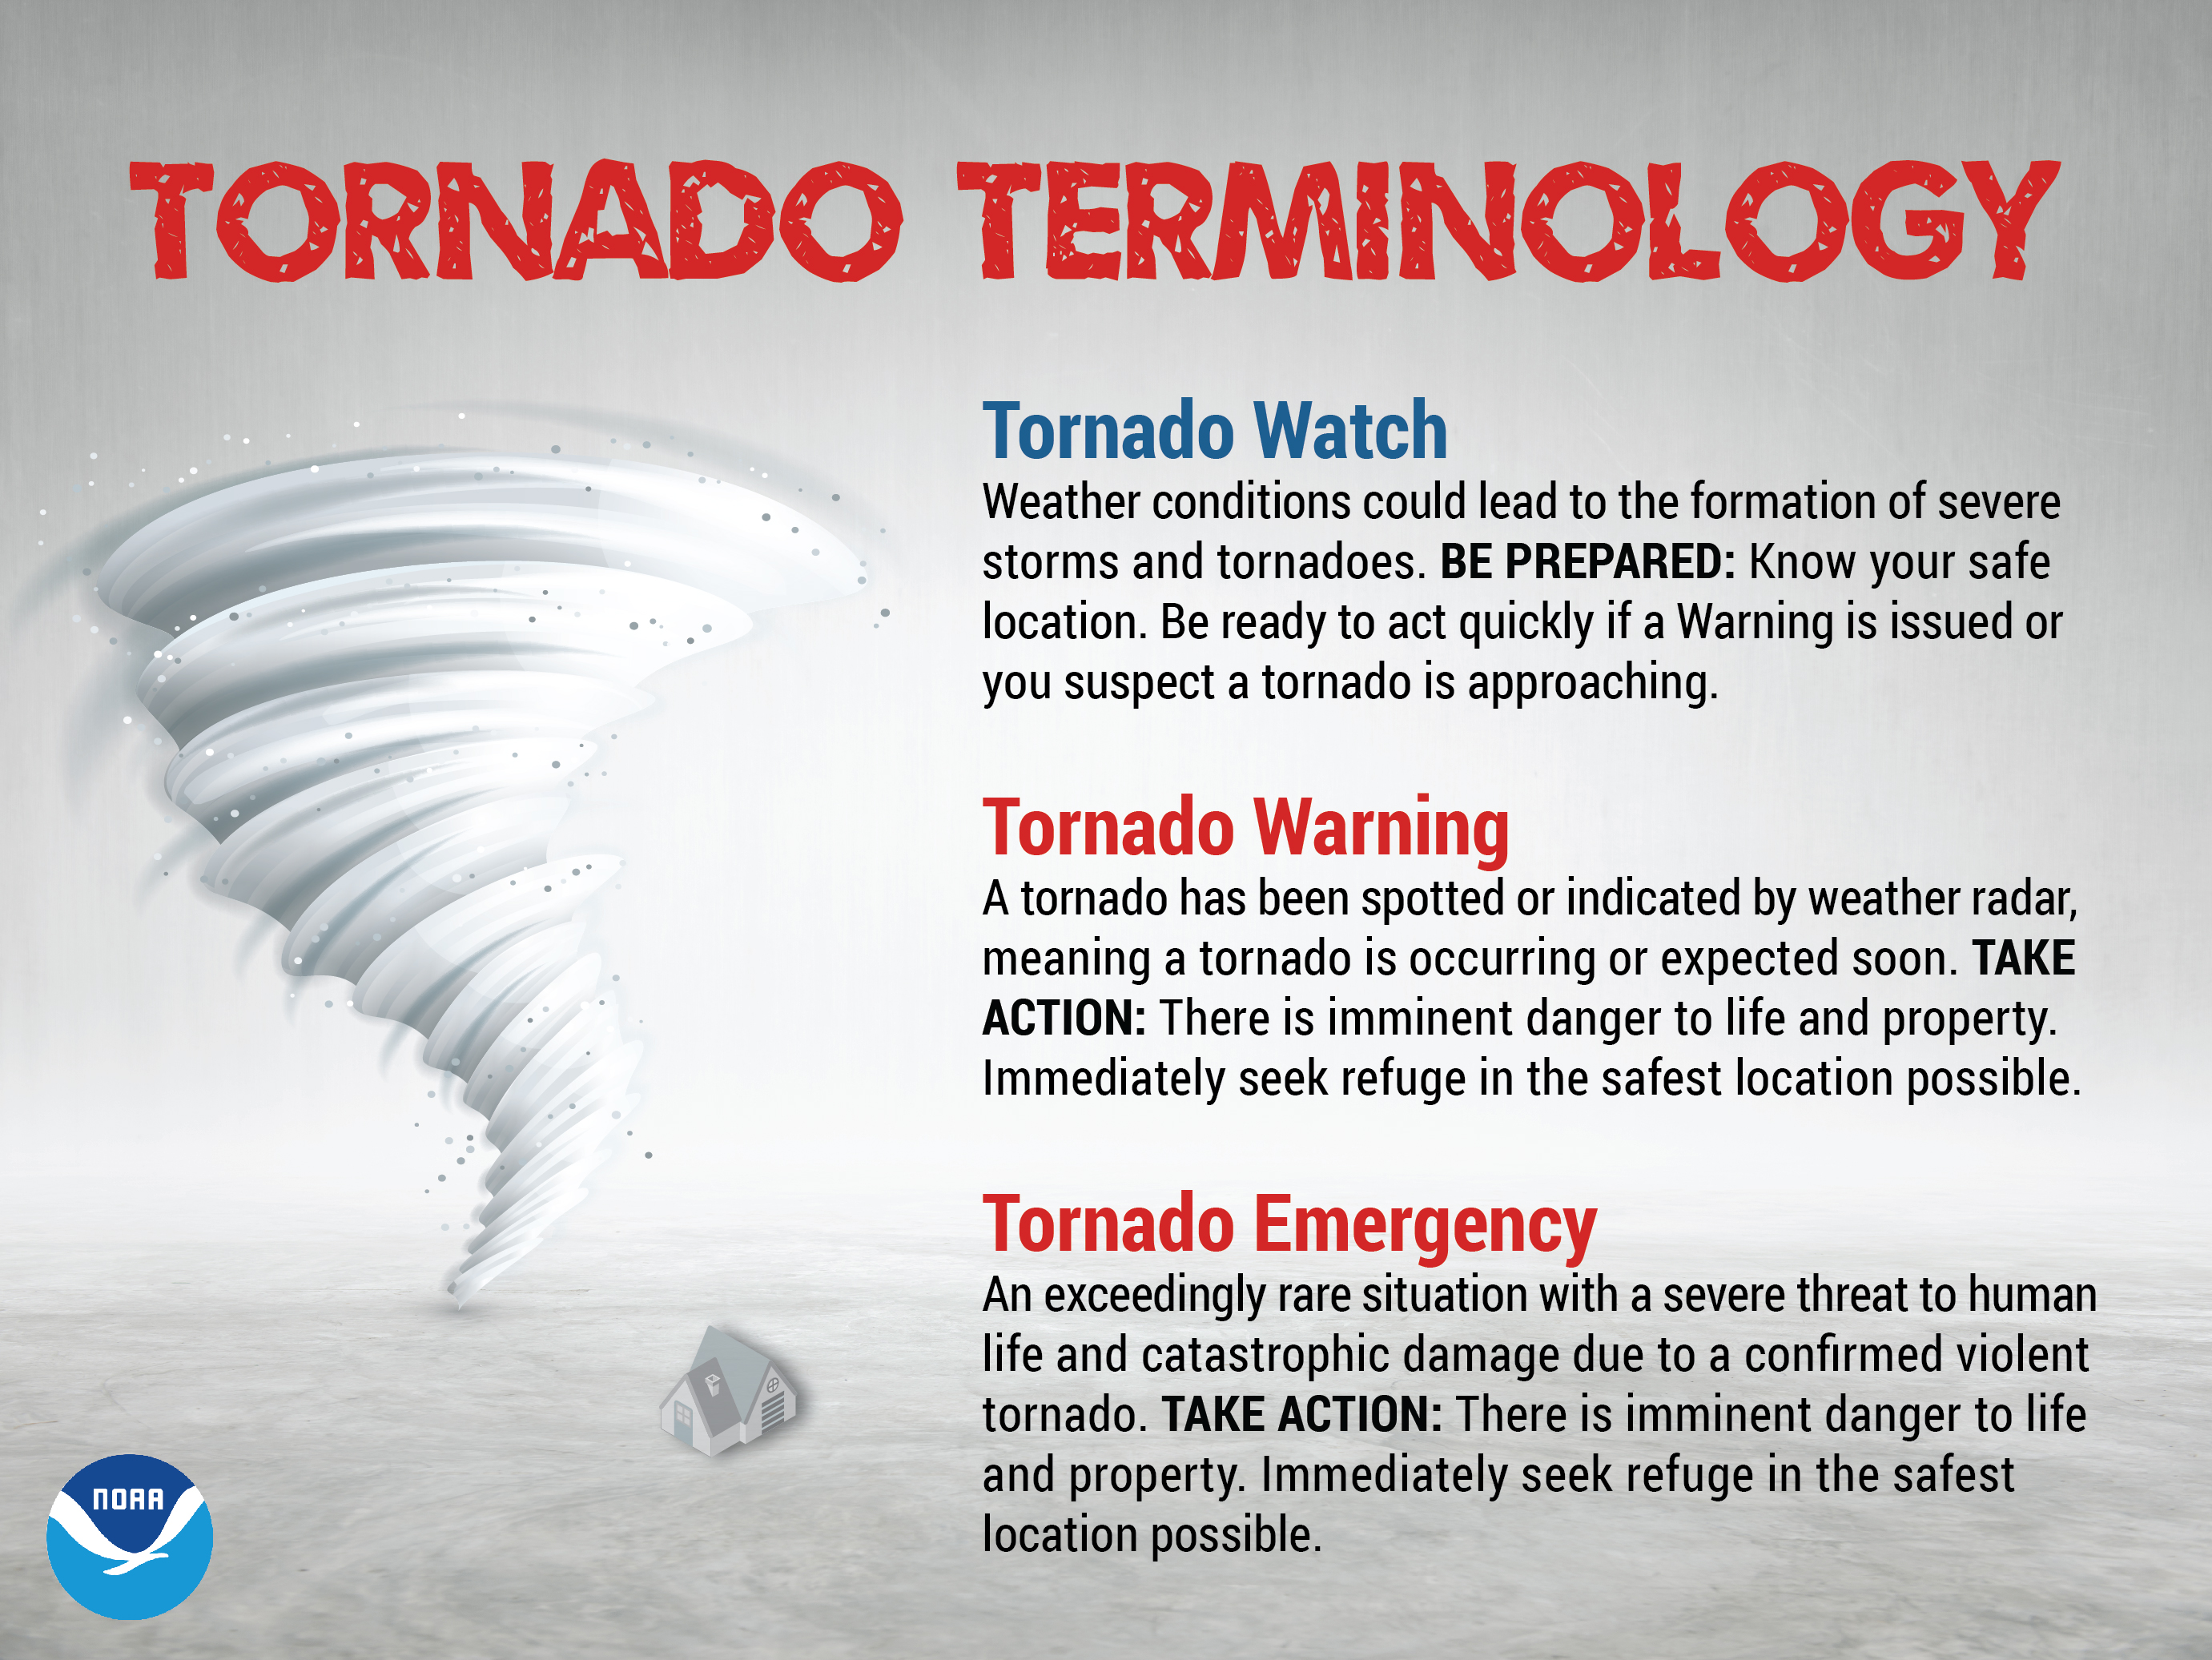
- Remember, a watch means to monitor updates. A warning means to seek shelter. A warning is a higher threat and means to seek shelter immediately. Severe weather may occur in or near your location.
.

Here is Facebooks’ Severe Weather Q&A threads.
Link https://www.facebook.com/beaudodsonweather
.
The latest blog updates will be posted here at the top of Beau’s severe weather blog.
Tuesday, November 29, 2022
10:45 PM
A line of storms will push across the region over the coming hours. It is currently moving through southeast Illinois into the Missouri Bootheel.
This line of storms will produce strong and gusty wind.
The threat of actual severe weather is minimal.
Gusty wind will continue behind the cold front. Gusts up to 45 mph will be possible.
This will be the end of the severe weather event.
.
9:30 PM
The heaviest storms have moved off to the east/southeast.
The line of storms forming in IL/MO is the cold front. A few of those storms could produce small hail and gusty wind.
The threat of severe weather the rest of tonight is low. Perhaps not zero with the front, but overall I am not concerned.
Expect gusty winds behind the cold front. Wind gusts of 20 to 40 mph will be possible as the colder air arrives.
All in all, it appears we have skated by on this one. Just one severe thunderstorm warning, thus far. Not too bad.
Worst of the weather has been to our south where it was expected to be.
7:39 PM
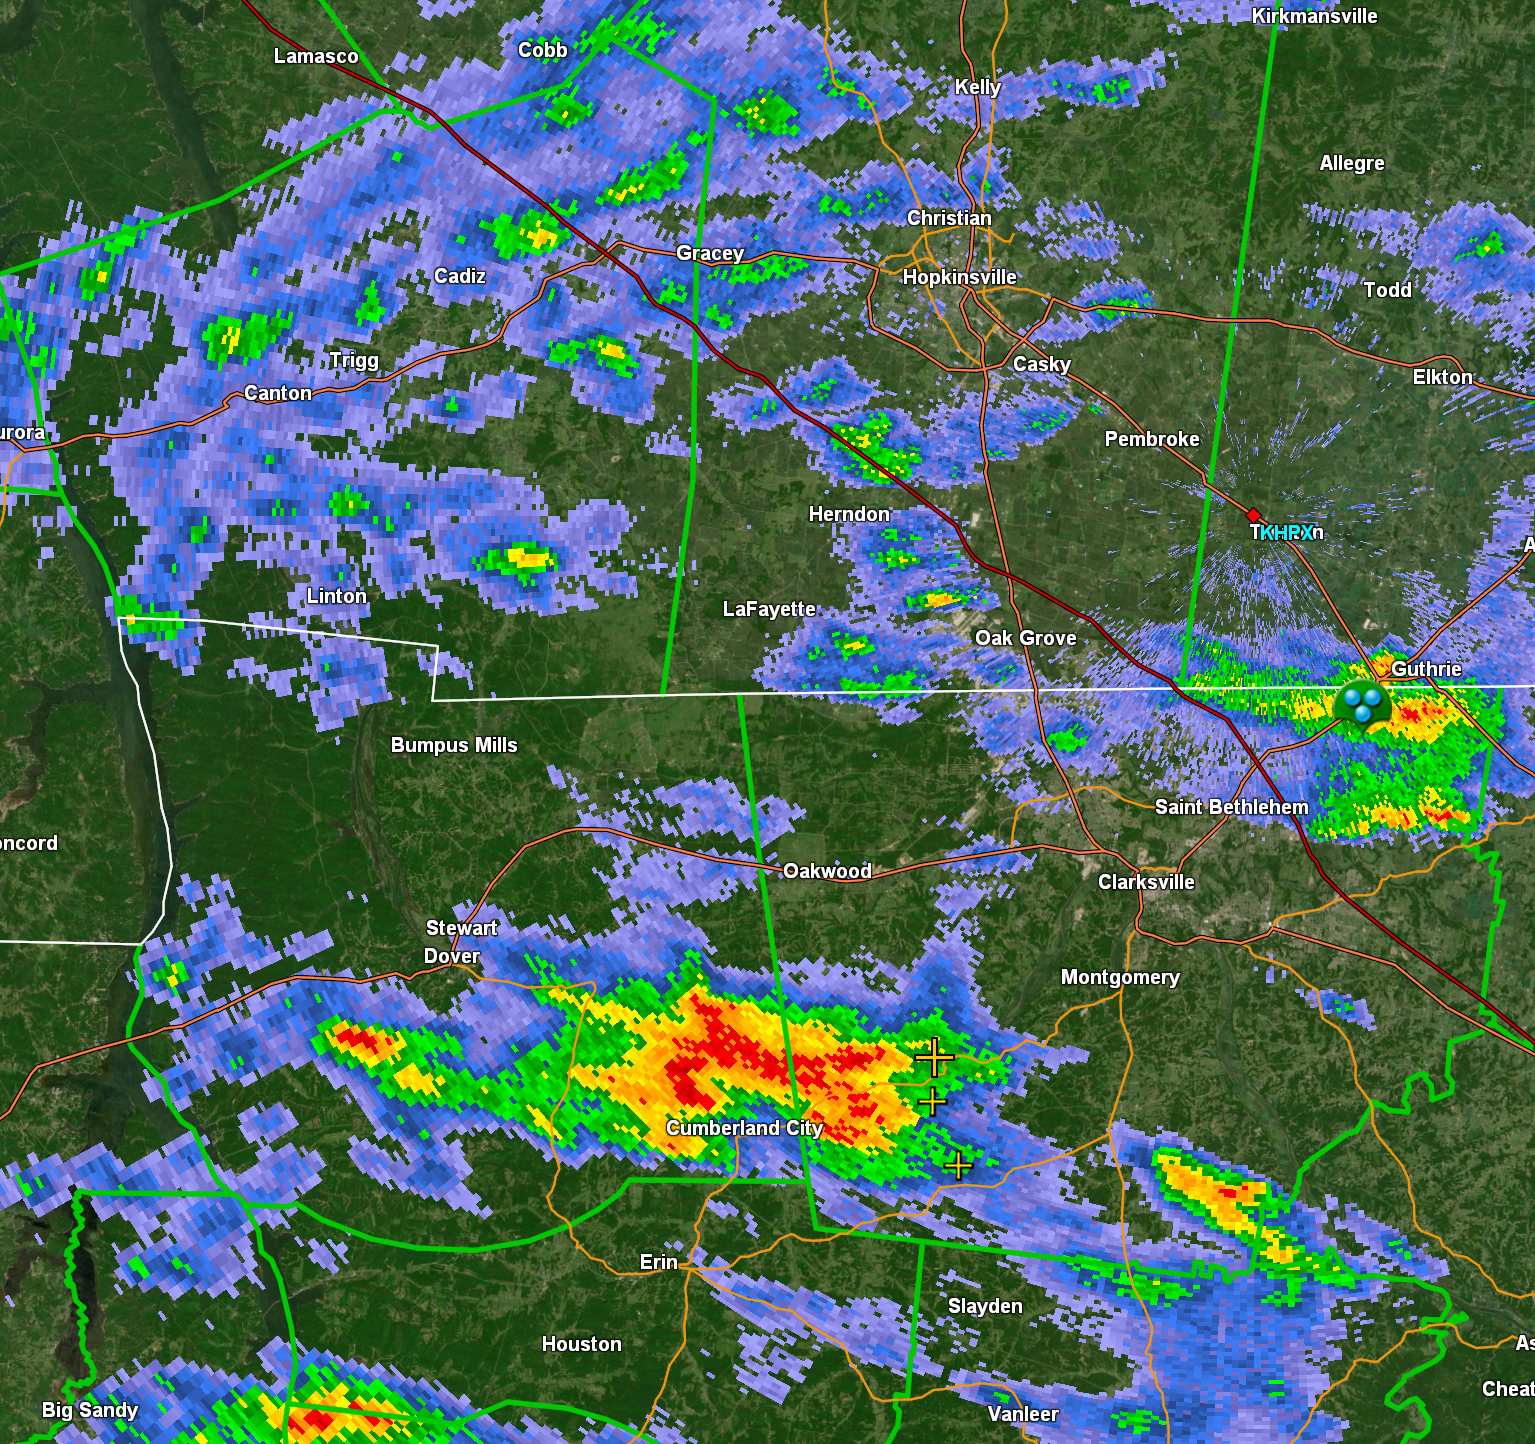
Another supercellular storm entering southern Todd County, KY. My far eastern forecast area.
Hail and gusty wind likely with the storm.
Radar https://weatherobservatory.com/radar_hoptown.htm
.
7:15 PM
I am tracking a small supercellular storm moving towards Christian and Todd Counties. Right now, it is not severe.
Radar https://weatherobservatory.com/radar_hoptown.htm
6;45 PM
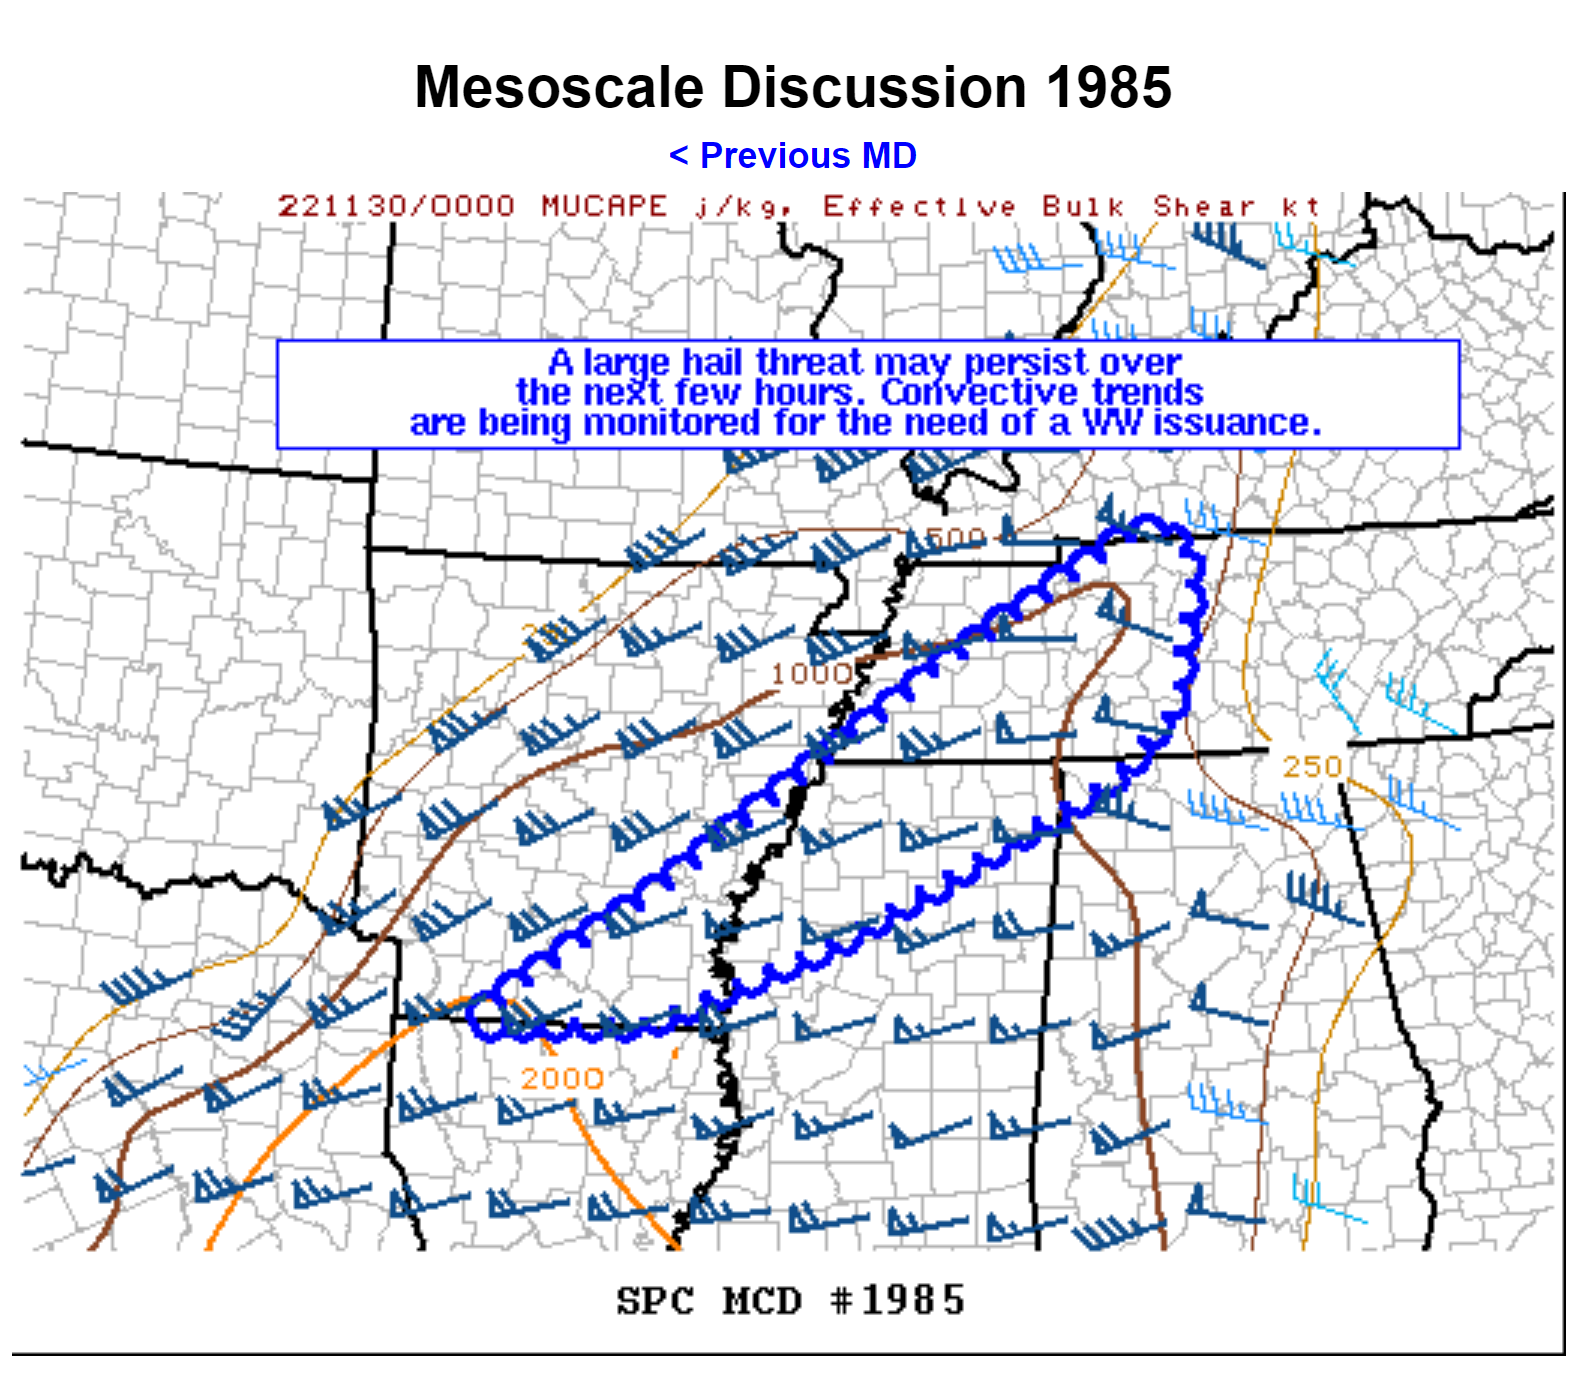
The Storm Prediction Center is monitoring the blue circle zone for a possible severe thunderstorm watch. A 40% chance of a watch.
The main concern will be hail and gusty winds. This clips my southeast counties.
,
5:40 PM
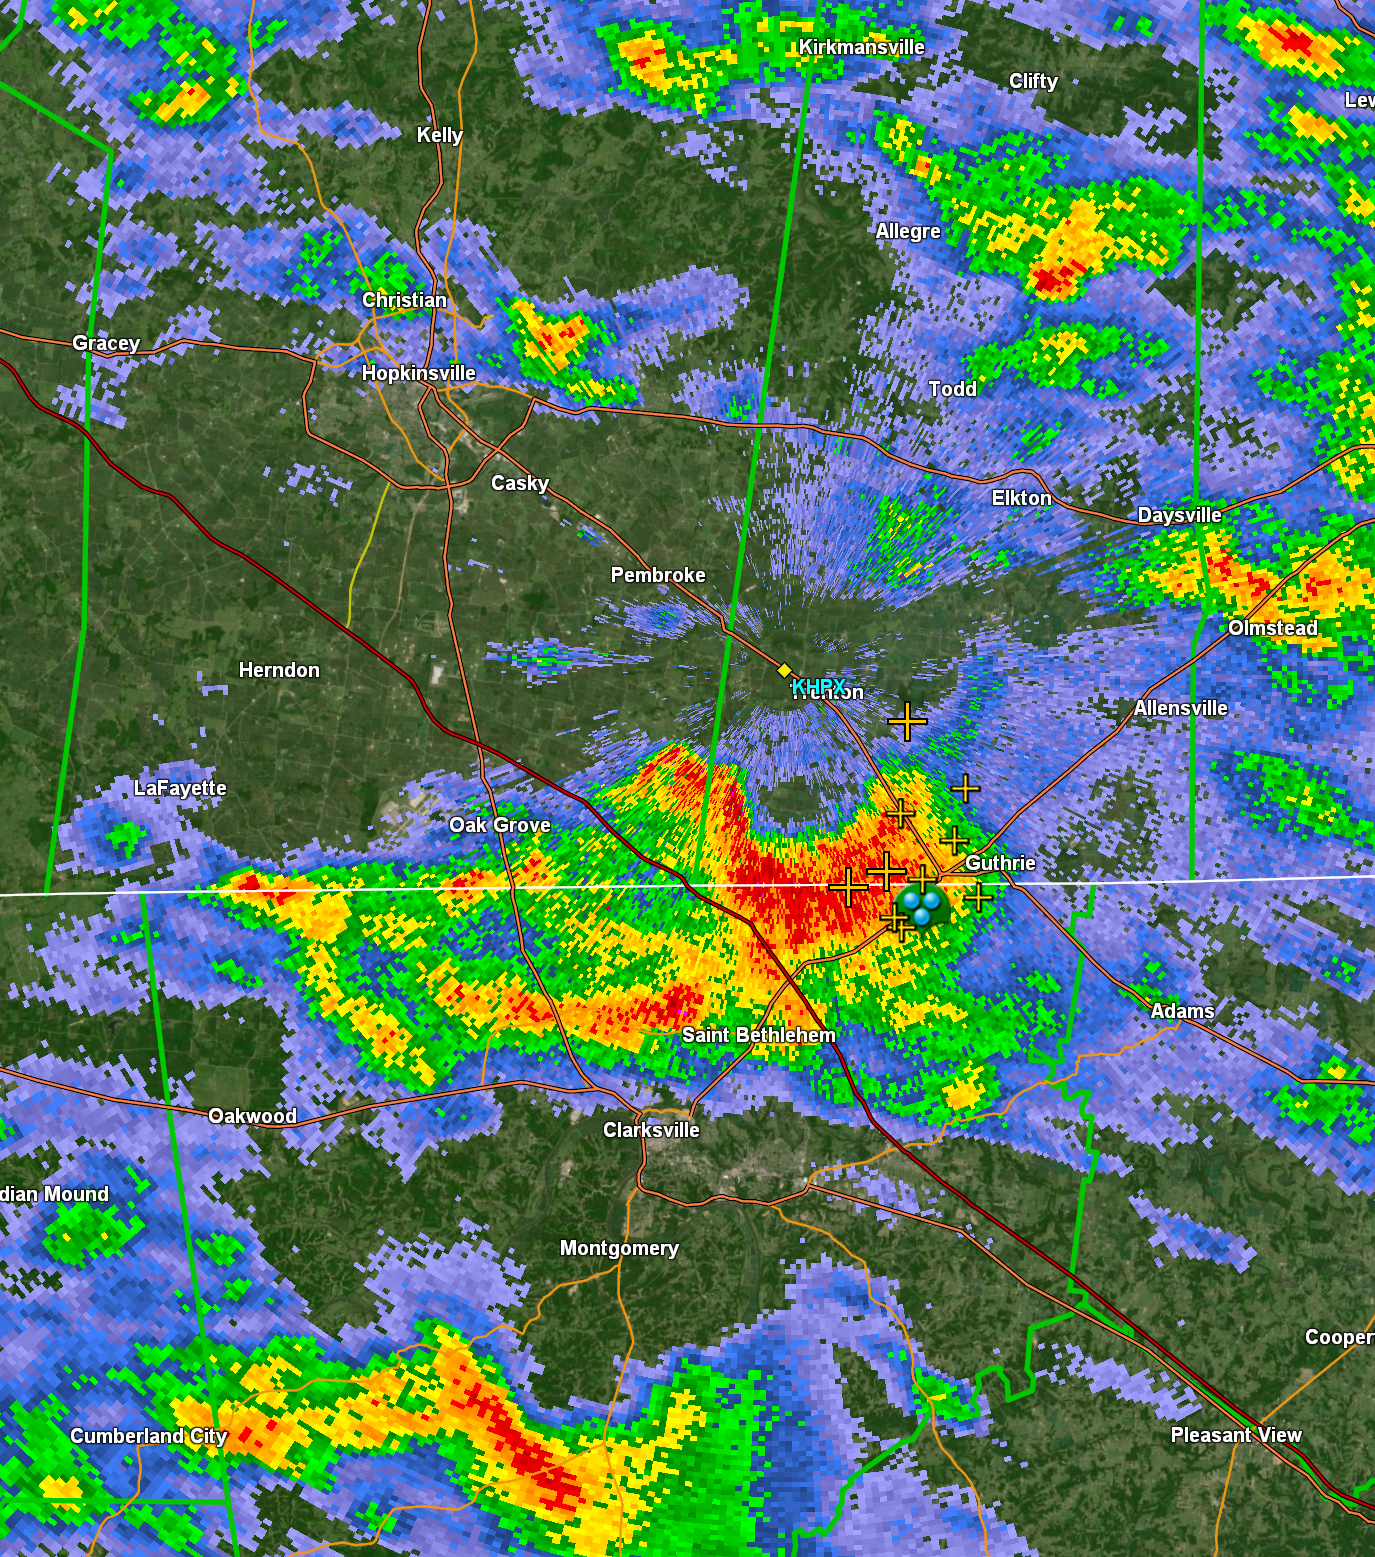
Radar https://weatherobservatory.com/radar_hoptown.htm
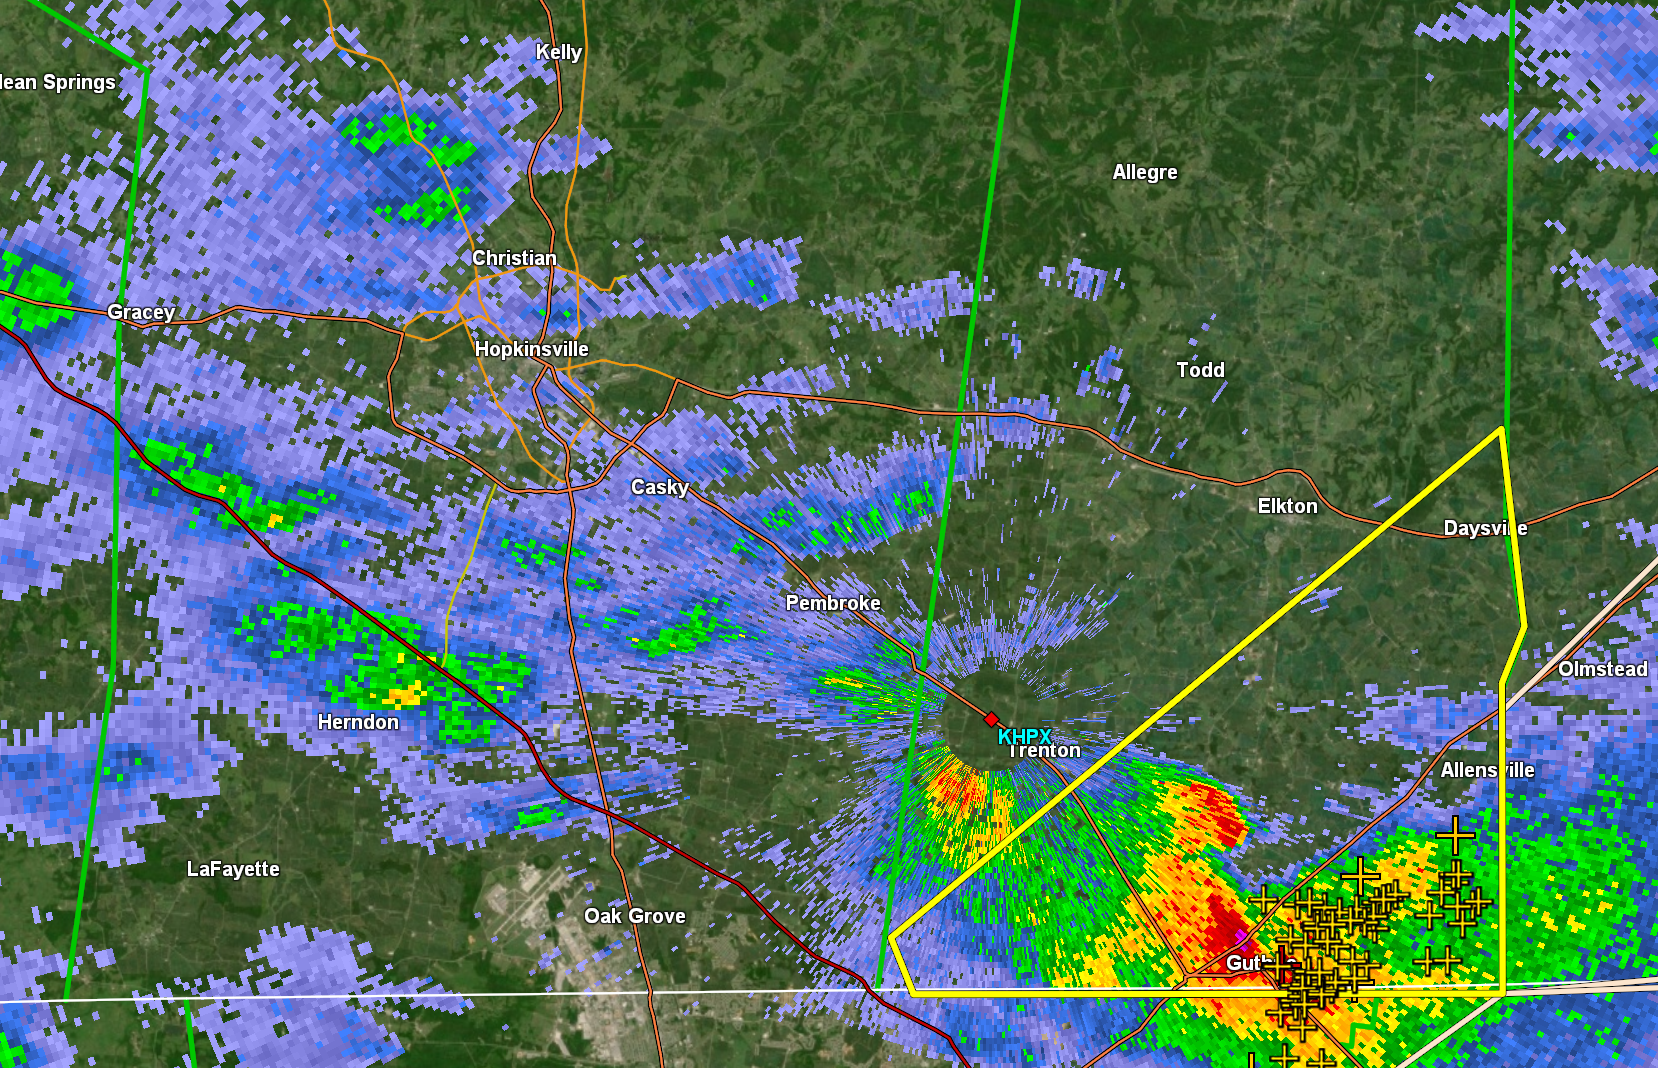
SEVERE THUNDERSTORM WARNING FOR...
  SOUTHERN TODD COUNTY IN SOUTH CENTRAL KENTUCKY...

* UNTIL 600 PM CST.

* AT 539 PM CST, A SEVERE THUNDERSTORM WAS LOCATED OVER GUTHRIE, OR
  10 MILES NORTHEAST OF CLARKSVILLE, MOVING NORTHEAST AT 70 MPH.

  HAZARD...60 MPH WIND GUSTS AND QUARTER SIZE HAIL.

  SOURCE...RADAR INDICATED.

  IMPACT...HAIL DAMAGE TO VEHICLES IS EXPECTED. EXPECT WIND DAMAGE
           TO ROOFS, SIDING, AND TREES.

* THIS SEVERE THUNDERSTORM WILL REMAIN OVER MAINLY RURAL AREAS OF
  SOUTHERN TODD COUNTY, INCLUDING THE FOLLOWING LOCATIONS...
  ALLENSVILLE.
5:35 PM
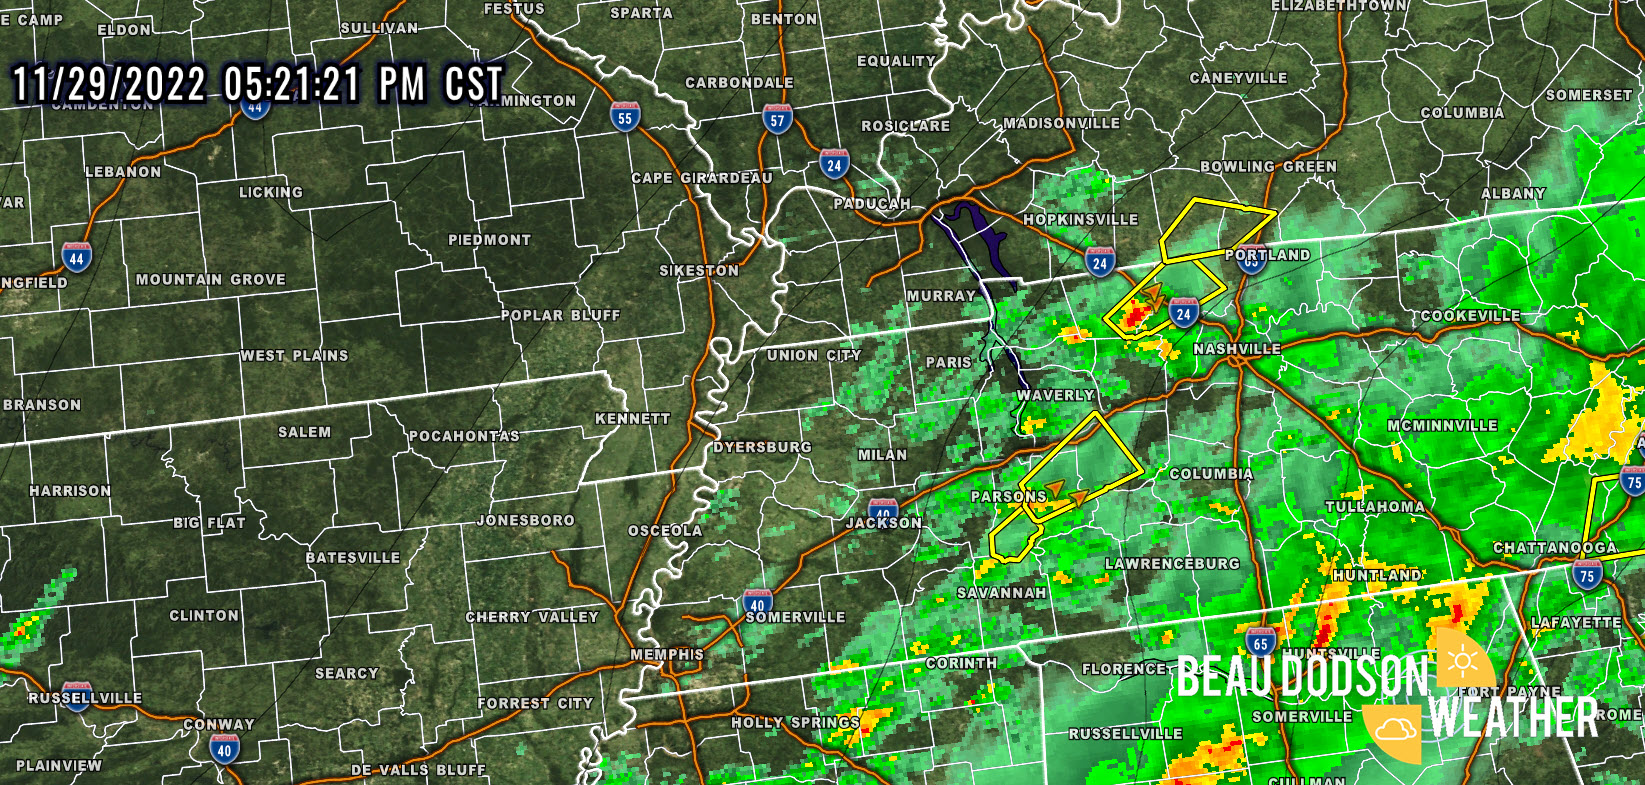
These are the storms I have been waiting on all day. They are forming over west TN and the heavier ones are just east of my forecast counties. Hrrr model guidance kept showing this possibility. Keeping them just a tad east.
I am watching the lighter cells in west TN, but so far everything is weak.
Some storms will eventually form over MO/IL along the incoming gusty cold front.
For now, no severe concerns. So far, so good. Hopefully, we skate through this without any issues. Feeling pretty good right now.
.
.
5 PM
.
So far, so good.
Basically I call this a babysitting event. Meaning, i have to babysit radar and data. The risk is low, but not zero.
This has been a highly conditional event. Meaning, there are some ingredients missing (as we have mentioned over the past few days).
Storms to our south have been robbing us of higher dew points. Even though dew points are climbing into the upper 50s and lower 60s (across our southern counties) we still don’t have a lot of CAPE (energy for storms to tap into).
For now, I continue to monitor radar trends. If we can get through the next few hours, then the risk becomes less and less.
There will be a strong cold front move through the region tonight with 20 to 40 mph wind gusts. Keep that in mind.
Christmas decorations will blow around. Especially those inflatables. We don’t want Santa flying through the air. Kids might think he came early and missed their house!
🙂
I will be here through the evening. Not too concerned, at this point. But, we can’t say all clear, yet.
.
4:45 PM Update
I continue to monitor radars. So far, so good. The primary concern will be from now through midnight.
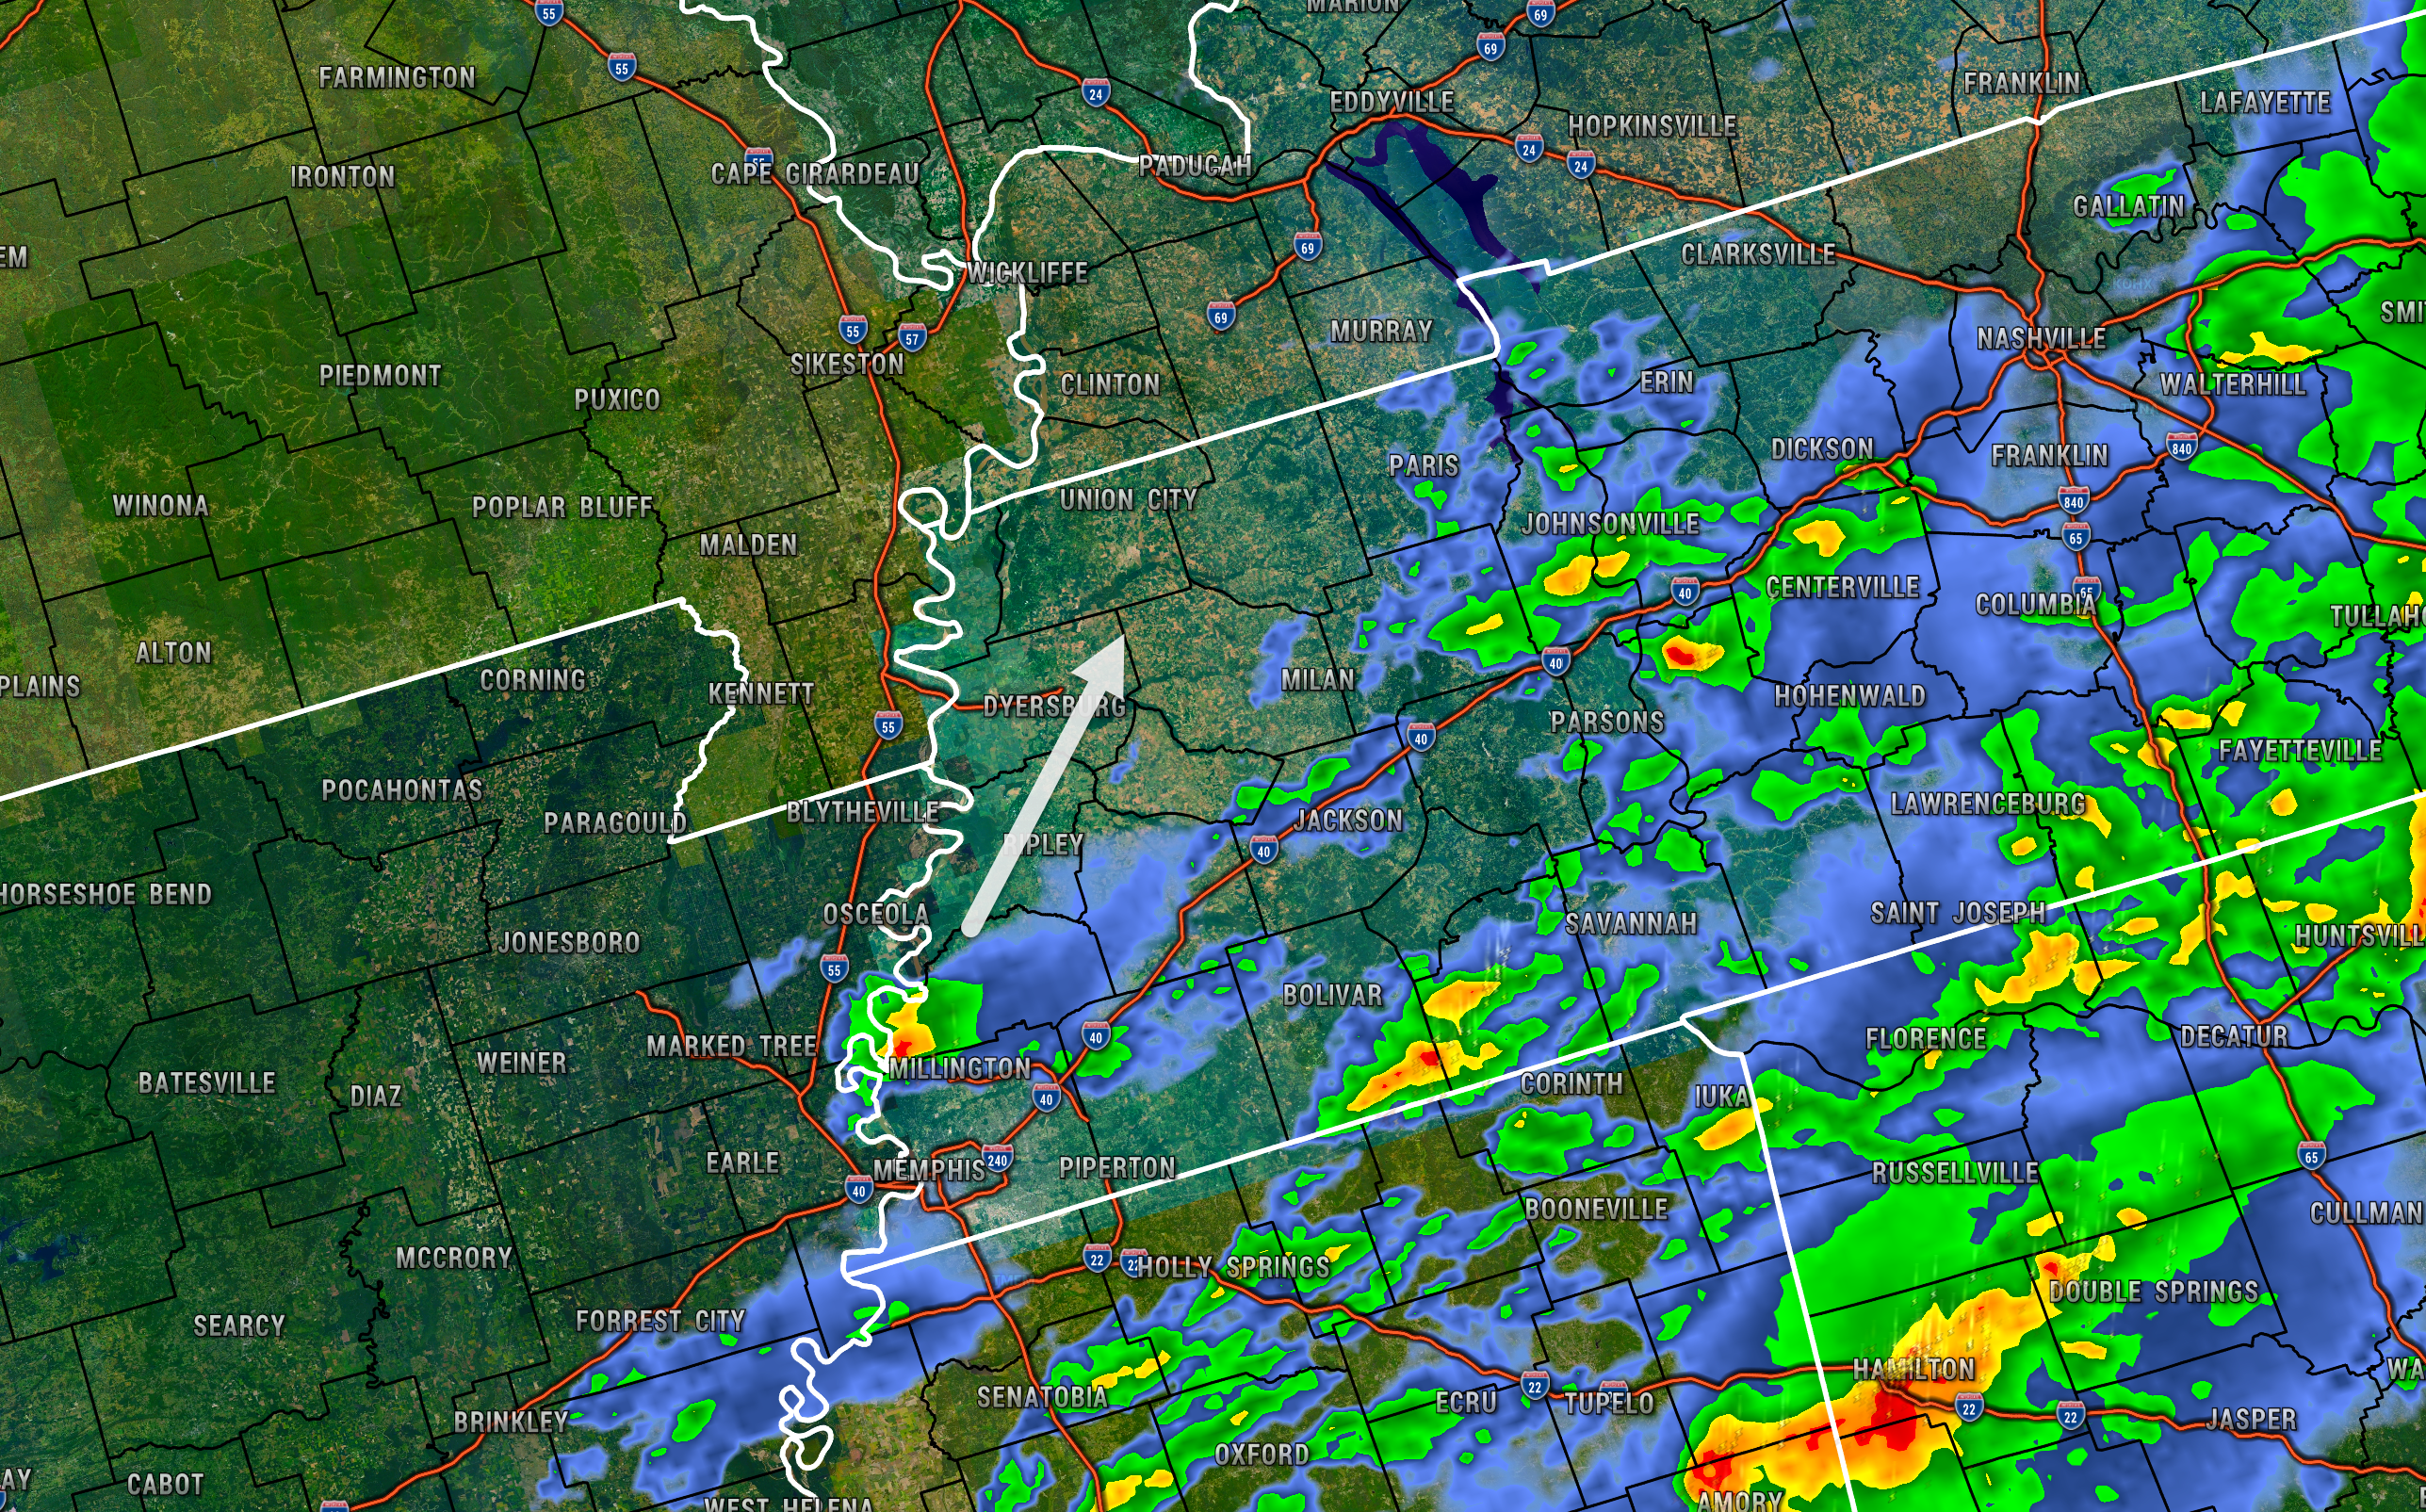
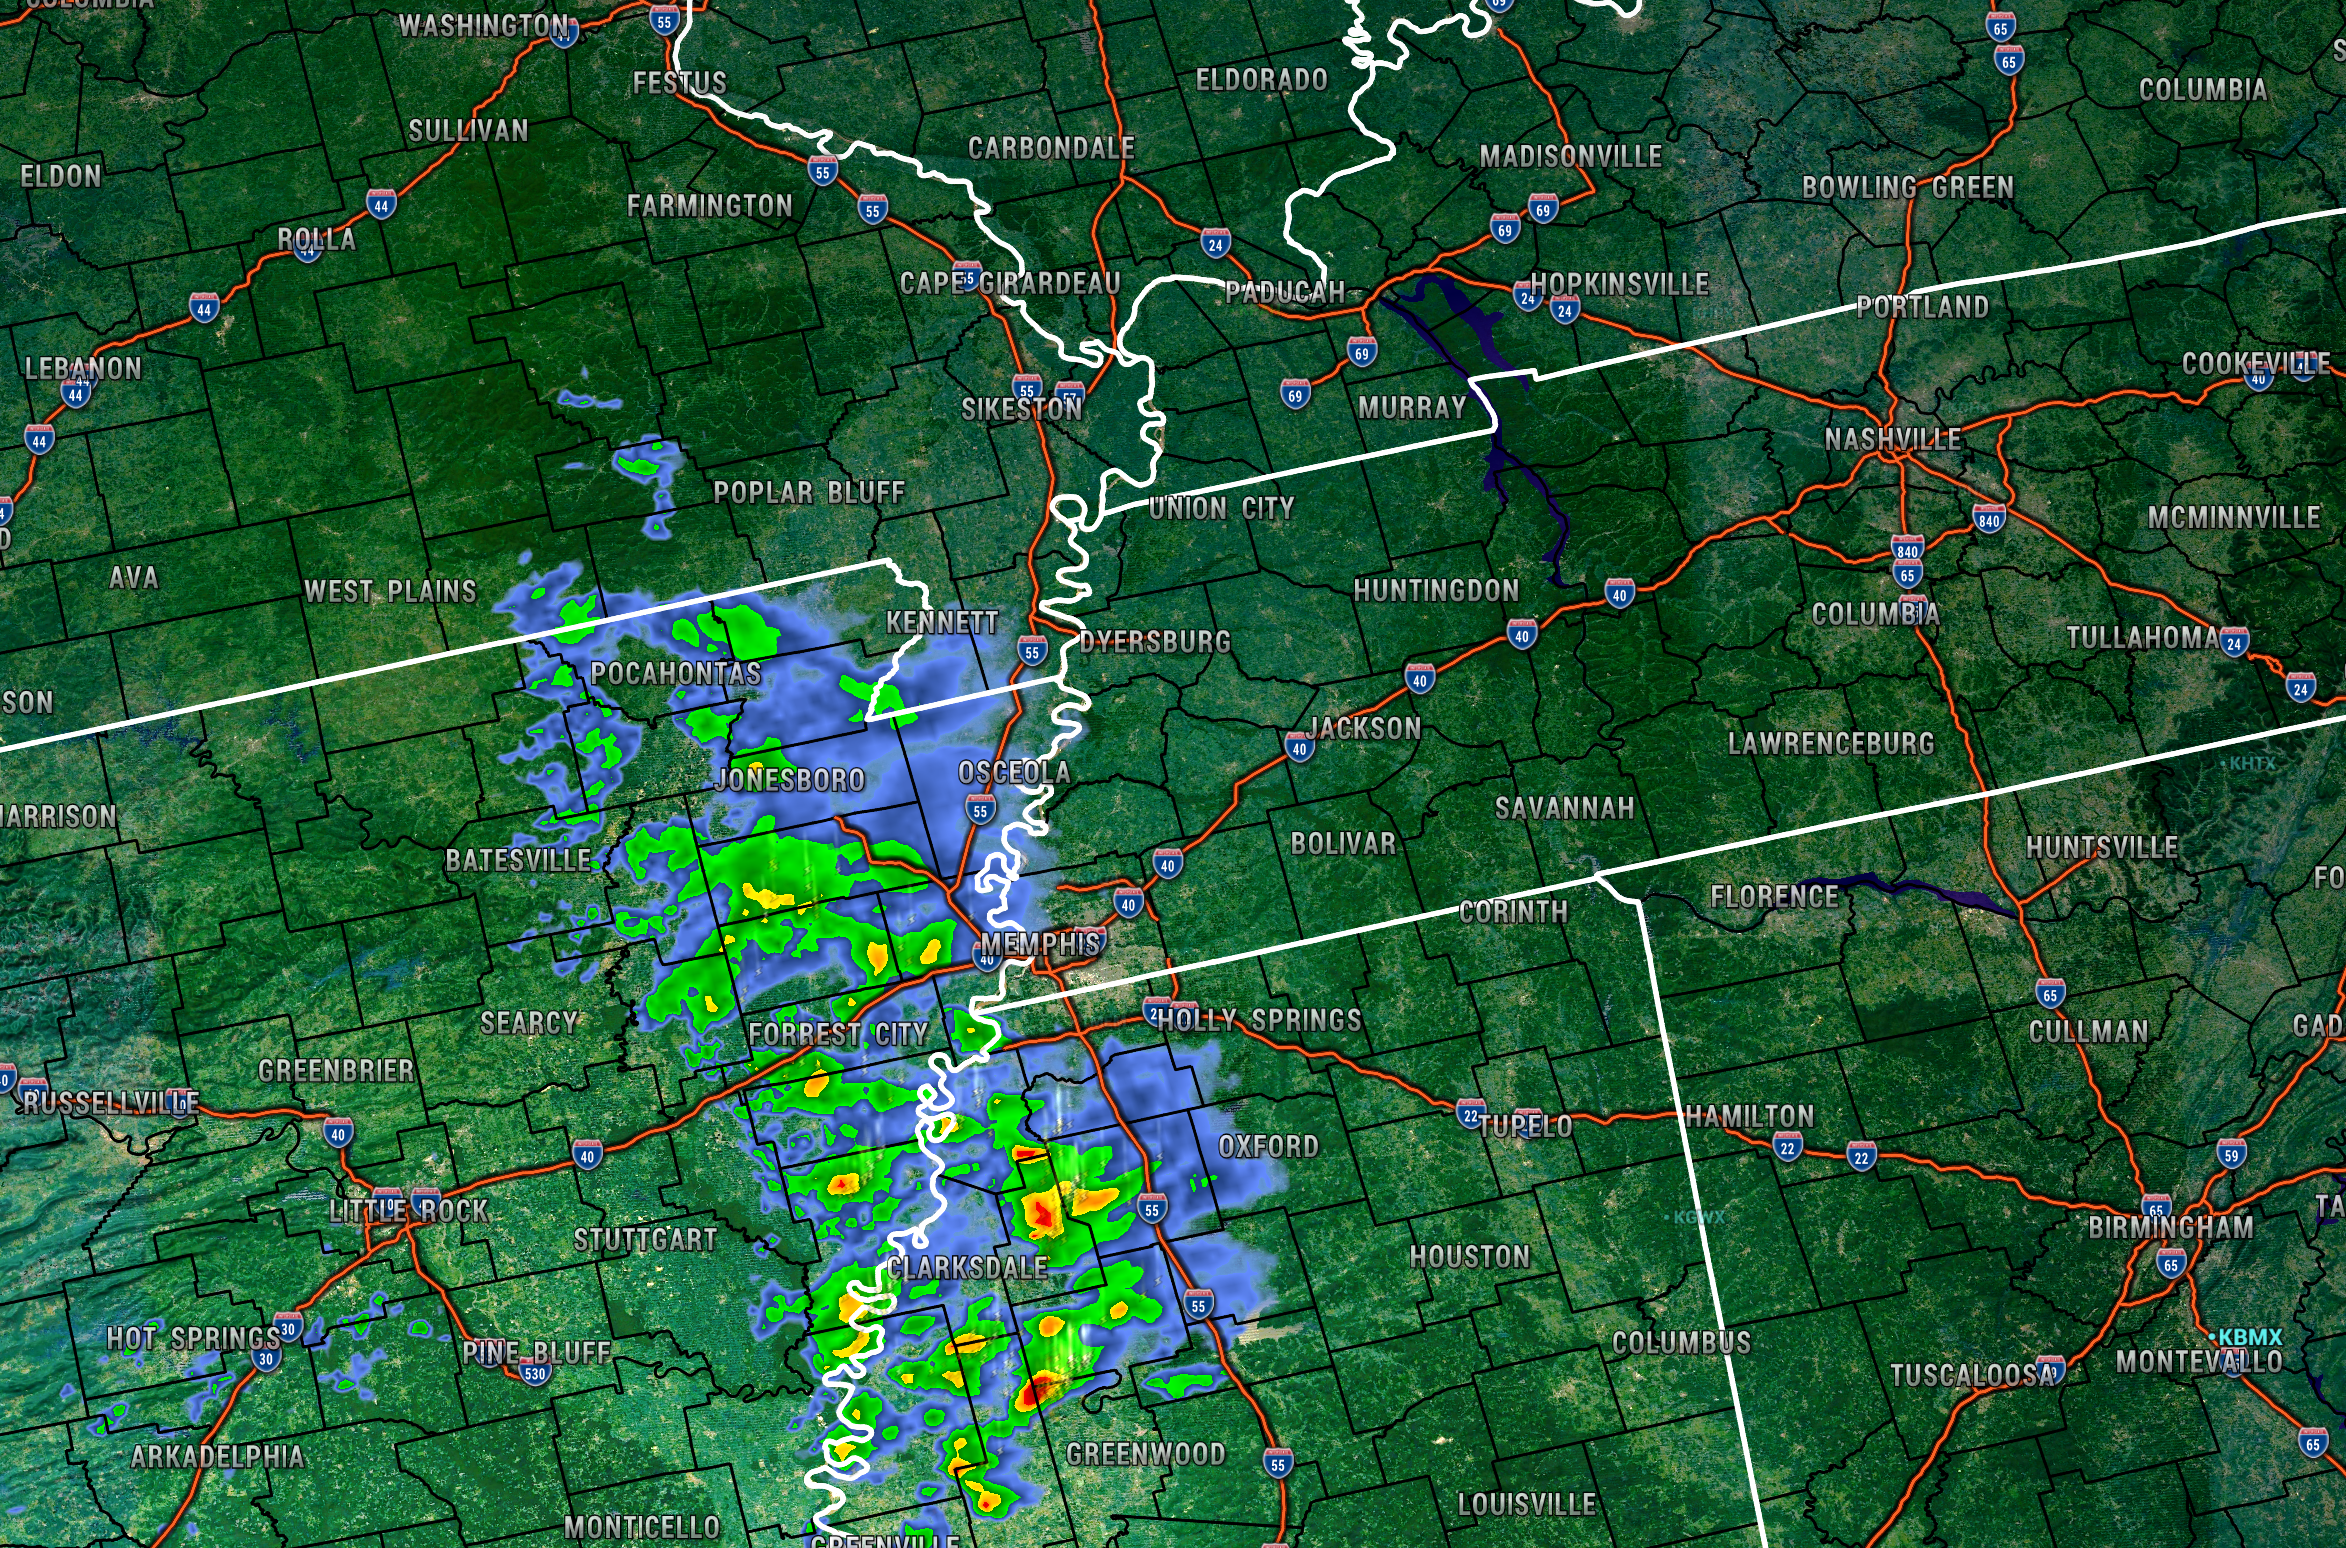
I am watching a thunderstorm that has tried to develop near Memphis. It is moving northeast at 60 mph.
It is struggling to gain strength. Perhaps the wind shear is too strong.
Here it is
Also, here is the latest future-cast radar.
Notice the cold front line of showers and storms coming in from the west.
I am watching any storms that form in western Tennessee as they move northeast.
.
2:45 PM Update
No changes.
I am watching moisture return behind the line of showers and thunderstorms that has been moving off to the east.
Radar shows a couple of showers. Nothing significant.
What I will be watching for next is a few storms forming in eastern Arkansas into northwest Tennessee. Perhaps the Missouri Bootheel.
Also, later this evening a line of storms right along the front in southeast Missouri and southern Illinois.
Hopefully, we can skate by this event with little or no severe weather activity. That isn’t a guarantee.
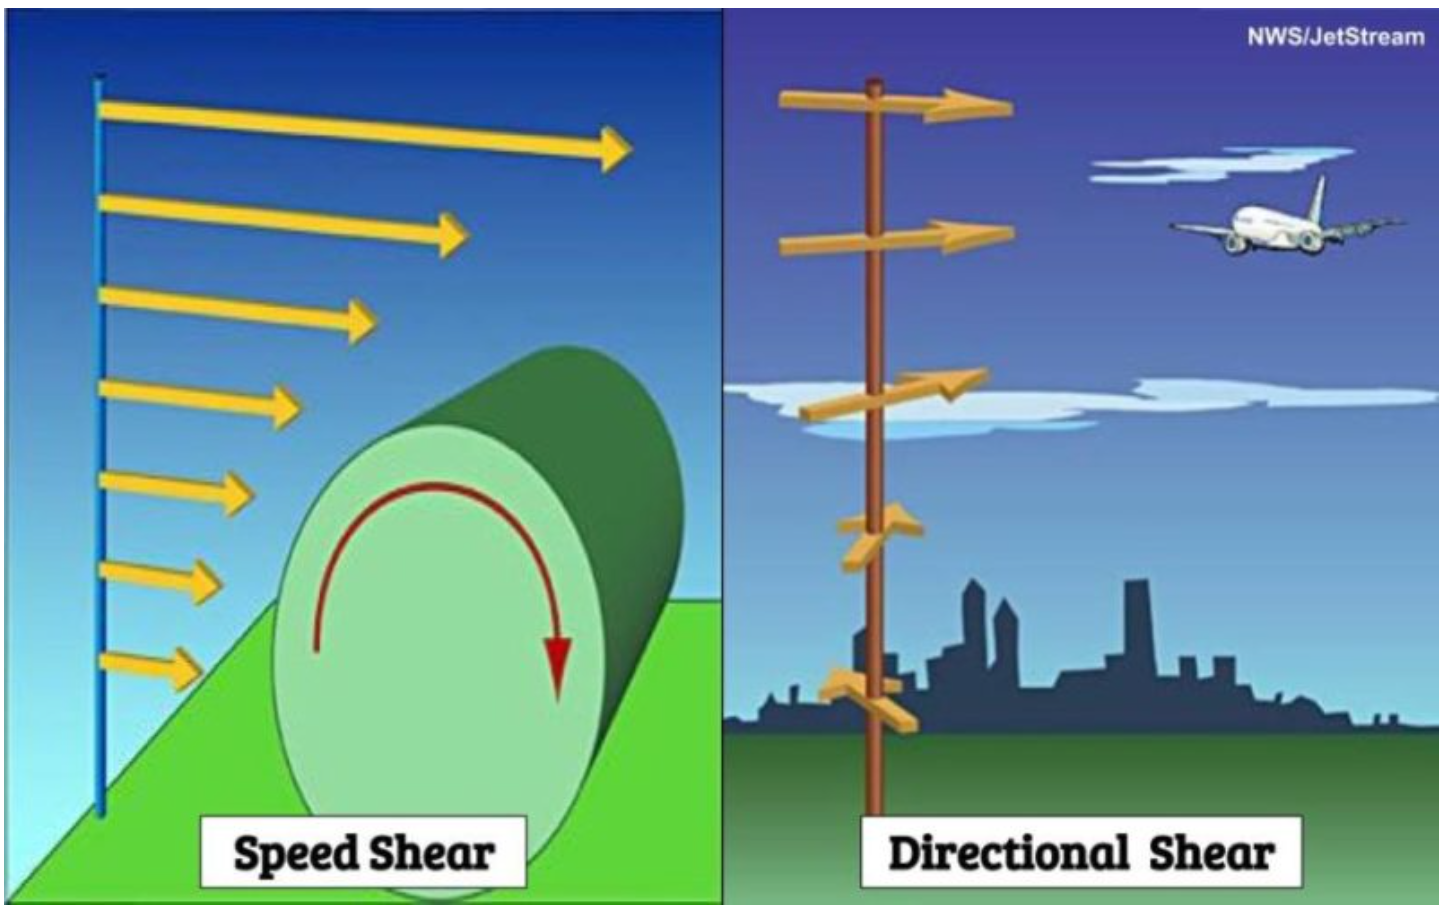
There is a considerable amount of wind shear for thunderstorms to tap into. Wind shear is turning of wind with height and an increase in wind speed with height.
We are lacking richer moisture which remains to our south. We are lacking higher CAPE values. Instability is lacking.
This is what I call a babysitting event. Meaning, meteorologists have to simply monitor radar and satellite until the cold front has pushed off to the east.
Overall, the severe weather risk is fairly low, but not zero.
.
2:15 PM Update
No watches or warning, at this time.
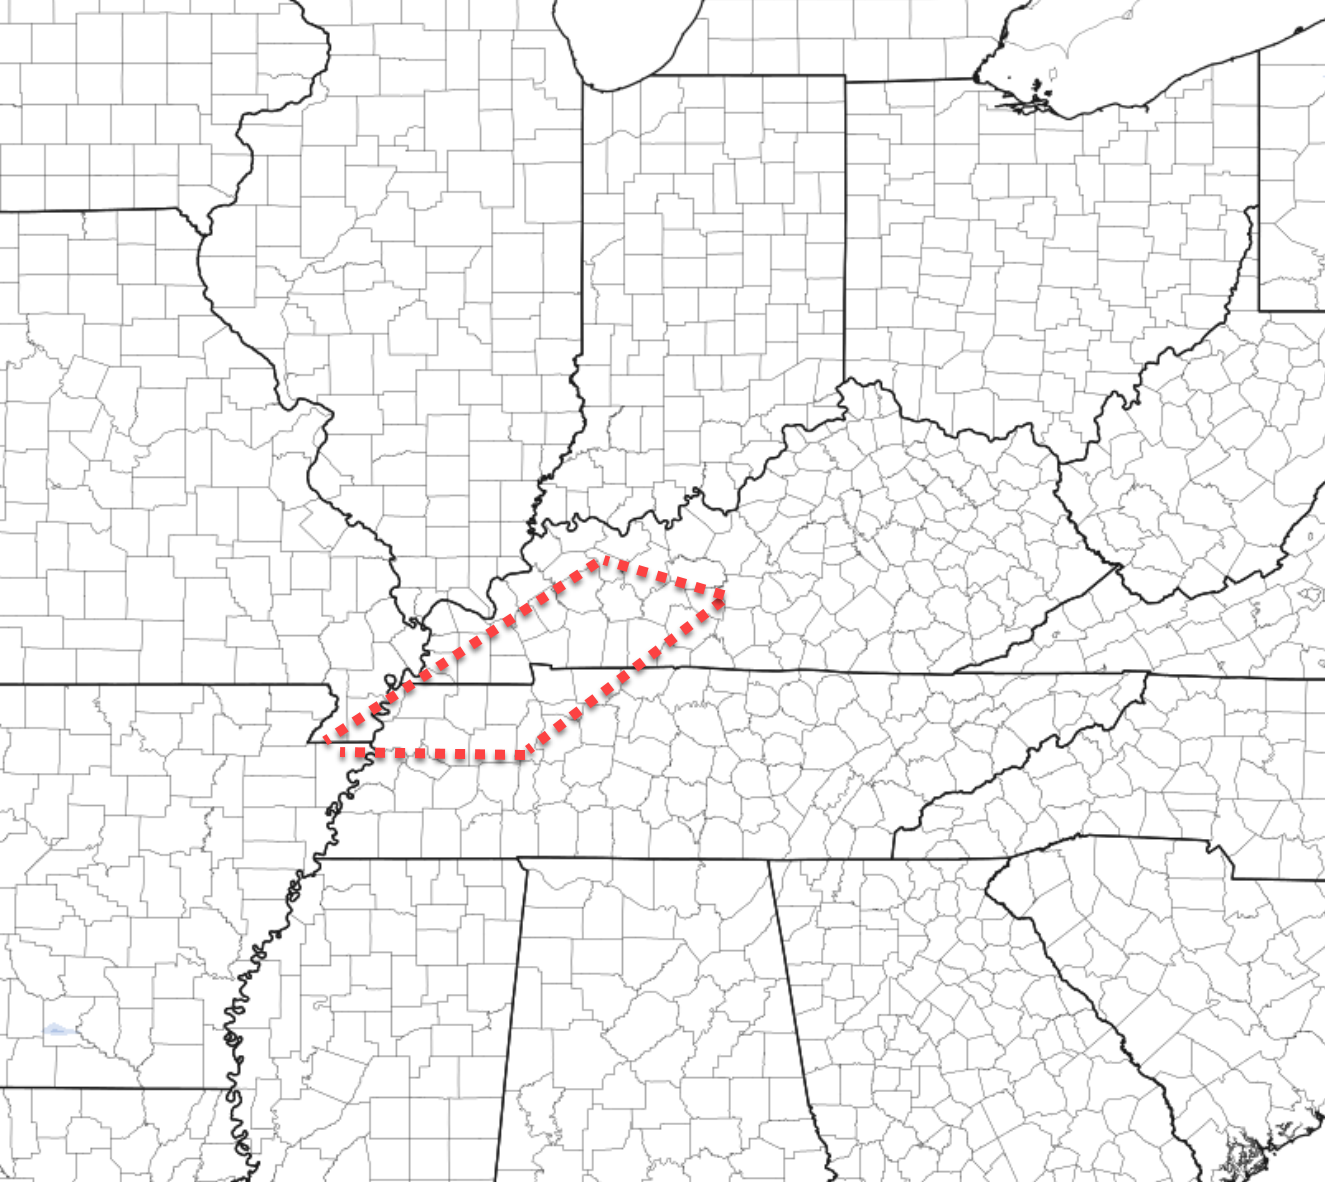
For my forecast counties, this is the area of interest later this afternoon into tonight. Not saying there can’t be severe weather elsewhere, but this is my primary zone that I am monitoring.
Dew points are struggling to move northward. I usually watch for 58+ dew points.
Right now, the 60 degree dew point line has reached the Missouri Bootheel and along the Kentucky/Tennessee state line.
Dew point is a measure of moisture. There remain uncertainties about the extent of our severe weather threat.
I continue to monitor radar and data. Primary time-frame of concern continues to be late afternoon into the evening hours. Perhaps the 4 or 5 PM through 11 and 12 AM time-frame.
.
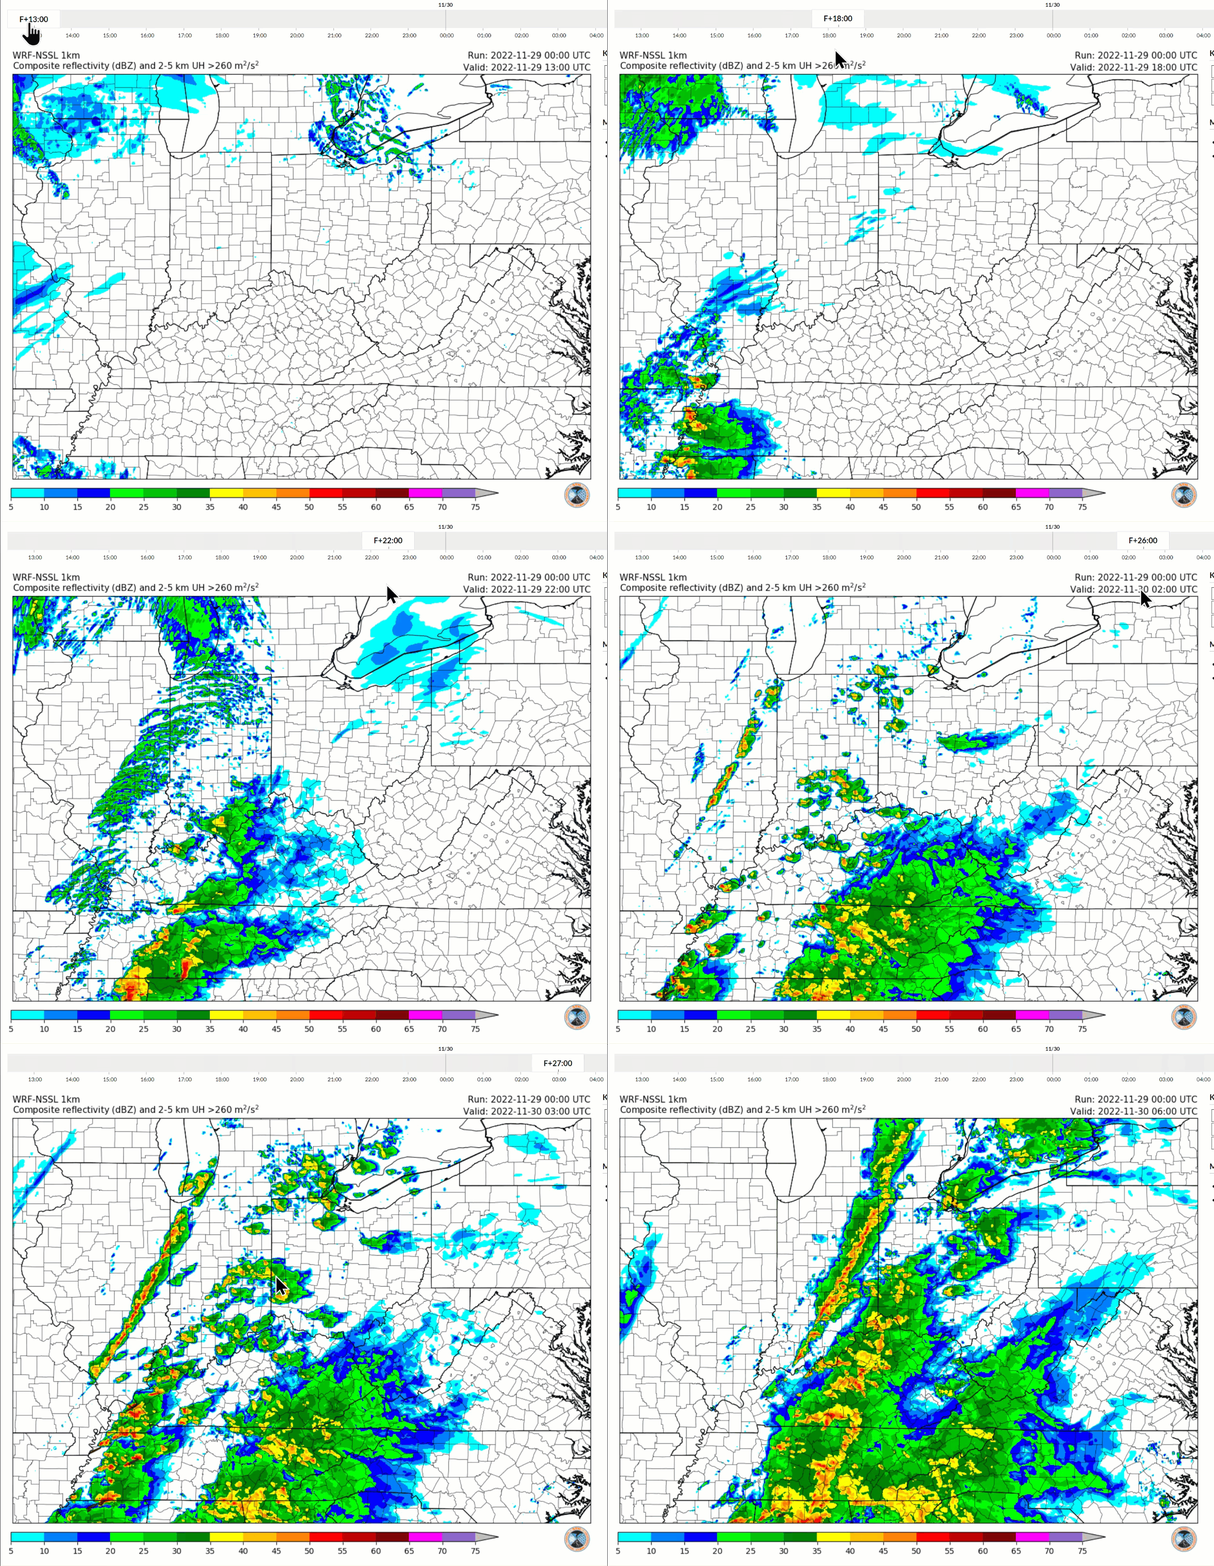
12 PM future-cast radar
I am watching the storms this evening. Right now, our current shower and thunderstorm activity is sub-severe.
I am more concerned about the evening activity into the overnight hours.
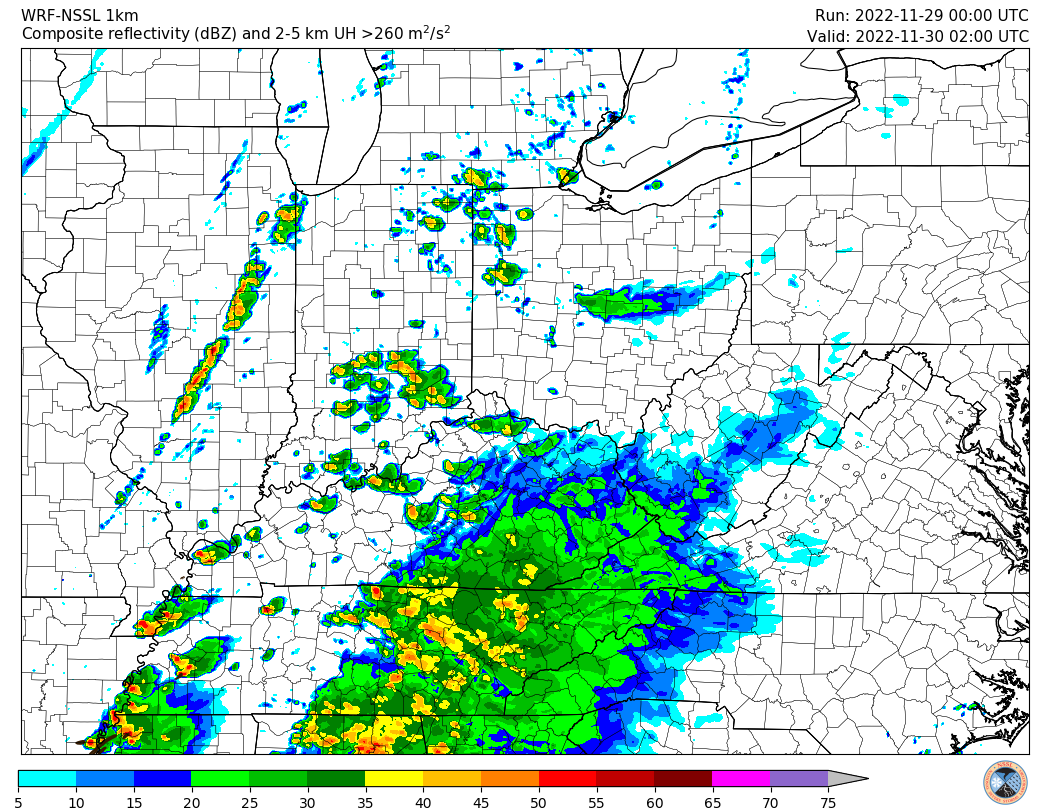
Watch how those storms form on this 1 KM model.
We will just have to wait and see if it is correct. Watch my curser. Those are the storms of most concern (this evening).
11:35 AM Update
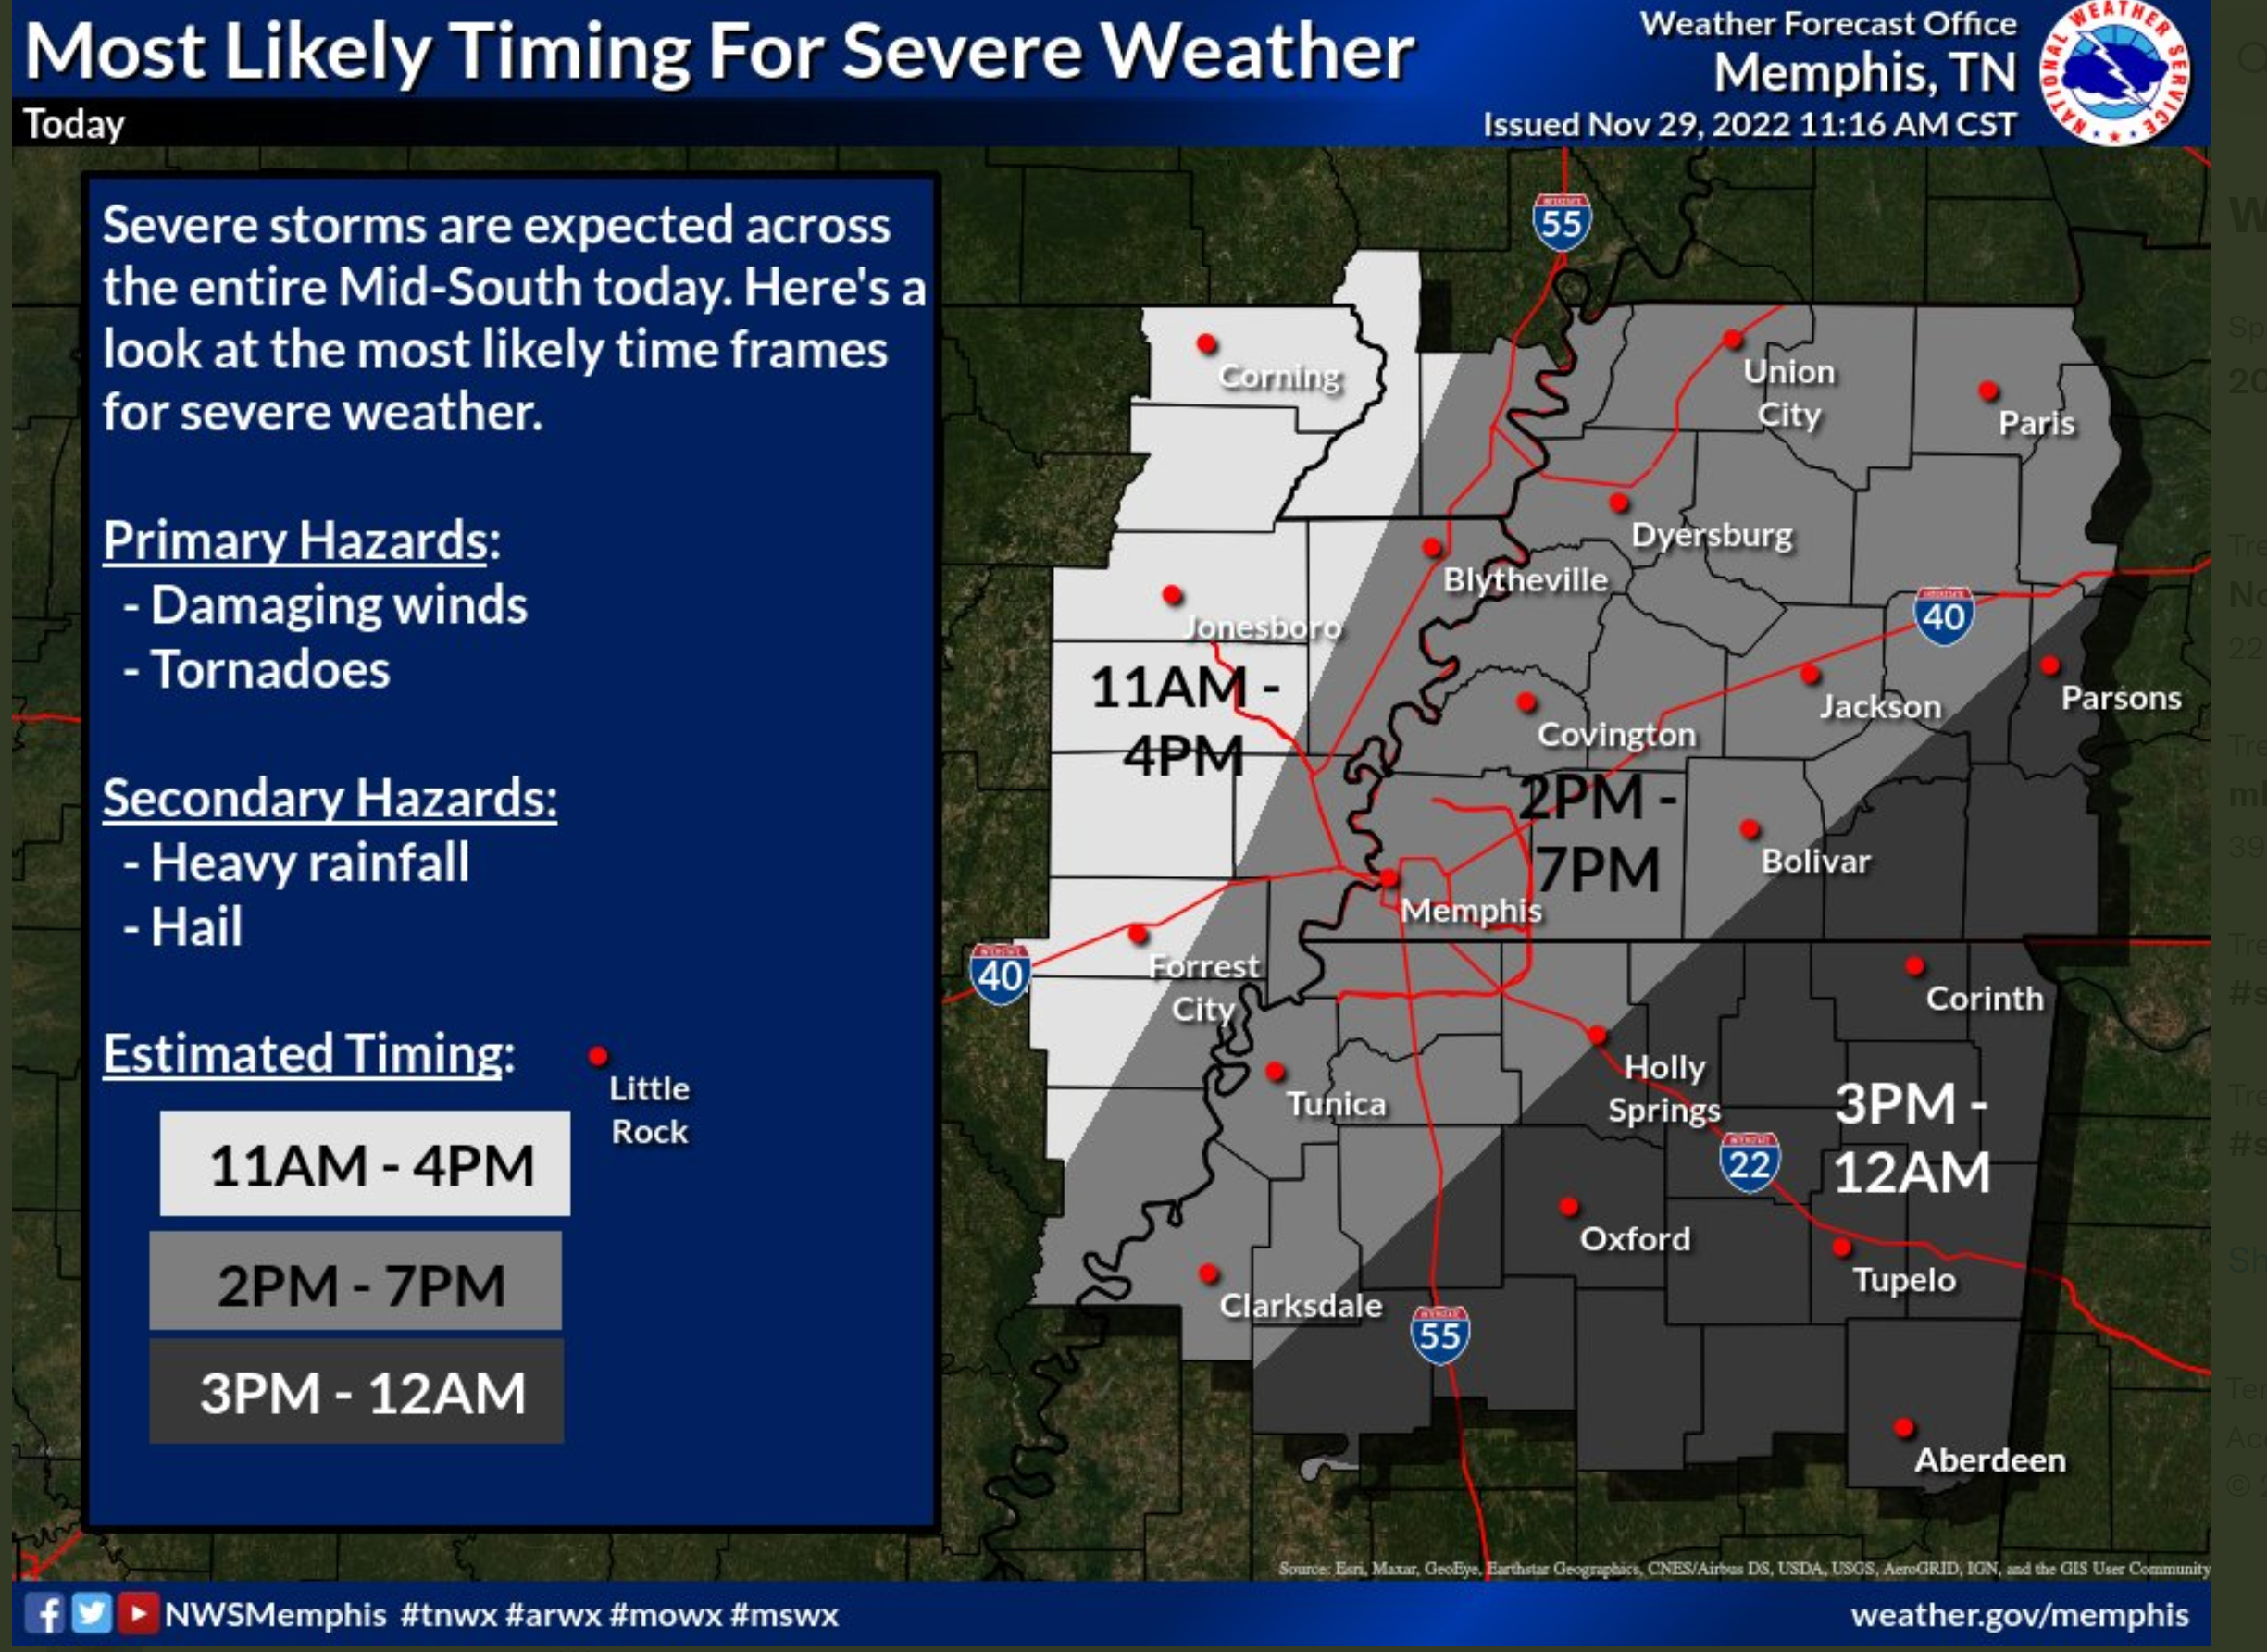
Here is a timing graphic from the Memphis, Tennessee NWS. You can draw that northward to get an idea, as well.
This is the time of highest concern.
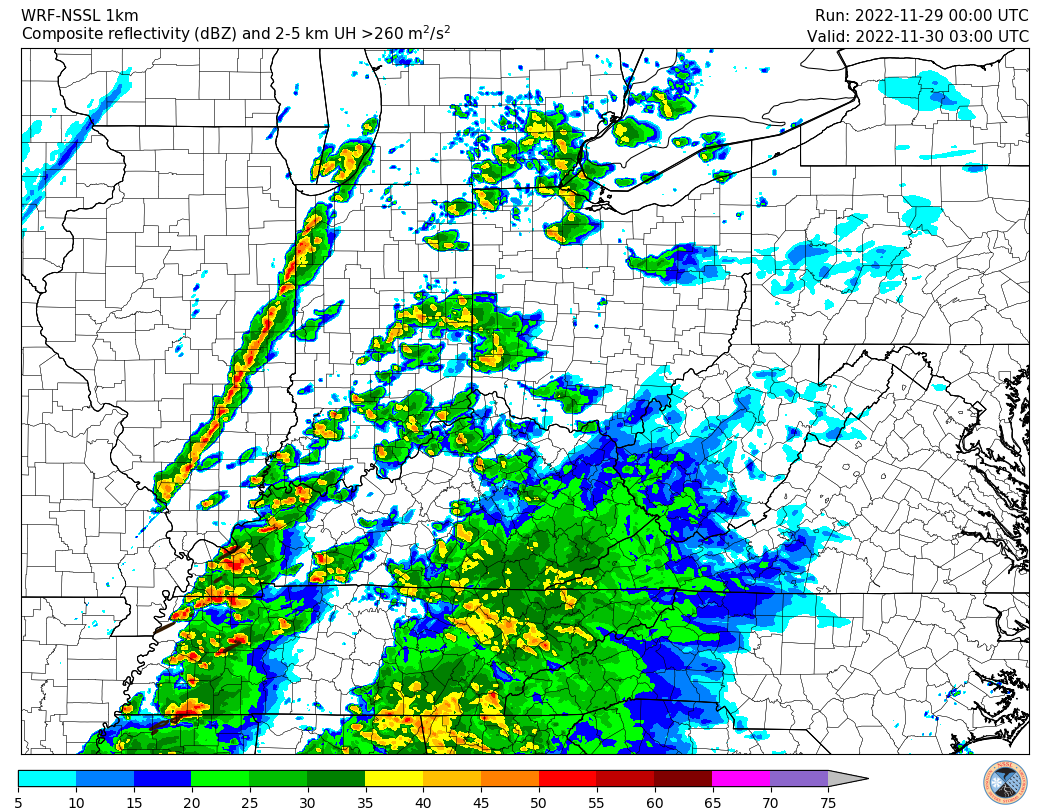
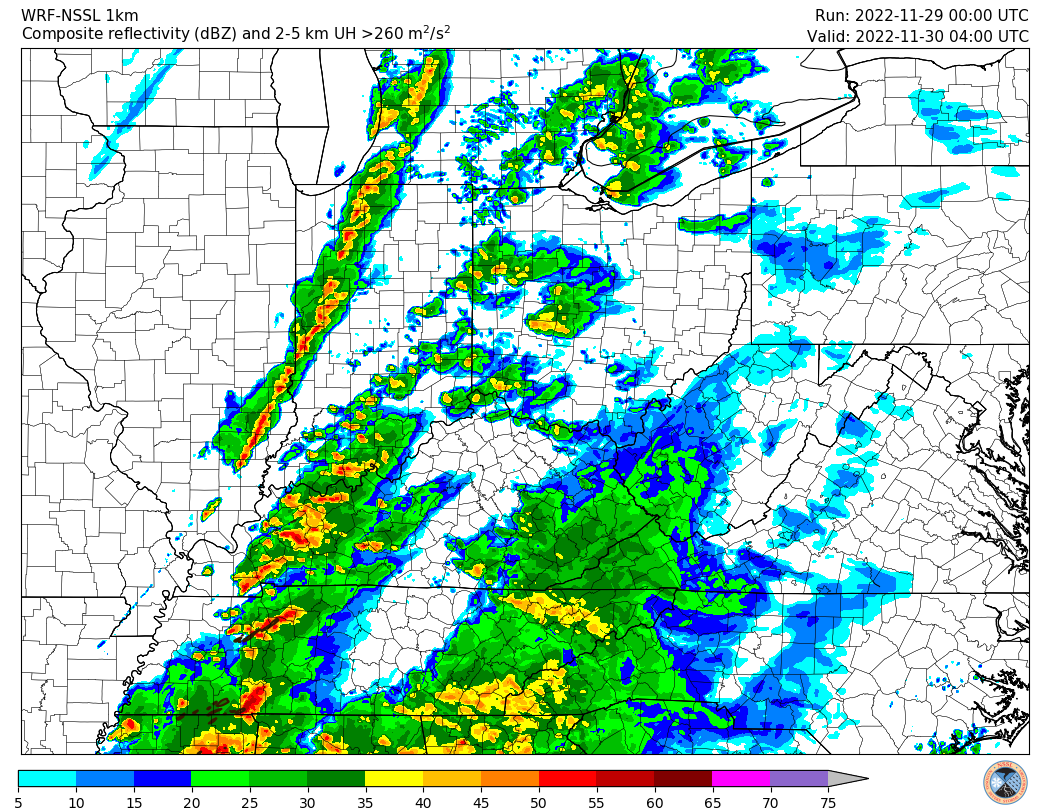
I am closely watching the high resolution model guidance.
It is showing storms rapidly forming this evening.
This is around 5 to 7 PM.
Watch how quickly the storms form in the Missouri Bootheel and northwest Tennessee. They then move rapidly northeast.
Some of these storms could become severe.
This next graphic is around 6 to 8 PM
This is the 8 PM to 10 PM time-frame
9:45 AM Update
Scattered showers and non-severe thunderstorms are rapidly developing on the nose of the low level jet.
These showers and storms will race northeast into our region. The only concern with these will be lightning and perhaps a few hail reports. Gusty winds.
Beau Dodson Radars and Lightning Data
Interactive local city-view radars. Clickable watches and warnings.
https://wtalk.co/B3XHASFZ
Backup radar site in case the above one is not working.
https://weathertalk.com/morani
Regional Radar
https://imagery.weathertalk.com/prx/RadarLoop.mp4
*NEW* Zoom interactive radar (with storm chaser streams)
https://wtalk.co/AVWG7GM7
Real time lightning tracker system two.
https://map.blitzortung.org/#5.02/37.95/-86.99
Lightning Data (zoom in and out of your local area)
https://wtalk.co/WJ3SN5UZ
.
7:30 AM Update
There were not a lot of changes in the overnight data.
Our region is on the northern edge of this severe weather event.
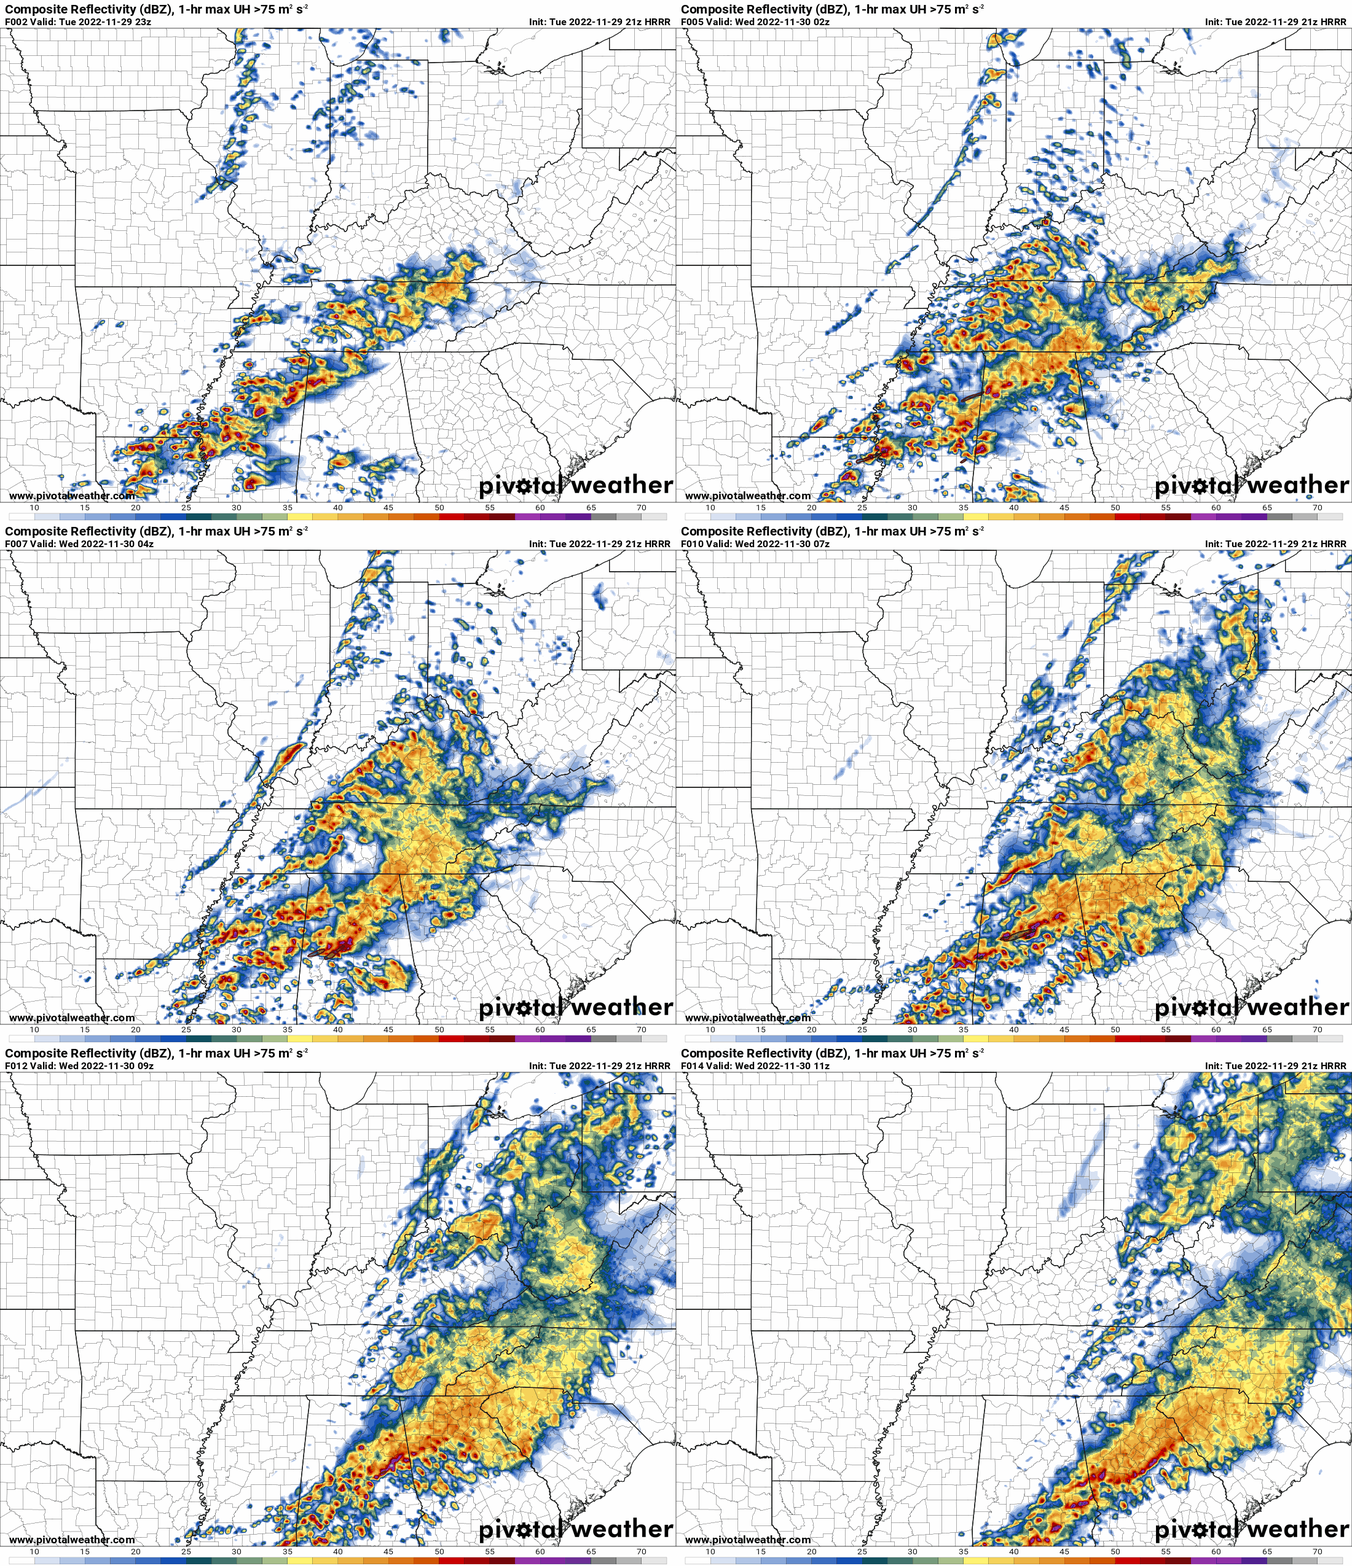
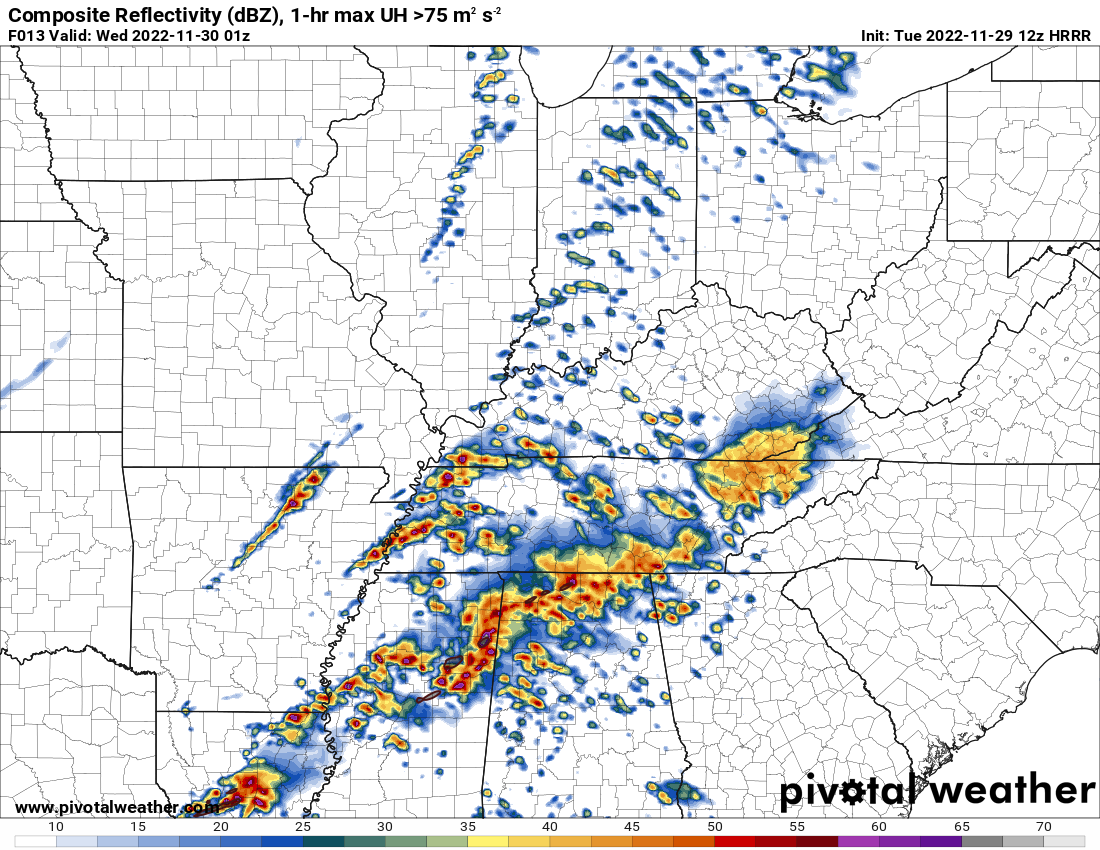
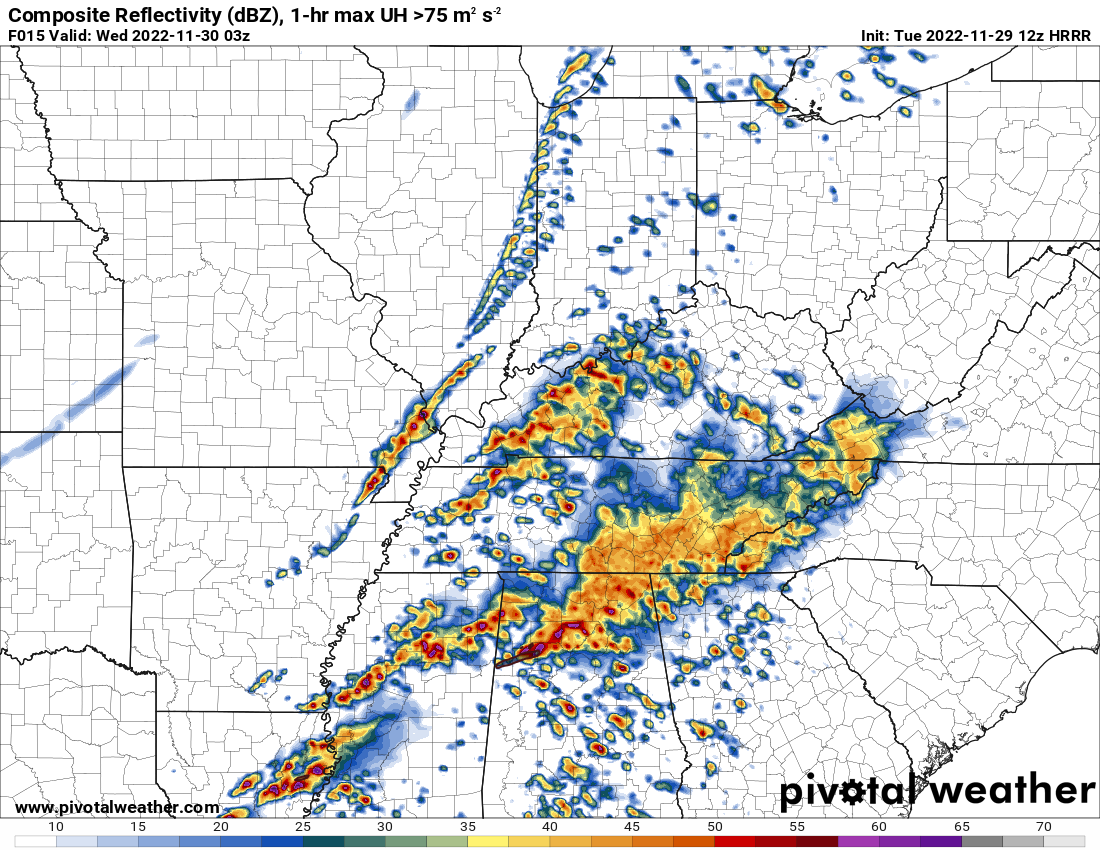
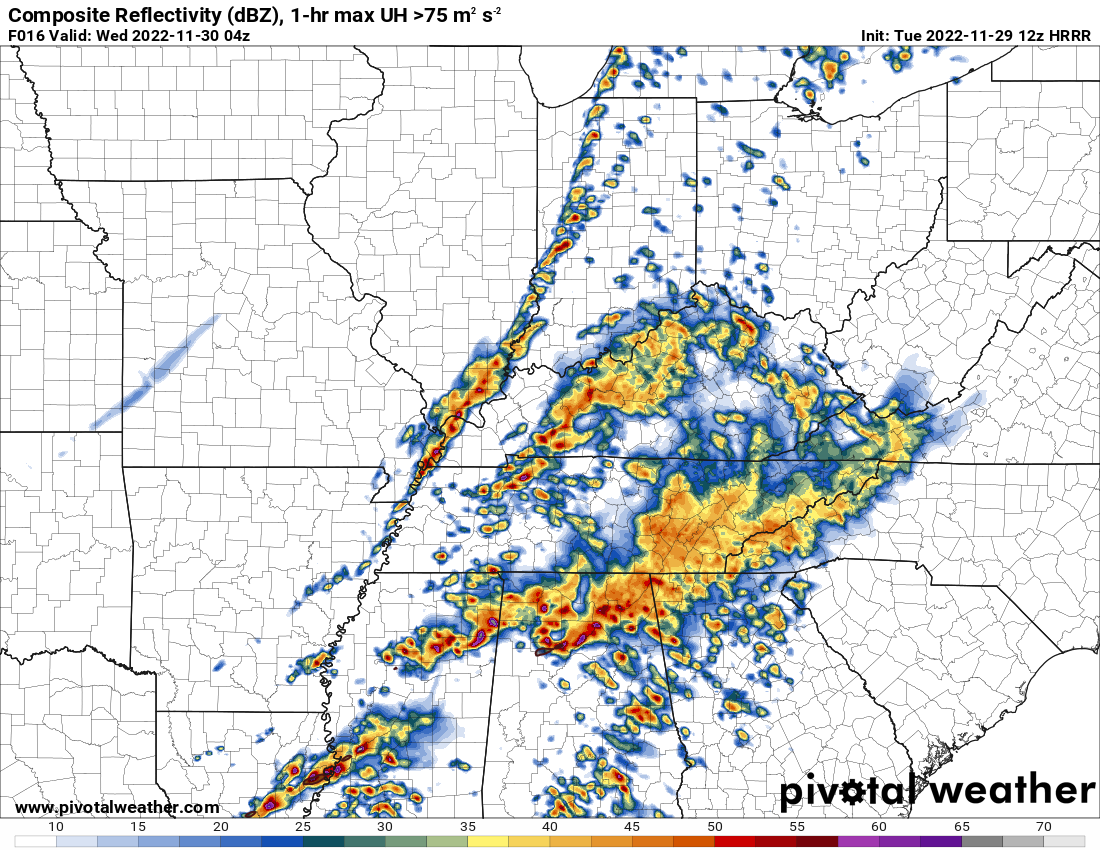
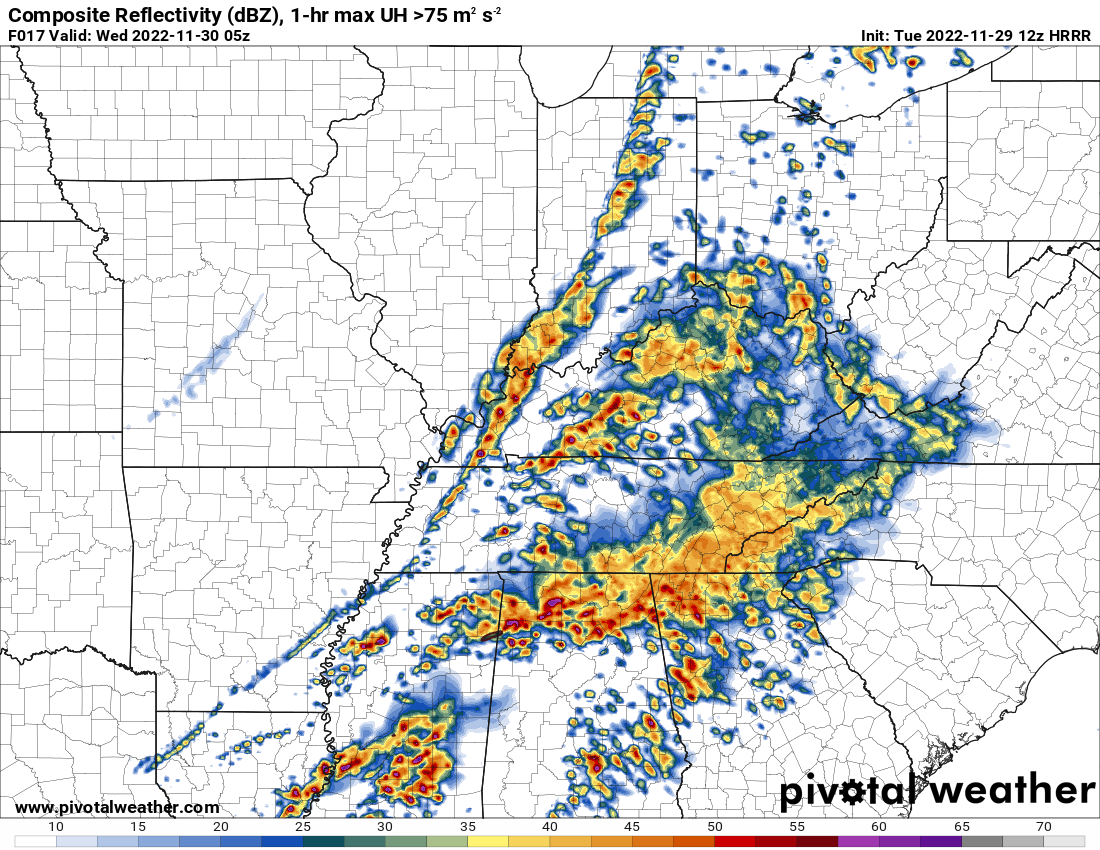
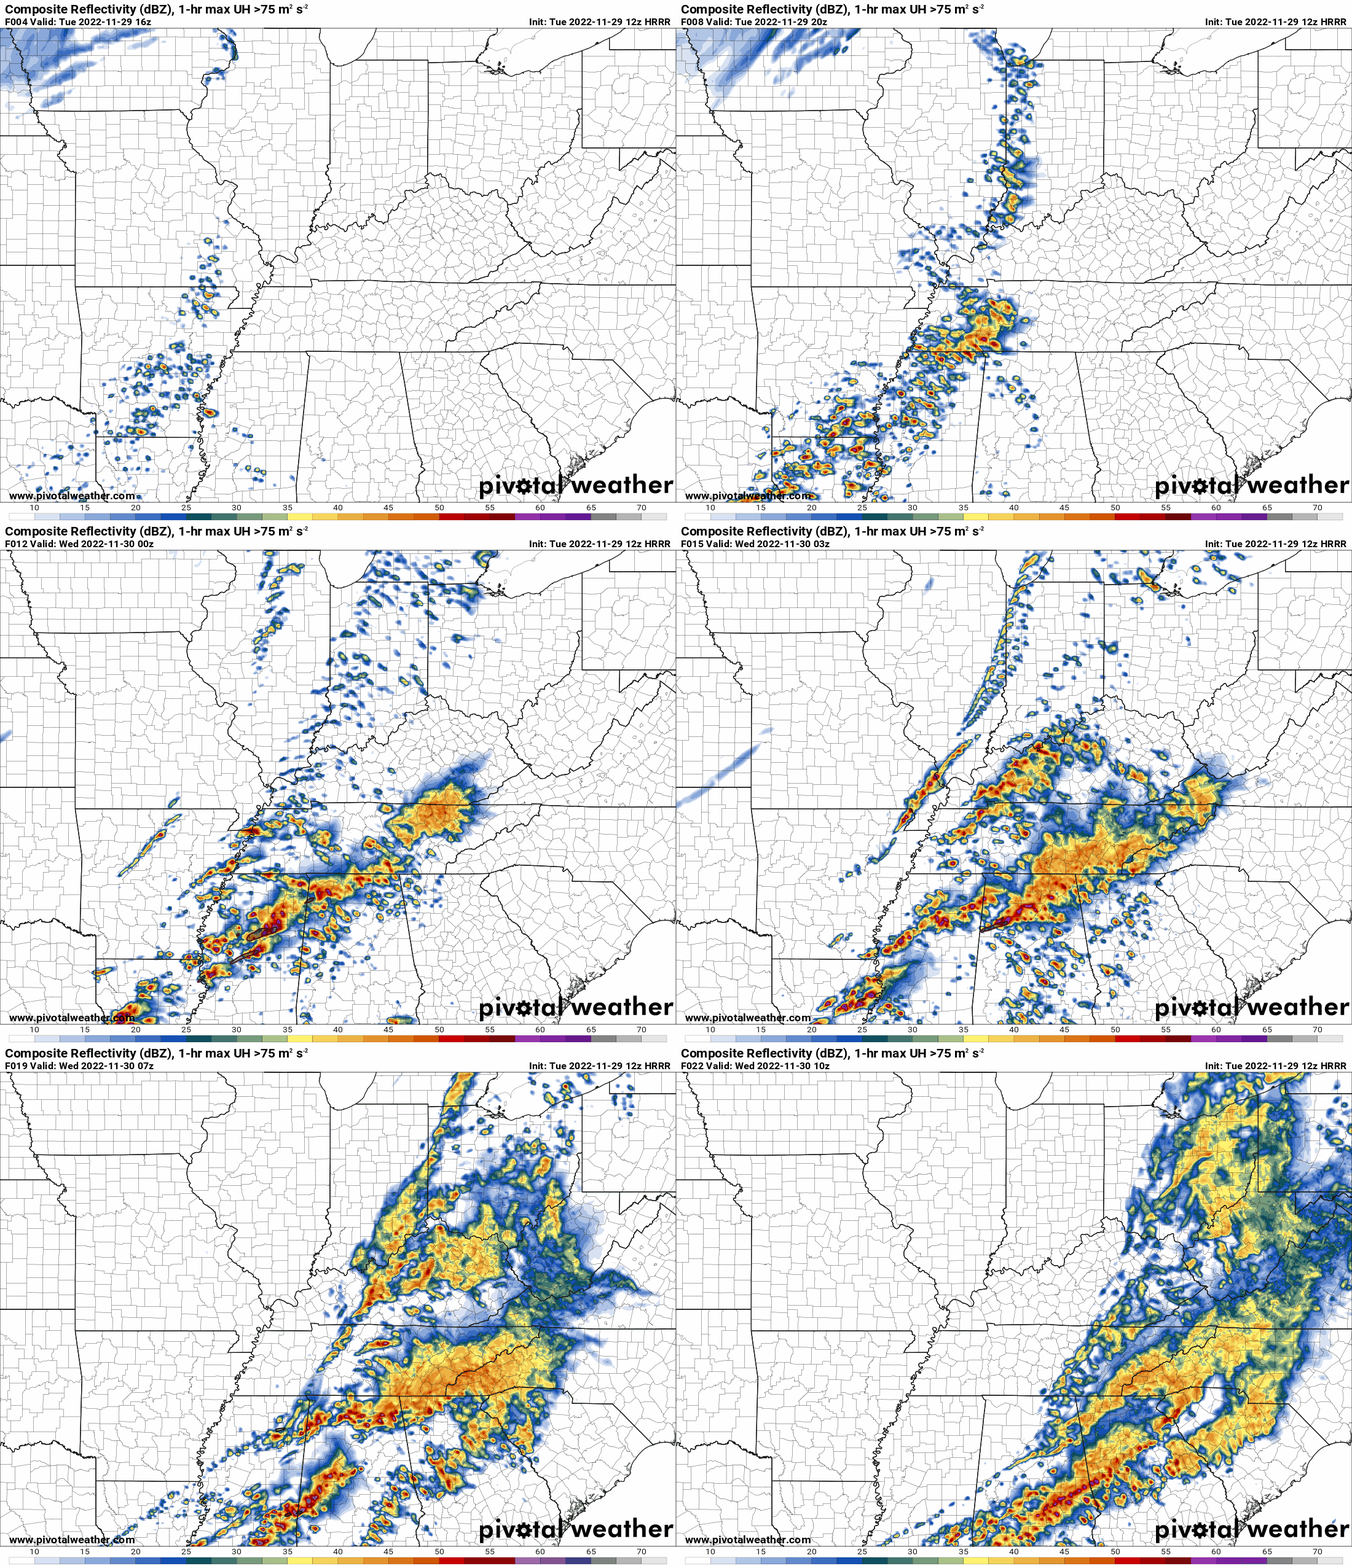
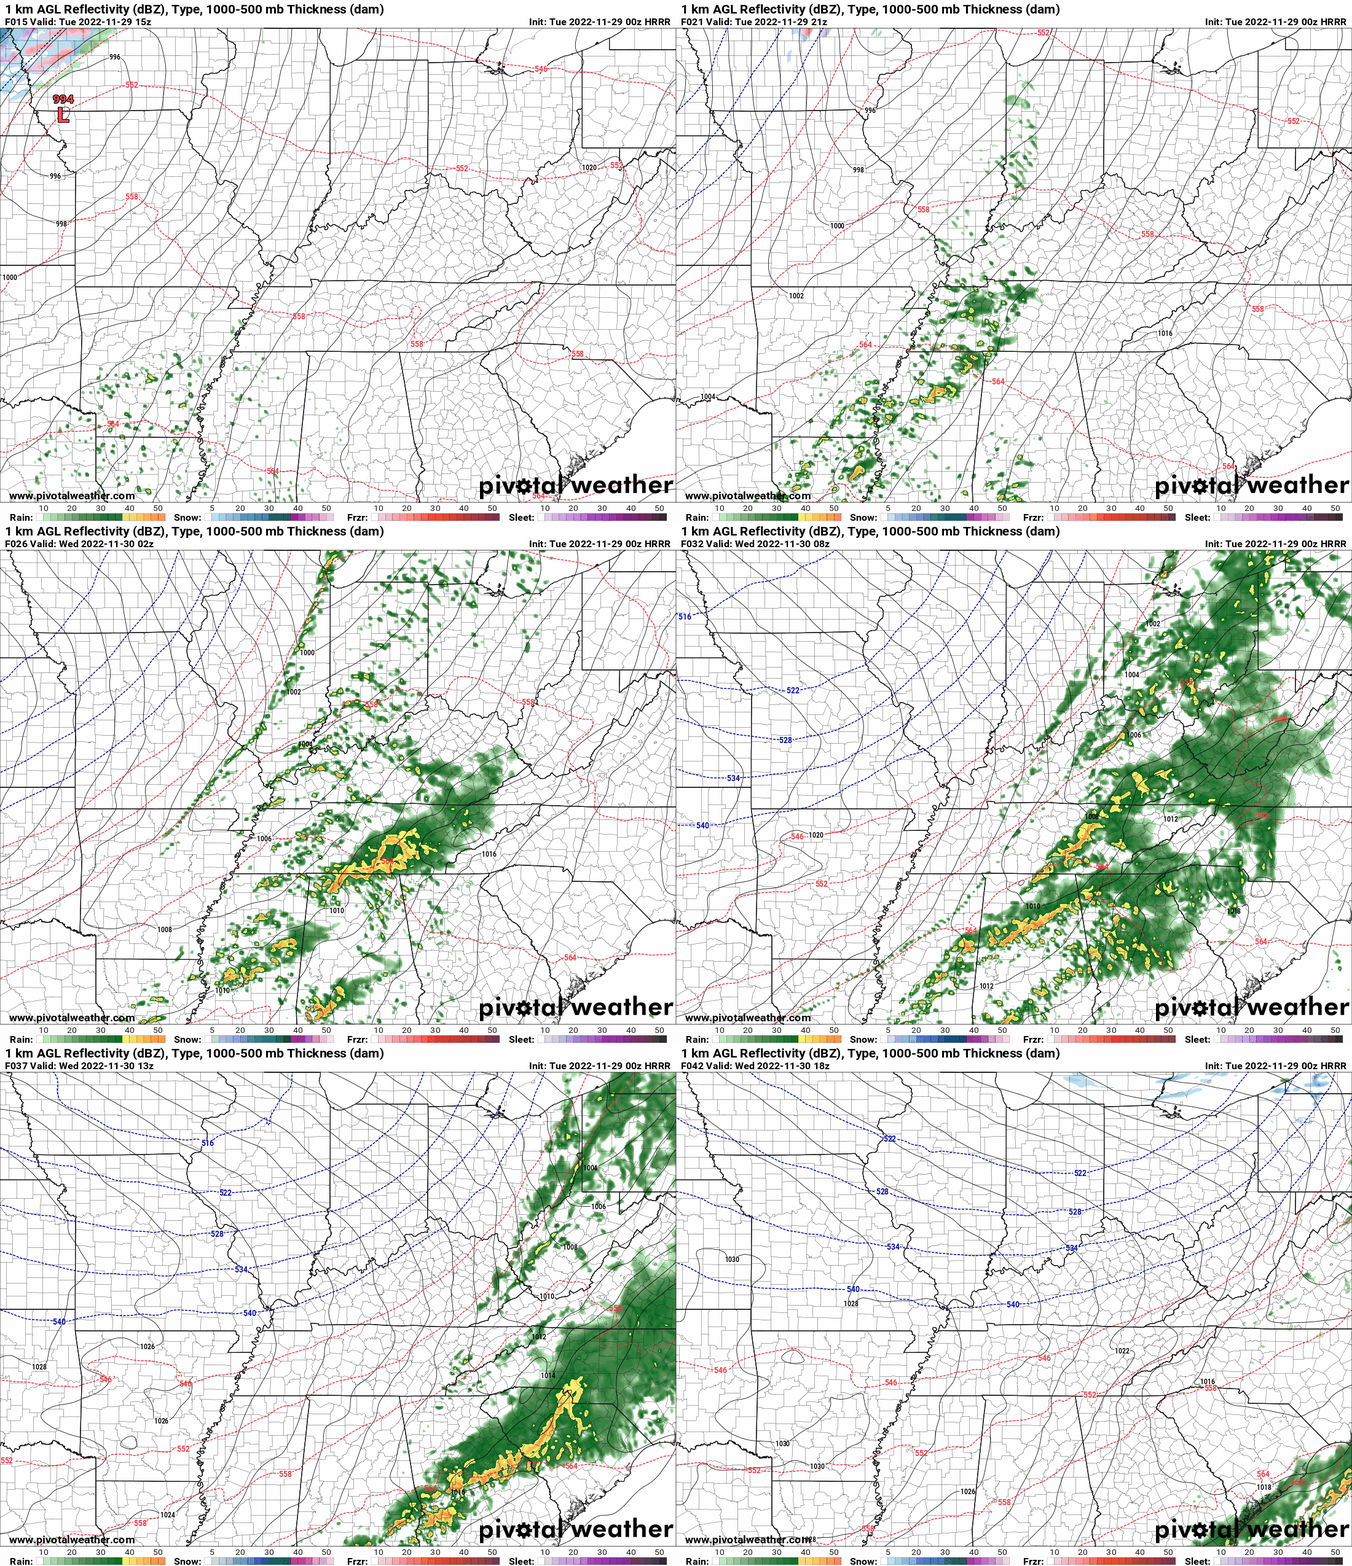
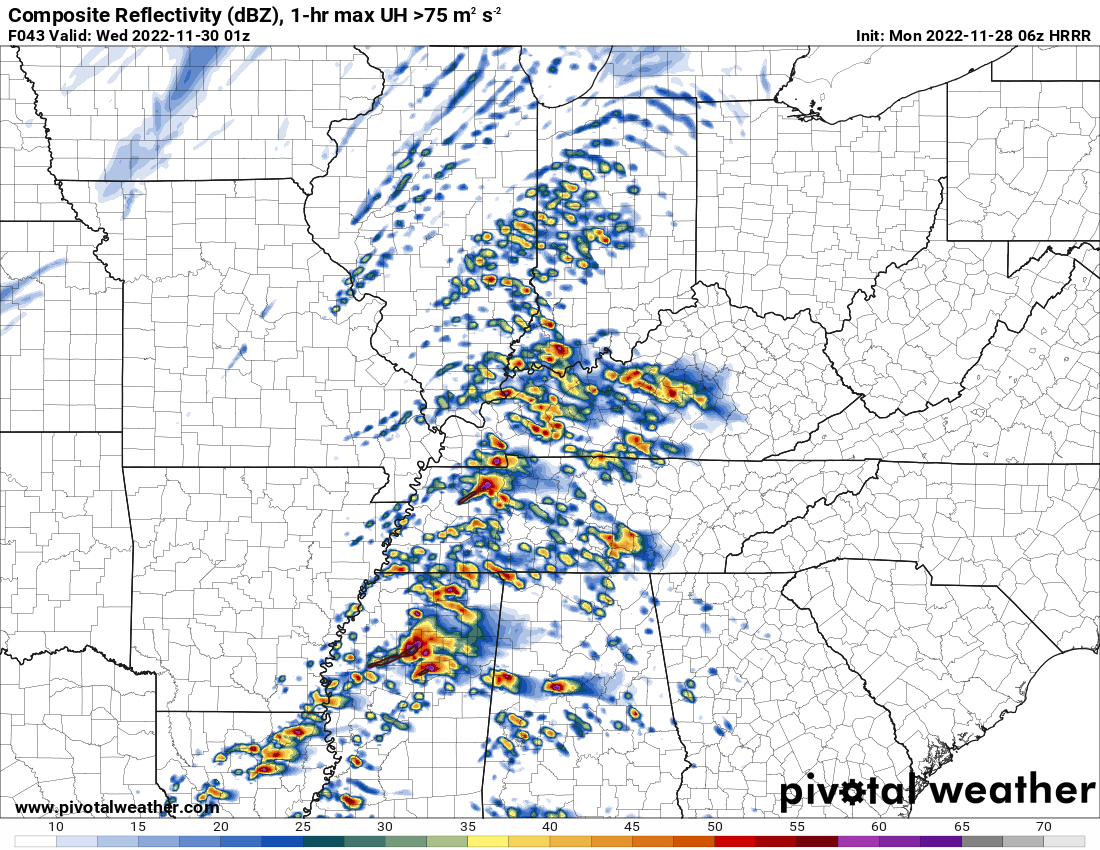
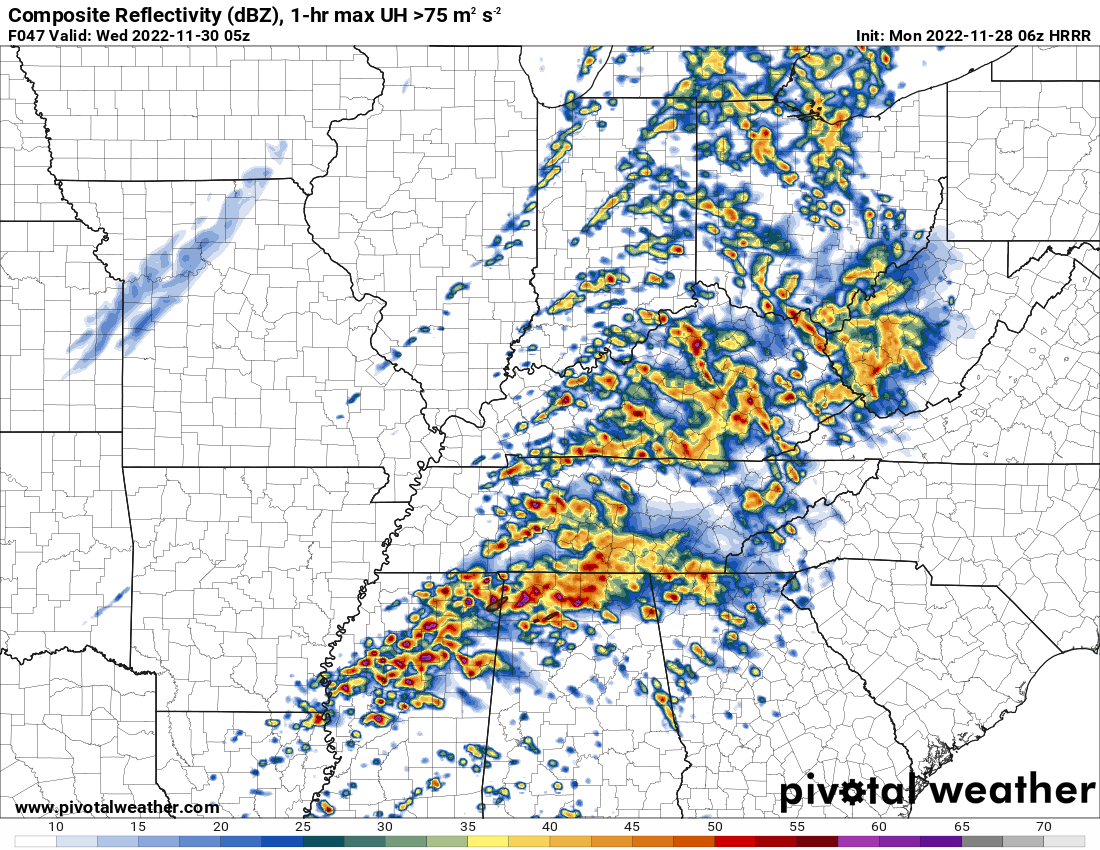
Let me show you a few future-cast radar images. This is the Hrrr model. One model of many.
We are going to have to watch these storms coming out of the Bootheel into Tennessee and Kentucky. Then, we will need to watch the line of storms moving in from the west. That is the cold front.
7 PM future-cast radars. What radar might look like at 7 PM.
9 PM future-cast radar.
10 PM future-cast radar
11 PM future-cast radar
Here is the Hrrr model future-cast radar animation. This is in Zulu time. Oz=6 PM. O6z=12 AM
The Storm Prediction Center has a more significant risk of severe weather across the Gulf of Mexico. That includes portions of Louisiana, Arkansas, Tennessee, Mississippi, and Alabama.
They have a lower risk as you move north into our region.
You can see their outlooks here.
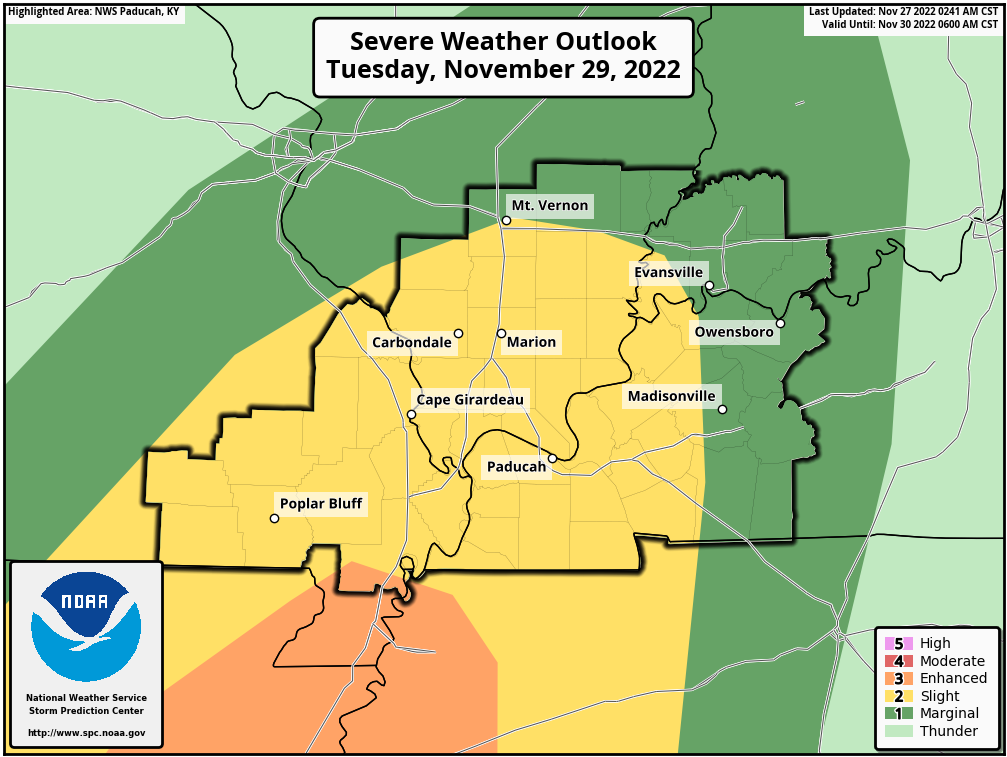
Today’s Storm Prediction Center’s Severe Weather Outlook
Light green is where thunderstorms may occur but should be below severe levels.
Dark green is a level one risk. Yellow is a level two risk. Orange is a level three (enhanced) risk. Red is a level four (moderate) risk. Pink is a level five (high) risk.
One is the lowest risk. Five is the highest risk.
A severe storm is one that produces 58 mph wind or higher, quarter size hail, and/or a tornado.
The tan states are simply a region that SPC outlined on this particular map. It has no significant meaning.
The solid thick black line has no significant meaning.

The black outline is our local area.


As you can see, the risk is higher south of my forecast area.
Our region has a conditional risk of severe weather.
What does conditional mean? It means that some of the severe weather ingredients are missing or lacking.
Primarily, the lacking ingredient is going to be CAPE (energy that storms tap into) and higher dew points (moisture).
Severe thunderstorms need both.
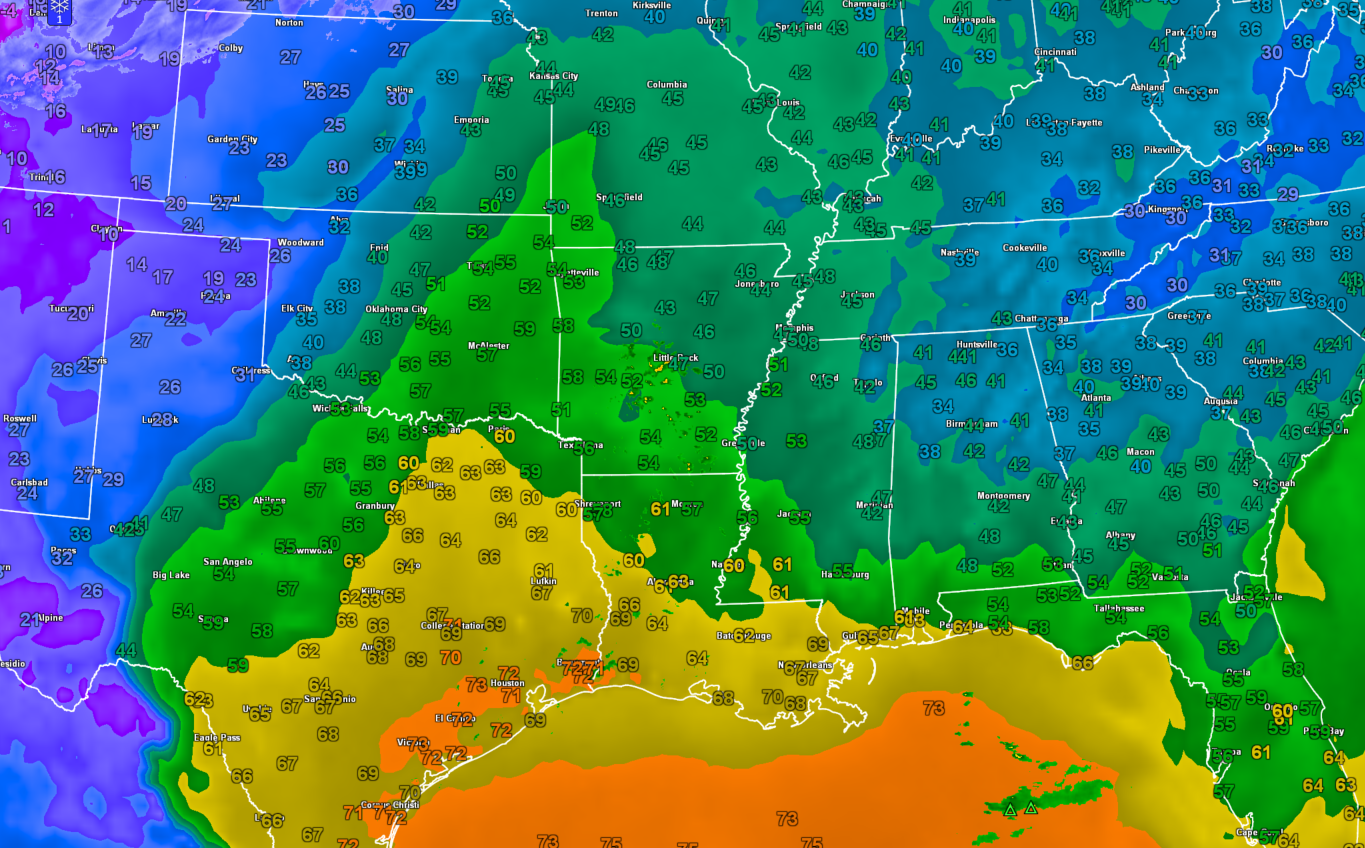
Higher dew points may be shunted south of our area. That would be because of widespread showers and thunderstorms across the Gulf of Mexico states. That blocks the higher dew points from moving northward.
Here is what the 7 AM dew point map looked like. I typically watch for 58 degrees and above during the autumn and winter months. Anything from there upward can cause problems. Double click images to enlarge them.
Without those higher dew points, thunderstorms can’t reach their full potential.
If the higher dew points do move northward, then our severe weather risk would increase.
The primary concern will be a few wind gusts reaching 60 mph, a few reports of quarter size hail, and perhaps a tornado or two.
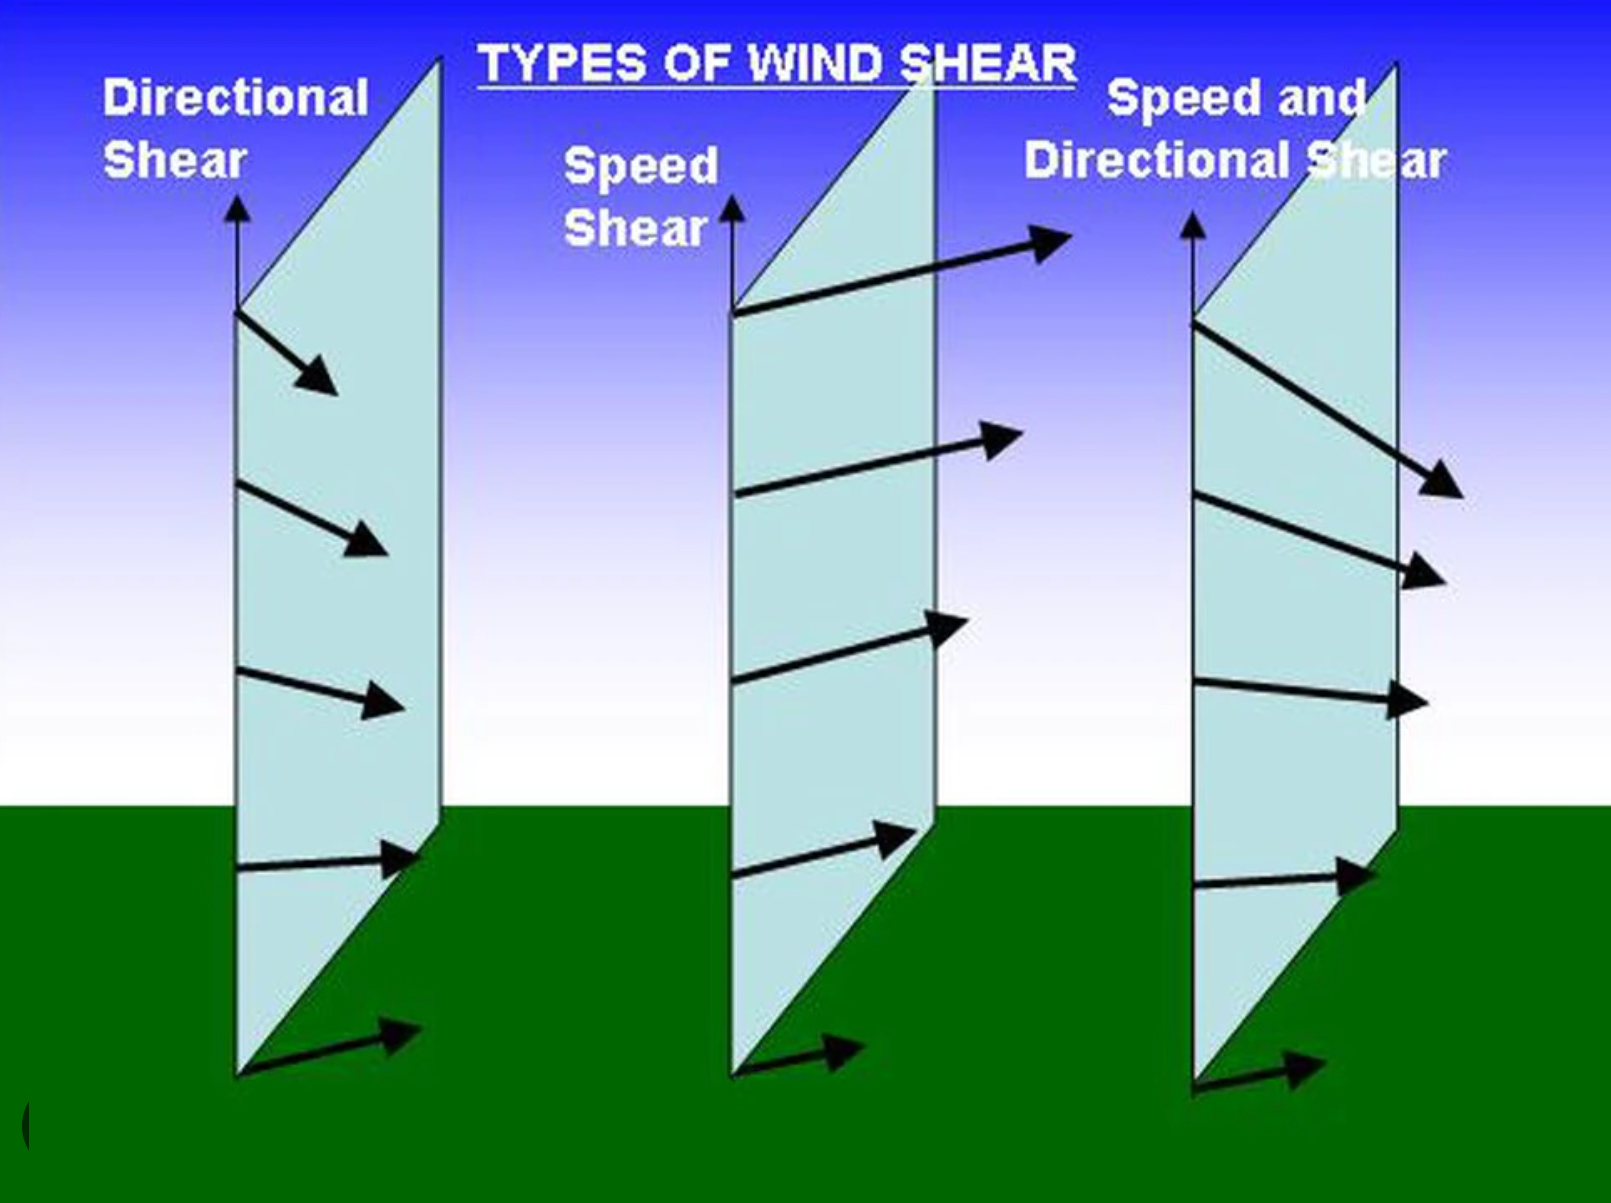
There will be plenty of wind shear for thunderstorms to work with. Wind shear is when winds change direction and speed as you move higher into the atmosphere.
Wind shear causes thunderstorms to rotate or spin. That is an ingredient for tornadoes.
Here are the different kind of wind shear. Speed shear and directional sheer.
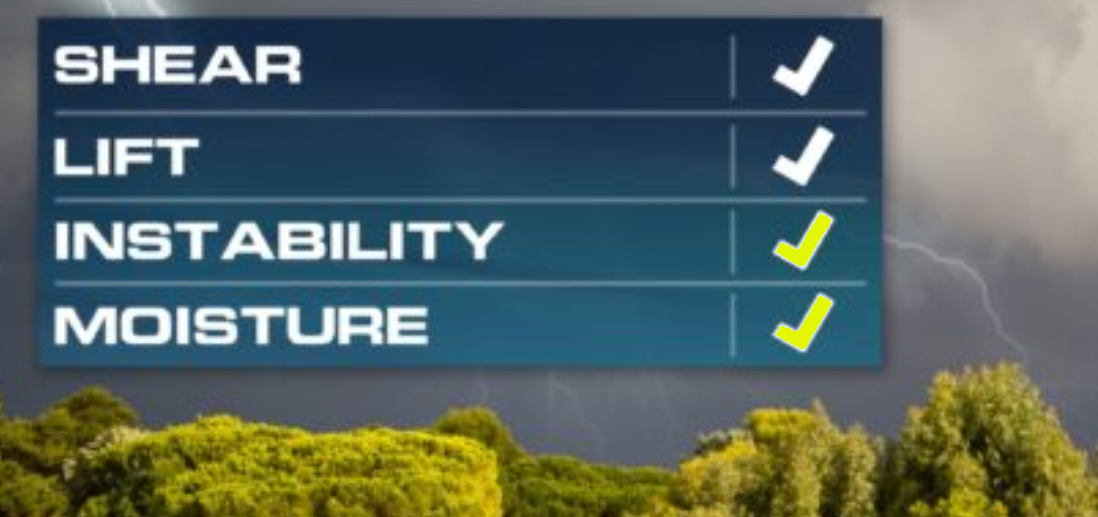
These are the ingredients for severe weather.
We will have plenty of wind shear. We will have lift (the cold front). We will have some instability but not much. Moisture (dew points) remain questionable.
I will be monitoring radar and satellite today. I will also keep an eye on dew points.
I will be watching to see how much thunderstorm activity develops along the Gulf of Mexico.
I will keep this page updated.
.
6 AM
Monday, November 28, 2022
9 PM Update
Here is where we are.
1. Scattered showers and storms are possible late tomorrow morning into tomorrow night.
2. The severe threat will be minimal before 3 PM.
3. After 3 PM (and well into the night) the atmosphere will become unstable. There remain questions about just how unstable.
4. A few of the thunderstorms could produce damaging wind, hail, and perhaps an isolated tornado or two. No change to the going forecast (that has basically been the same forecast for the past three days).
There remain questions about thunderstorms to our south blocking the higher moisture from moving into our region. If that were to happen, then our severe weather risk would be lower.
If the higher moisture does reach our region, then a few severe storms will be possible.
The best advice is to monitor updates throughout tomorrow and tomorrow night.
This is a normal/typical autumn severe weather event for our region. Common. They have every year.
There isn’t anything unusual about this particular storm.
Storms could linger past midnight. I would imagine it will be a long night for the weatherman.
I will know more tomorrow.
Futurecast radar.
Time is Zulu. 0z = 6 pm. 06z=12 am.
Double click animations to enlarge them
.
3 PM Update
No changes to my morning thinking.
The primary concern is going to be between 3 PM and midnight Tuesday evening/night.
The concern is higher from the Missouri Bootheel into northwest Tennessee and western Kentucky. As you travel north of the Ohio River the risk is lower, but not zeero.
Keep that in mind. Severe weather could occur anywhere in the region. The risk is higher south and east.
The primary concern continues to be a few supercell thunderstorms with damaging wind, hail, and even an isolated tornado.
Conditions are favorable for a larger event south of my forecast area. If you are traveling south tomorrow, then monitor updates.
For our region, I will be sending out app messages if necessary.
Stay aware of changing weather conditions. I encourage everyone to have three or more ways of receiving severe weather information.
Don’t rely on just one source.
8 AM Update
There is a Severe Weather Blog thread ongoing. Please see that for more frequent updates, as well. It can be read at this link CLICK HERE
I also have Facebook severe weather threads. Click here and then go to the top pinned thread for Q&A
The Storm Prediction Center has placed our region in a level one, two, and three risk.
Now, as I said yesterday, they will change this (as they usually do).
Yesterday, they all of my forecast region in a higher risk. Today, they took that away and shunted it southward. That was not a total surprise as the guidance was showing the threat was higher farther south.
The risk, in my forecast counties, will be highest across the Missouri Bootheel into northwest Tennessee. Then, a decreasing risk as you travel farther north.
I will post the outlook, but remember weather does not follow our colored lines. I don’t like these outlooks and their meanings. I have witnessed strong tornadoes in a marginal risk and no tornadoes in a high risk.
I would rather you simply follow the actual forecast. The forecast is for scattered thunderstorms tomorrow late morning through the overnight hours. Instability will increase Tuesday evening and night. There is a fairly small window of opportunity for severe weather over southeast Missouri and southern Illinois. Then, a slightly larger window over northwest Tennessee and western Kentucky.
The primary time-frame of concern will be 4 PM through 3 AM. Ending west to east overnight. That ends as the cold front arrives.
A few of the thunderstorms could produce dime to quarter size hail, 60 mph winds, and perhaps an isolated short-lived tornado. This is not a huge outbreak event of our region.
It could be a bigger event south of us. As always, I want you to monitor updates. Weather forecasts typically evolve as confidence increases in the final outcome.
This is a common event. We have events like this every year. Several times a year, actually.
We are on the northern edge of this system. It would take a considerable shift to change the going forecast.
Here is their current outlook. This will be updated several times between now and Tuesday. Thus, you will want to check back frequently for weather updates. Monitor your Beau Dodson Weather app.
The greatest threat zone is the yellow and orange.
Light green is the sub-severe zone. Dark green is the level one risk (lowest risk). Yellow is a level two risk. Orange is a level three risk (the highest risk on this particular graphic). There is a level four risk south of my forecast area.
Tomorrow’s severe weather outlook.


Let me show you a few maps.
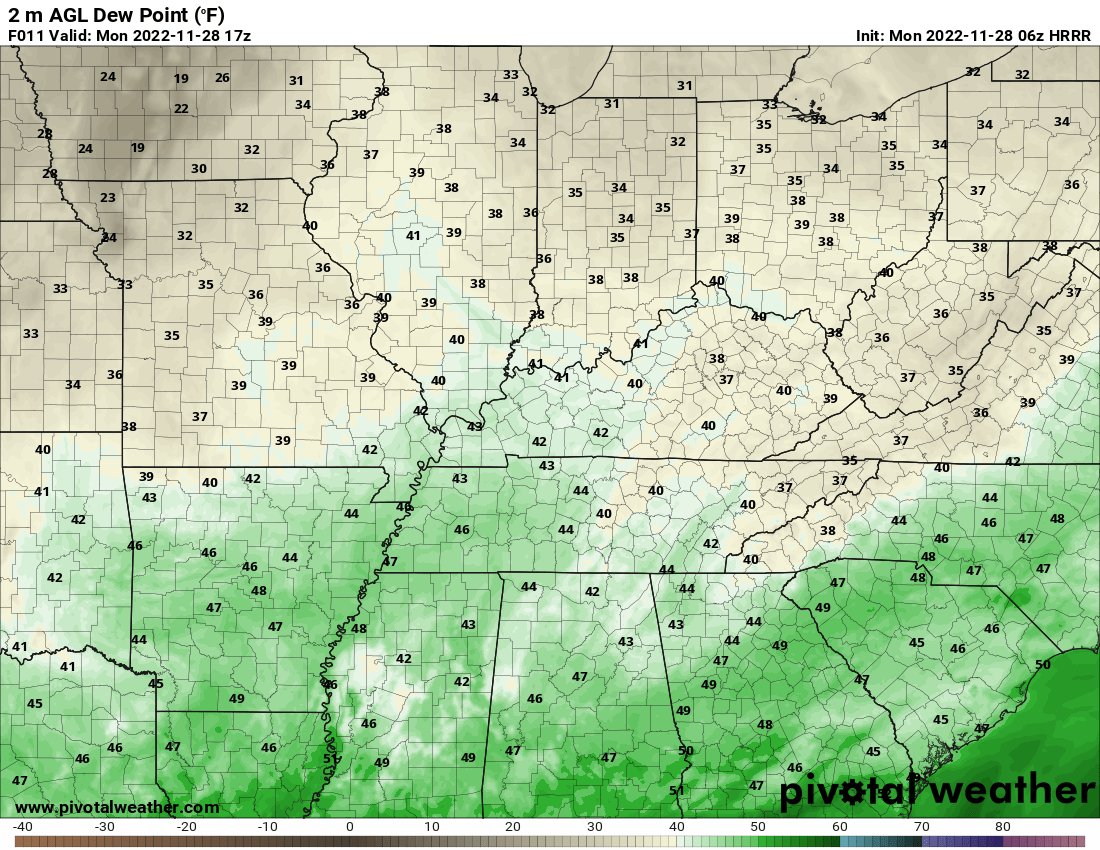
The primary reason we aren’t having a larger tornado outbreak is the higher dew points barely make it into our region.
Dew point is a measure of moisture. Higher dew points equal a higher risk of severe weather.
December 10, 2021 we had widespread low to upper 60 dew points into central Illinois.
This event is not like that. Dew points will struggle over most of the region to even hit 60 degrees.
The Missouri Bootheel into western Kentucky and Tennessee stand the highest chance of seeing lower sixties. That is enough to warrant our attention.
Dew points today
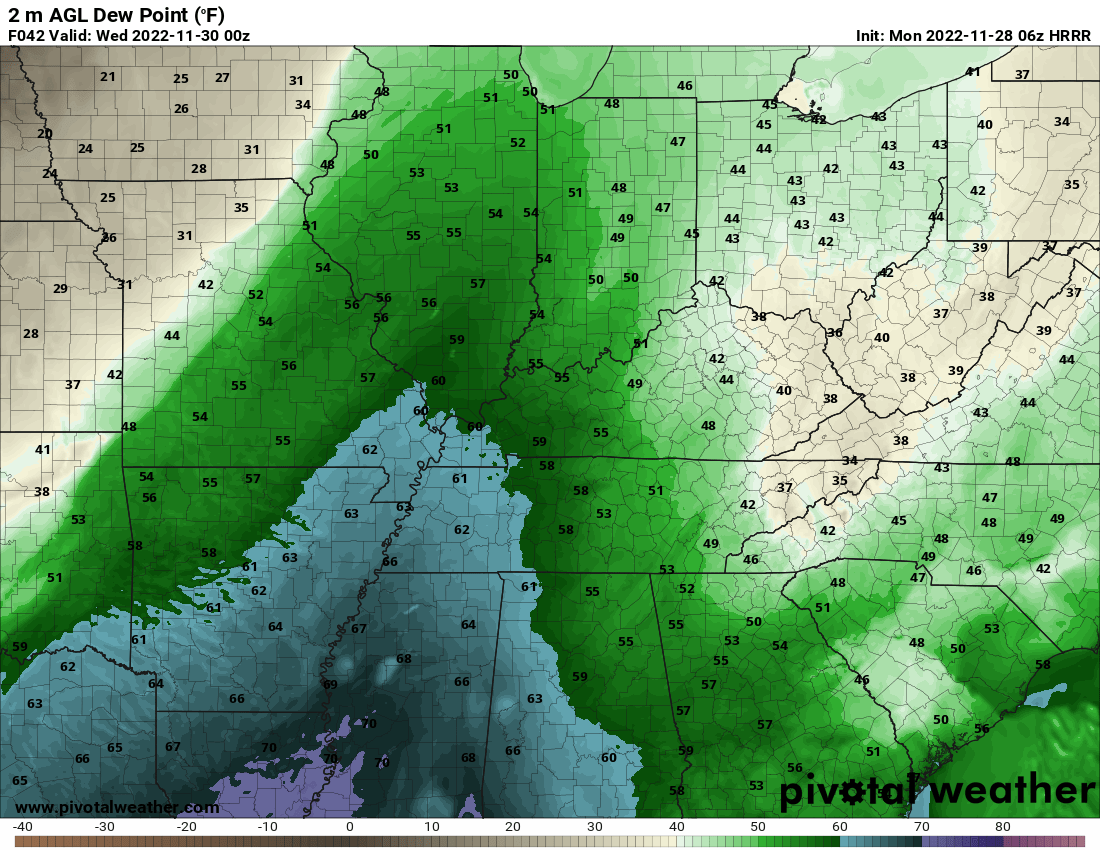
Dew points tomorrow at 2 PM. You can see they are increasing. A sliver of blue coming into the Missouri Bootheel and northwest Tennessee.
Then, by 6 PM. Dew points have slowly increases a bit farther north, but not much farther north.
The blue area represents the higher quality moisture return. That is where we begin to watch for severe weather (typically).
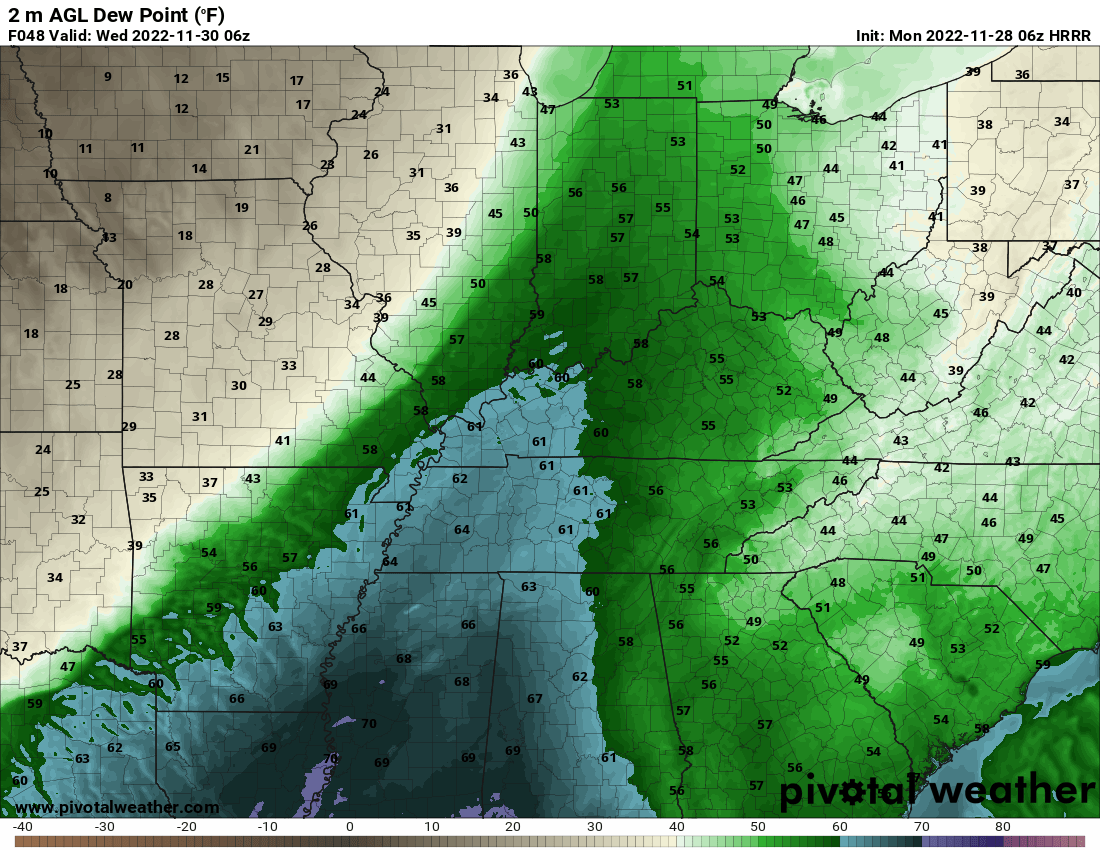
And the, as the cold front advances eastward, the dew points peak and start to shunt themselves off to the east/southeast.
This is the 12 AM dew point map. Can you find the cold front? It is moving through western Illinois and southeast Missouri. Dew points rapidly drop off behind the front.
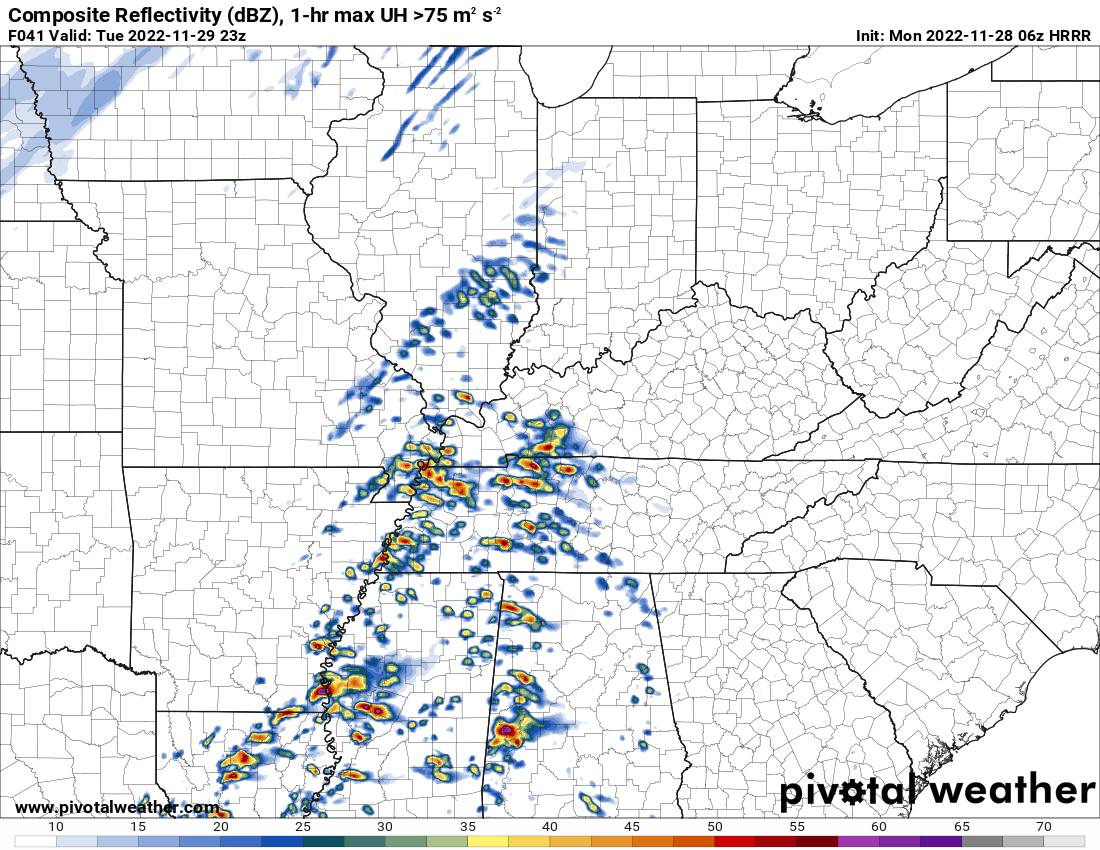
Let me show you the Hrrr model future-cast radar. This is what radar might look like tomorrow afternoon.
A few non-severe showers and thunderstorms will be possible from the late morning hours onward.
This is the 5 PM future-cast radar. Some of these storms could be intense. We will need to monitor the severe weather potential.
This is the 7 PM future-cast radar. Some of these storms look like supercell thunderstorms. In particular the ones coming out of western Tennessee. We will need to watch these. Supercell thunderstorms tend to be the ones that produce severe weather. Sometimes higher end severe weather.
This is the 12 AM future-cast radar. The cold front is that thin line in Illinois. Not much happening along the actual cold front per this model.
Then, you can see the storms moving off to our east.
Bottom Line:
A few storms could be severe tomorrow evening into tomorrow night. The risk is higher to our south, but we remain in a risk, as well.
The primary concern will be damaging wind, hail, and perhaps a tornado or two.
The risk is highest across the Missouri Bootheel into western Tennessee and perhaps portions of western Kentucky.
Monitor updates. Have three to five ways of receiving severe weather information.
Sunday, November 27, 2022
Severe Weather Outlook for Tuesday into Tuesday night
I also have Facebook severe weather threads. Click here and then go to the top pinned thread for Q&A
The Storm Prediction Center has placed our region in a marginal, slight, and enhanced risk of severe weather for Tuesday afternoon and especially Tuesday night.
Here is their current outlook. This will be updated several times between now and Tuesday. Thus, you will want to check back frequently for weather updates. Monitor your Beau Dodson Weather app.
The greatest threat zone is the yellow and orange. Again, this will change between now and Tuesday. This is their initial thoughts on the event.
Light green is the sub-severe zone. Dark green is the level one risk (lowest risk). Yellow is a level two risk. Orange is a level three risk (the highest risk on this particular graphic). There is a level four and five risk. For now, they have not added that. We will need to monitor updates to see if that is added later.
First off, severe weather is not certain. As always, this far out, there remain questions. The event is still in the day three range.
There remain questions about the quality of moisture return into our region. In order to have severe thunderstorms, you usually need dew points in excess of 58 degrees.
Right now, model guidance is showing dew points reaching the low to mid 60s. If that were to verify then that would be a concern.
Forecasters are struggling with how high dew points will be Tuesday night.
Shower and thunderstorm activity is likely well ahead of the primary cold front. Those showers and thunderstorms will develop Tuesday afternoon and evening. That activity is likely going to remain below severe levels in our local area. I will monitor that portion of the forecast.
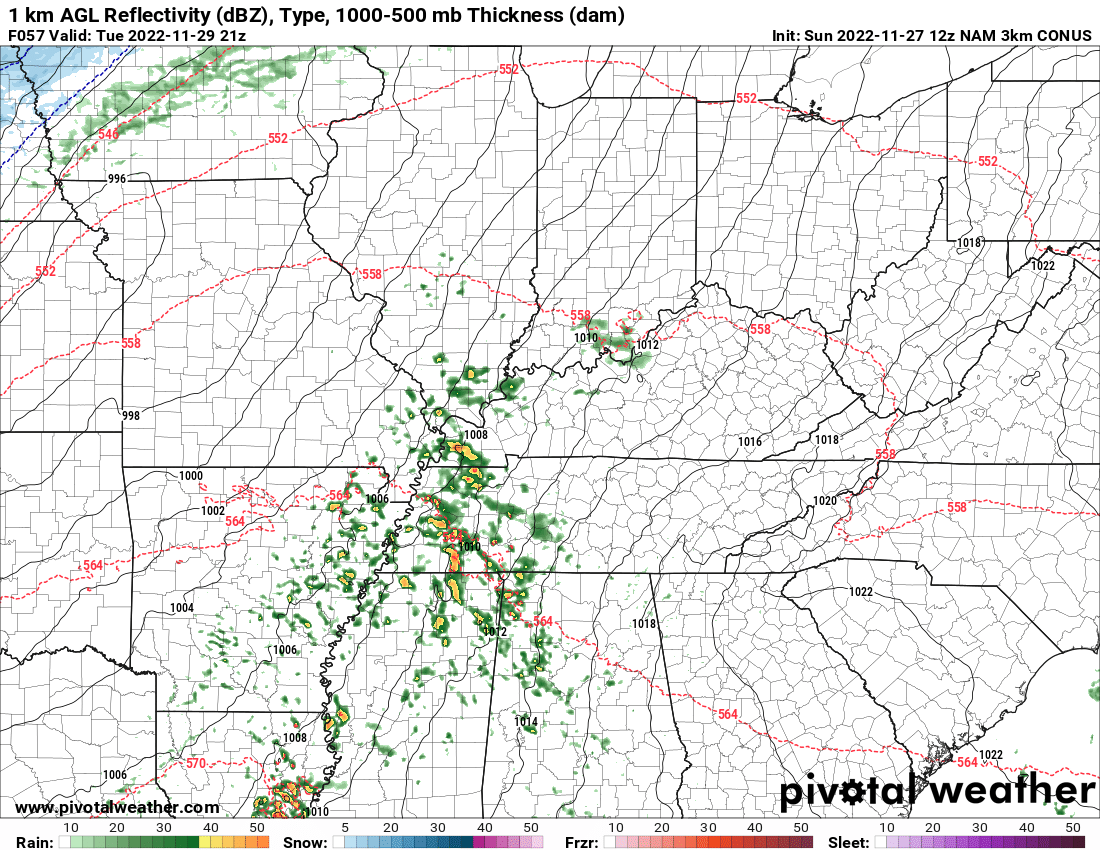
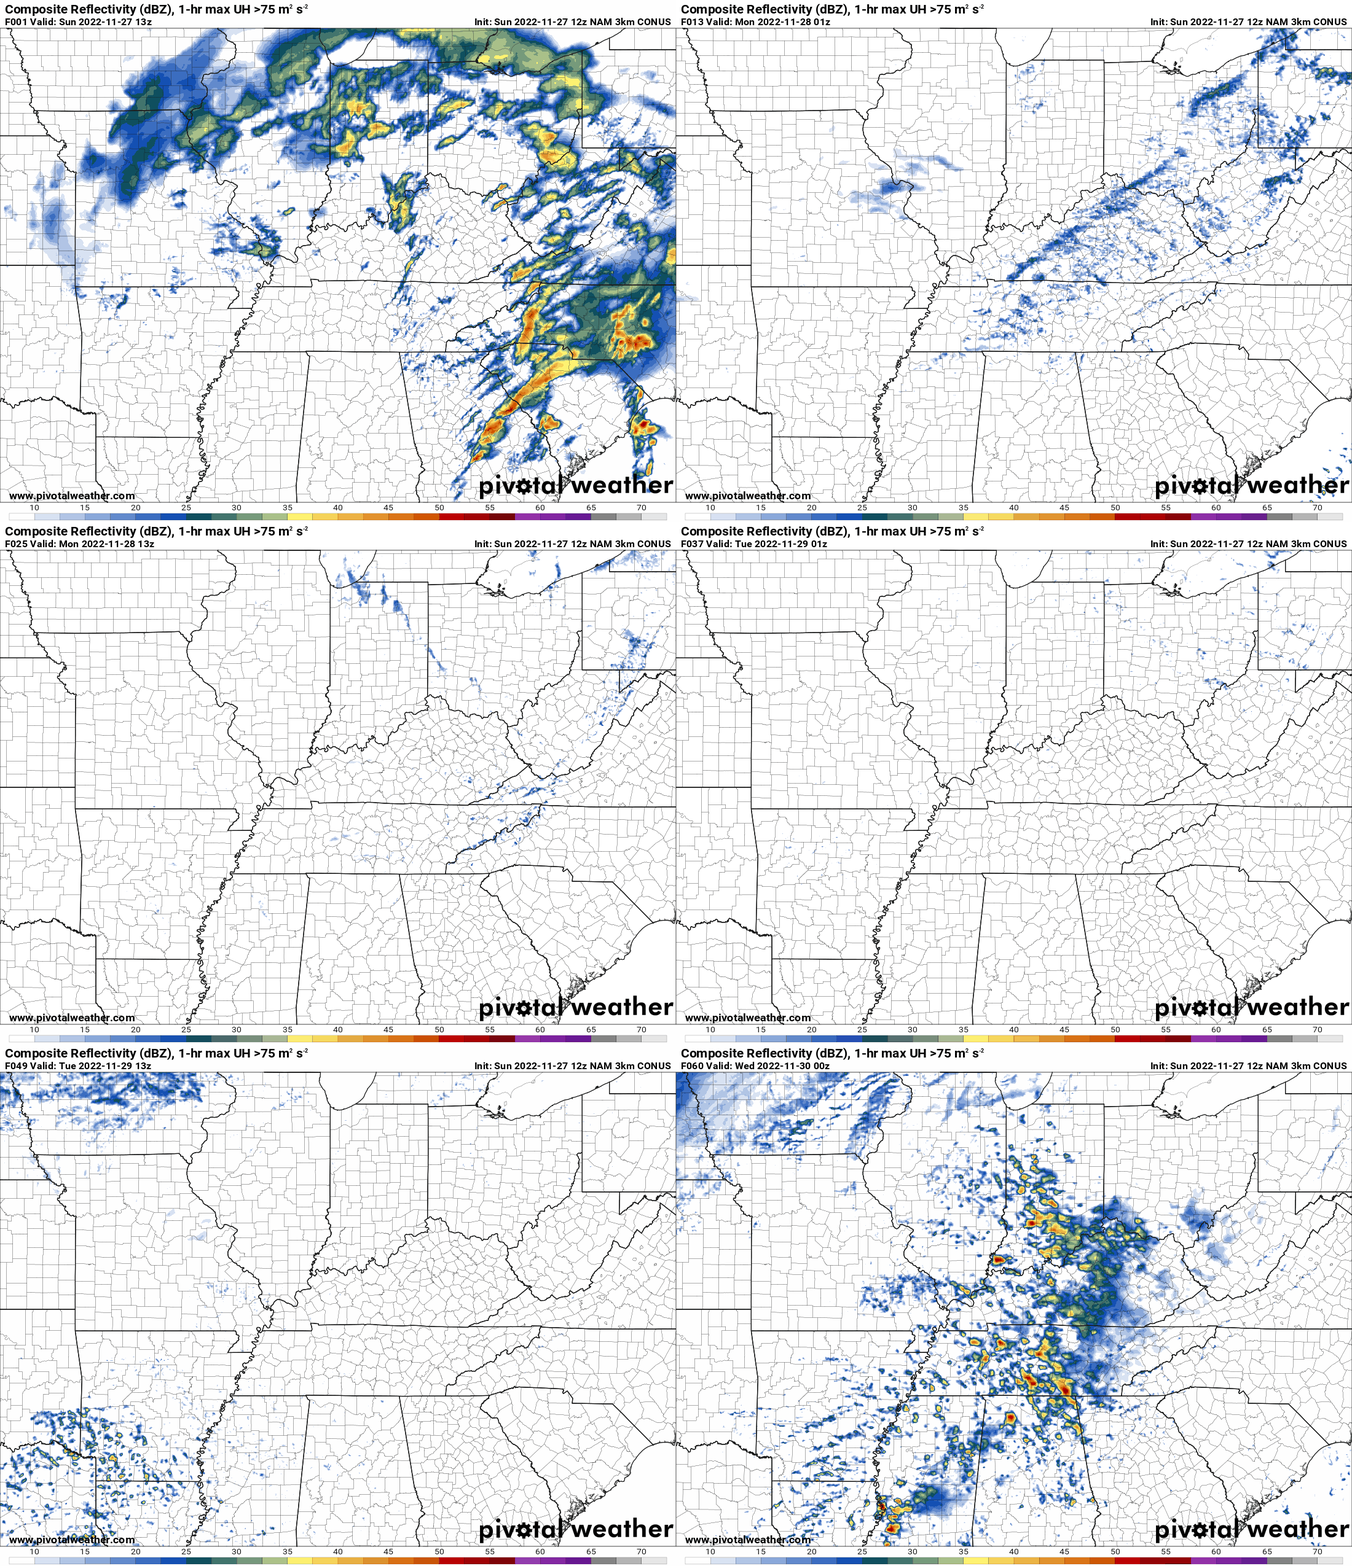
Future-cast radar for Tuesday afternoon showers scattered showers and thunderstorms. Again, at this time it appears these showers and thunderstorms would locally remain below severe levels. I will monitor trends in the guidance in case that changes.
The greater concern arrives Tuesday night. This is when the atmosphere will have the highest instability and wind shear.
Wind shear is when wind changes direction and speed with height. When this happens, the atmosphere has a spin in it. This is what causes thunderstorms to rotate. It is one ingredient for severe thunderstorms and tornadoes.
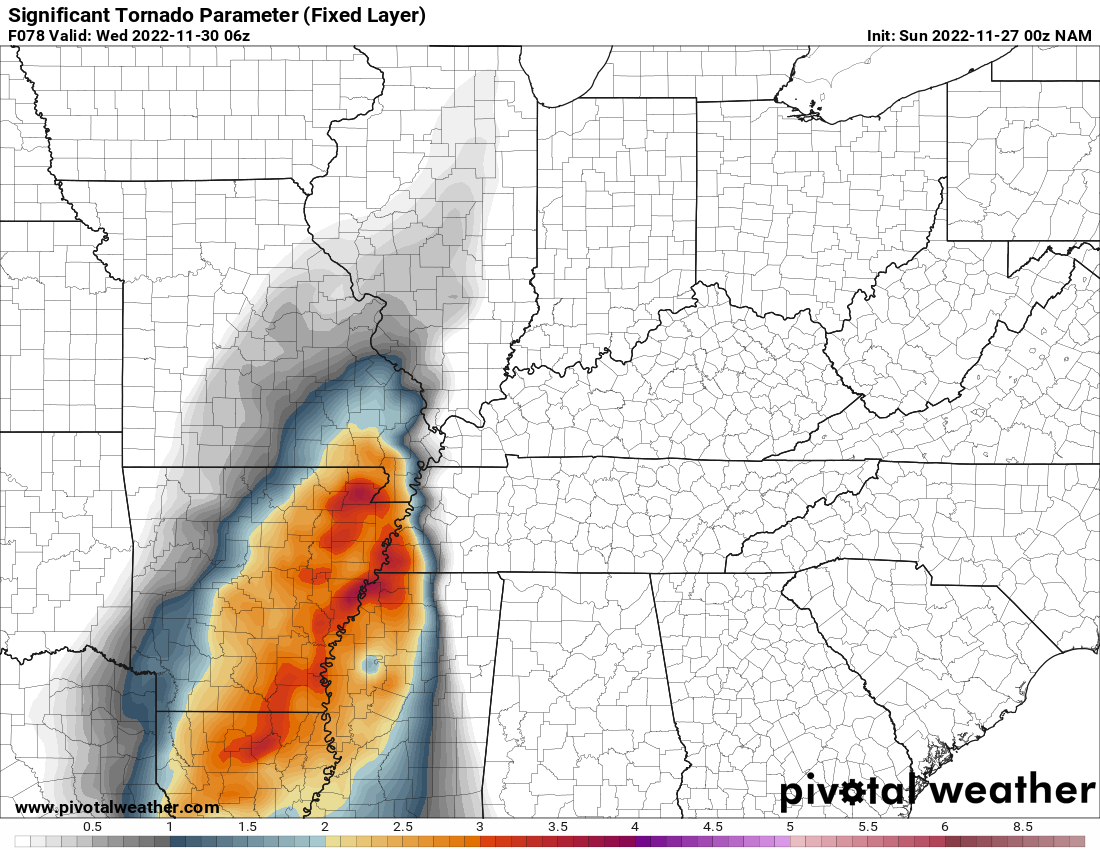
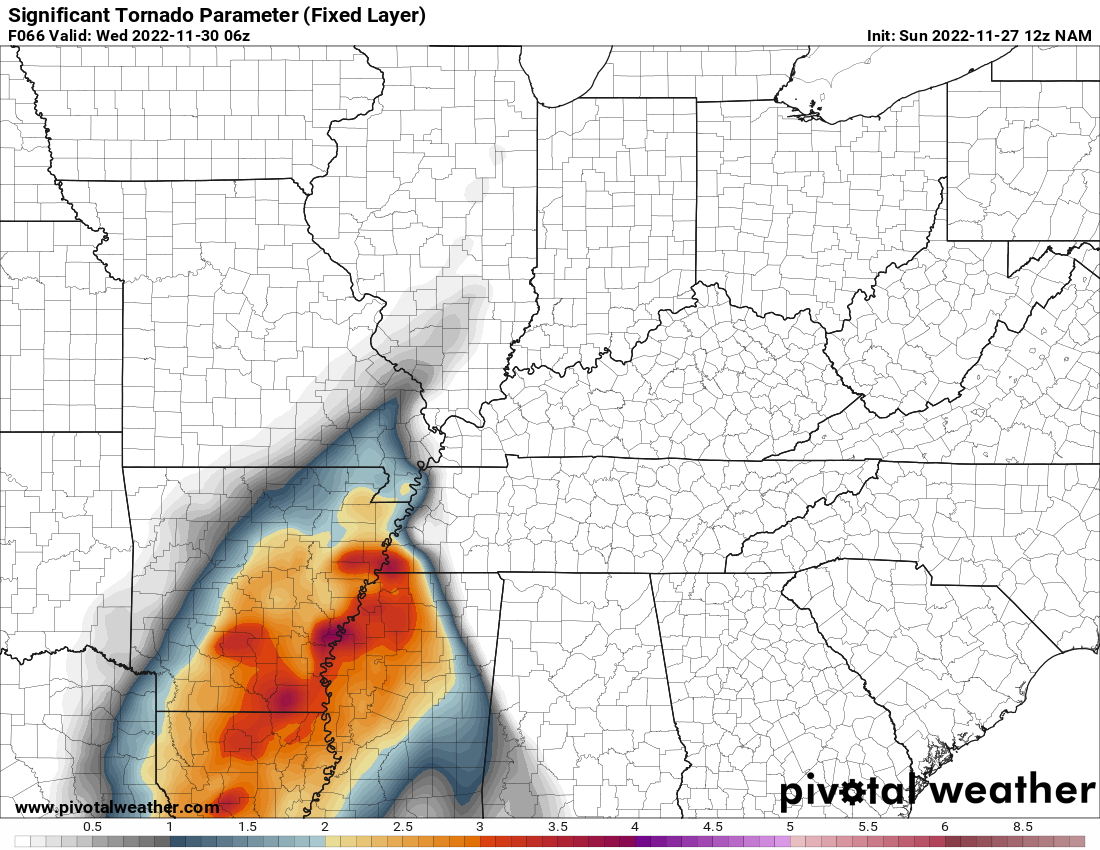
This graphic shows you the significant tornado risk parameter. It is a computer model algorithm that shows you where there is quite a bit of spin in the atmosphere and CAPE (think of CAPE as energy).
This is midnight Tuesday night/Wednesday morning. You can see some high numbers across southeast Missouri into the Missouri Bootheel.
This is the same graphic but six hours later. You can see that the risk extends into the wee morning hours of Wednesday. An overnight severe weather risk. Tuesday night/Wednesday morning.
That particular model shows the wind shear and CAPE waning as we move later into the night. How much it wanes is the biggest question.
I will be monitoring trends on the above map.
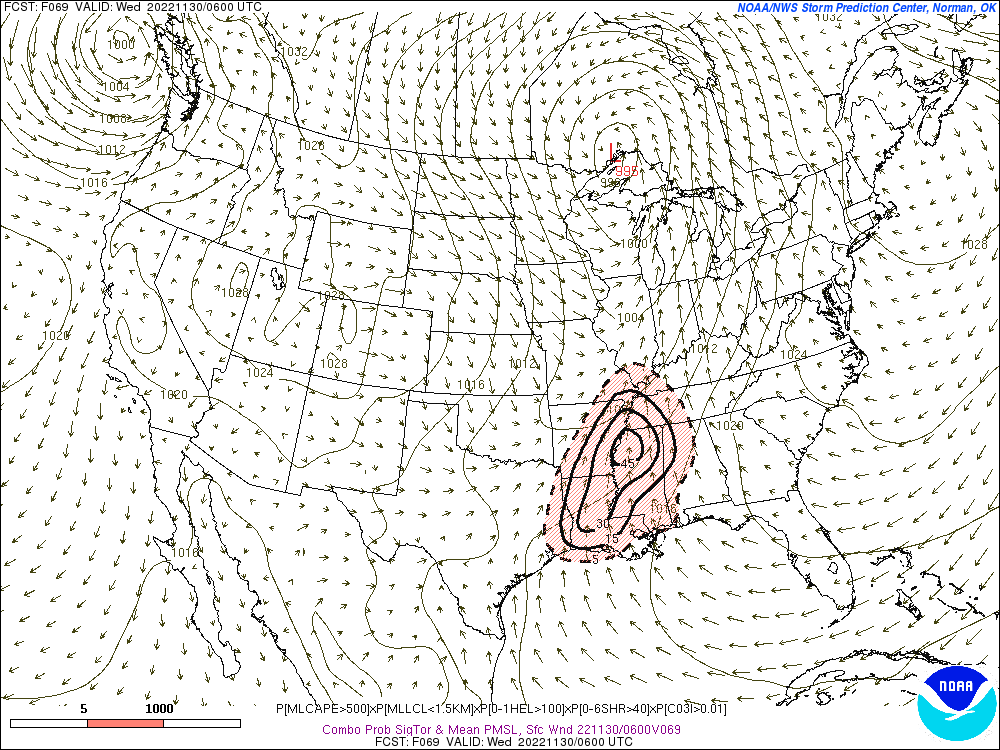
The SREF ensembles show the greatest tornado bulls eye to our south.
I will be monitoring that graphic over the coming 48 to 72 hours, as well.
Our region is on the northern edge of this event.
If thunderstorms can tap into the instability and wind shear, then severe thunderstorms would be the end result.
For now, however, confidence in how this event plays out remains on the low side of the spectrum.
I will be monitoring trends in the guidance. That will tell me what direction the forecast is moving.
For now, we just need to be aware that thunderstorms could be intense Tuesday evening and Tuesday night. This could be an all night event, unfortunately. That increases the threat level. People will be sleeping.
Be aware of changing weather forecasts. Monitor your Beau Dodson Weather app.
The Storm Prediction Center’s outlook (at the bottom of it) discusses the uncertainty as to how far north the severe weather risk extends.
Here is what they said
Begin
The extent of moisture return will determine how far north-northeast the severe threat develops. At this time, it appears that at least some severe threat will be possible during the evening and overnight period as far north as southern Illinois and southwest Indiana. A categorical upgrade will be possible in later outlooks. ..Broyles.. 11/27/2022
End
I will keep everyone updated.
.

Click here if you would like to return to the top of the page.
Again, as a reminder, these are models. They are never 100% accurate. Take the general idea from them.
What should I take from these?
- The general idea and not specifics. Models usually do well with the generalities.
- The time-stamp is located in the upper left corner.
.
What am I looking at?
You are looking at different models. Meteorologists use many different models to forecast the weather. All models are wrong. Some are more wrong than others. Meteorologists have to make a forecast based on the guidance/models.
I show you these so you can see what the different models are showing as far as precipitation. If most of the models agree, then the confidence in the final weather forecast increases.
You can see my final forecast at the top of the page.
Occasionally, these maps are in Zulu time. 12z=7 AM. 18z=1 PM. 00z=7 PM. 06z=1 AM
Green represents light rain. Dark green represents moderate rain. Yellow and orange represent heavy rain.
Red represents freezing rain. Purple represents sleet. Blue represents snow. Dark blue represents heavy snow.
.
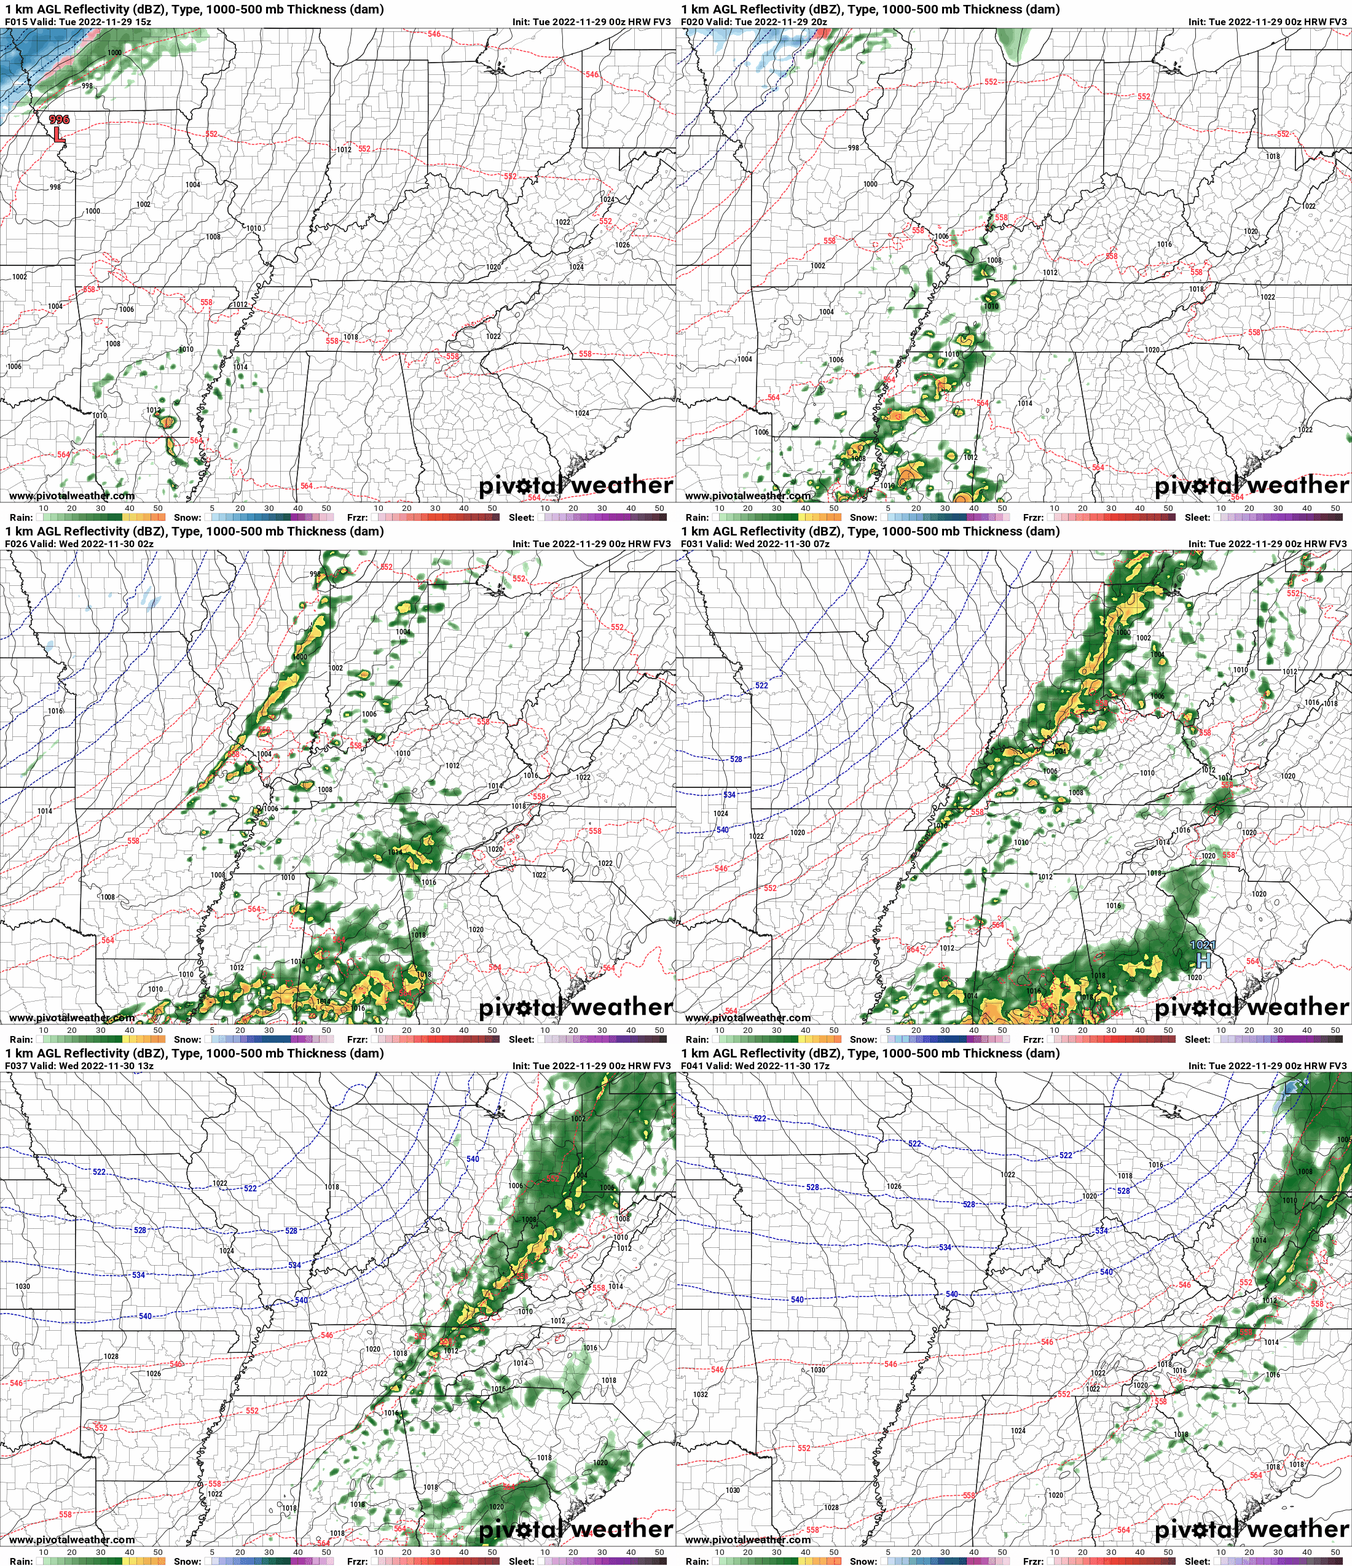
This animation is the HRW FV3 high resolution model.
This animation shows you what radar might look like as the next system pulls through the region. It is a future-cast radar.
Occasionally, these maps are in Zulu time. 12z=7 AM. 18z=1 PM. 00z=7 PM. 06z=1 AM
Green represents light rain. Dark green represents moderate rain. Yellow and orange represent heavy rain.
Red represents freezing rain. Purple represents sleet. Blue represents snow. Dark blue represents heavy snow.
Time-stamp upper left. Click the animation to enlarge it.
.
This animation is the Storm Prediction Center WRF model.
This animation shows you what radar might look like as the next system pulls through the region. It is a future-cast radar.
Time-stamp upper left. Click the animation to enlarge it.
Occasionally, these maps are in Zulu time. 12z=7 AM. 18z=1 PM. 00z=7 PM. 06z=1 AM
Green represents light rain. Dark green represents moderate rain. Yellow and orange represent heavy rain.
Red represents freezing rain. Purple represents sleet. Blue represents snow. Dark blue represents heavy snow.
Time-stamp upper left. Click the animation to enlarge it.
.
This animation is the Hrrr short-range model.
This animation shows you what radar might look like as the next system pulls through the region. It is a future-cast radar.
Occasionally, these maps are in Zulu time. 12z=7 AM. 18z=1 PM. 00z=7 PM. 06z=1 AM
Green represents light rain. Dark green represents moderate rain. Yellow and orange represent heavy rain.
Red represents freezing rain. Purple represents sleet. Blue represents snow. Dark blue represents heavy snow.
Time-stamp upper left. Click the animation to enlarge it.
.
.This animation is the higher-resolution 3K NAM American Model.
Occasionally, these maps are in Zulu time. 12z=7 AM. 18z=1 PM. 00z=7 PM. 06z=1 AM
Green represents light rain. Dark green represents moderate rain. Yellow and orange represent heavy rain.
Red represents freezing rain. Purple represents sleet. Blue represents snow. Dark blue represents heavy snow.
Time-stamp upper left. Click the animation to enlarge it.
.
This next animation is the lower-resolution NAM American Model.
This animation shows you what radar might look like as the system pulls through the region. It is a future-cast radar.
Occasionally, these maps are in Zulu time. 12z=7 AM. 18z=1 PM. 00z=7 PM. 06z=1 AM
Green represents light rain. Dark green represents moderate rain. Yellow and orange represent heavy rain.
Red represents freezing rain. Purple represents sleet. Blue represents snow. Dark blue represents heavy snow.
Time-stamp upper left. Click the animation to enlarge it.
.
This next animation is the GFS American Model.
This animation shows you what radar might look like as the system pulls through the region. It is a future-cast radar.
Occasionally, these maps are in Zulu time. 12z=7 AM. 18z=1 PM. 00z=7 PM. 06z=1 AM
Green represents light rain. Dark green represents moderate rain. Yellow and orange represent heavy rain.
Red represents freezing rain. Purple represents sleet. Blue represents snow. Dark blue represents heavy snow.
Time-stamp upper left. Click the animation to enlarge it.
.
This next animation is the EC European Weather model.
This animation shows you what radar might look like as the system pulls through the region. It is a future-cast radar.
Occasionally, these maps are in Zulu time. 12z=7 AM. 18z=1 PM. 00z=7 PM. 06z=1 AM
Green represents light rain. Dark green represents moderate rain. Yellow and orange represent heavy rain.
Red represents freezing rain. Purple represents sleet. Blue represents snow. Dark blue represents heavy snow.
Time-stamp upper left. Click the animation to enlarge it.
.
Today’s outlook (below).
Light green is where thunderstorms may occur but should be below severe levels.
Dark green is a level one risk. Yellow is a level two risk. Orange is a level three (enhanced) risk. Red is a level four (moderate) risk. Pink is a level five (high) risk.
One is the lowest risk. Five is the highest risk.
A severe storm is one that produces 58 mph wind or higher, quarter size hail, and/or a tornado.
The tan states are simply a region that SPC outlined on this particular map. Just ignore that.

The black outline is our local area.


.
Tomorrow’s severe weather outlook.


.![]()
.

Click here if you would like to return to the top of the page.
Again, as a reminder, these are models. They are never 100% accurate. Take the general idea from them.
What should I take from these?
- The general idea and not specifics. Models usually do well with the generalities.
- The time-stamp is located in the upper left corner.
.
What am I looking at?
You are looking at different models. Meteorologists use many different models to forecast the weather. All models are wrong. Some are more wrong than others. Meteorologists have to make a forecast based on the guidance/models.
I show you these so you can see what the different models are showing as far as precipitation. If most of the models agree, then the confidence in the final weather forecast increases.
You can see my final forecast at the top of the page.
Occasionally, these maps are in Zulu time. 12z=7 AM. 18z=1 PM. 00z=7 PM. 06z=1 AM
This animation is the HRW FV3 high resolution model.
This animation shows you what radar might look like as the next system pulls through the region. It is a future-cast radar.
Time-stamp upper left. Click the animation to enlarge it.
.
This animation is the Storm Prediction Center WRF model.
This animation shows you what radar might look like as the next system pulls through the region. It is a future-cast radar.
Time-stamp upper left. Click the animation to enlarge it.
Occasionally, these maps are in Zulu time. 12z=7 AM. 18z=1 PM. 00z=7 PM. 06z=1 AM
.
This animation is the Hrrr short-range model.
This animation shows you what radar might look like as the next system pulls through the region. It is a future-cast radar.
Time-stamp upper left. Click the animation to enlarge it.
Double click the animation to enlarge it.
Occasionally, these maps are in Zulu time. 12z=7 AM. 18z=1 PM. 00z=7 PM. 06z=1 AM
.
.This animation is the higher-resolution 3K NAM American Model.
Double click the animation to enlarge it.
Occasionally, these maps are in Zulu time. 12z=7 AM. 18z=1 PM. 00z=7 PM. 06z=1 AM
.
This next animation is the lower-resolution NAM American Model.
This animation shows you what radar might look like as the system pulls through the region. It is a future-cast radar.
Time-stamp upper left. Click the animation to enlarge it.
Occasionally, these maps are in Zulu time. 12z=7 AM. 18z=1 PM. 00z=7 PM. 06z=1 AM
.
Charge your devices in case of power outages.

What you can do to prepare for severe weather
Here is some safety advice from the NWS concerning sheltering from storms. https://www.weather.gov/ama/severesafetytips
1. Have a family safety plan. Discuss it with your family. Make sure your kids know what to do in the event of severe weather.
2. Have your devices fully charged.
3. Change the batteries in your NOAA weather radio.
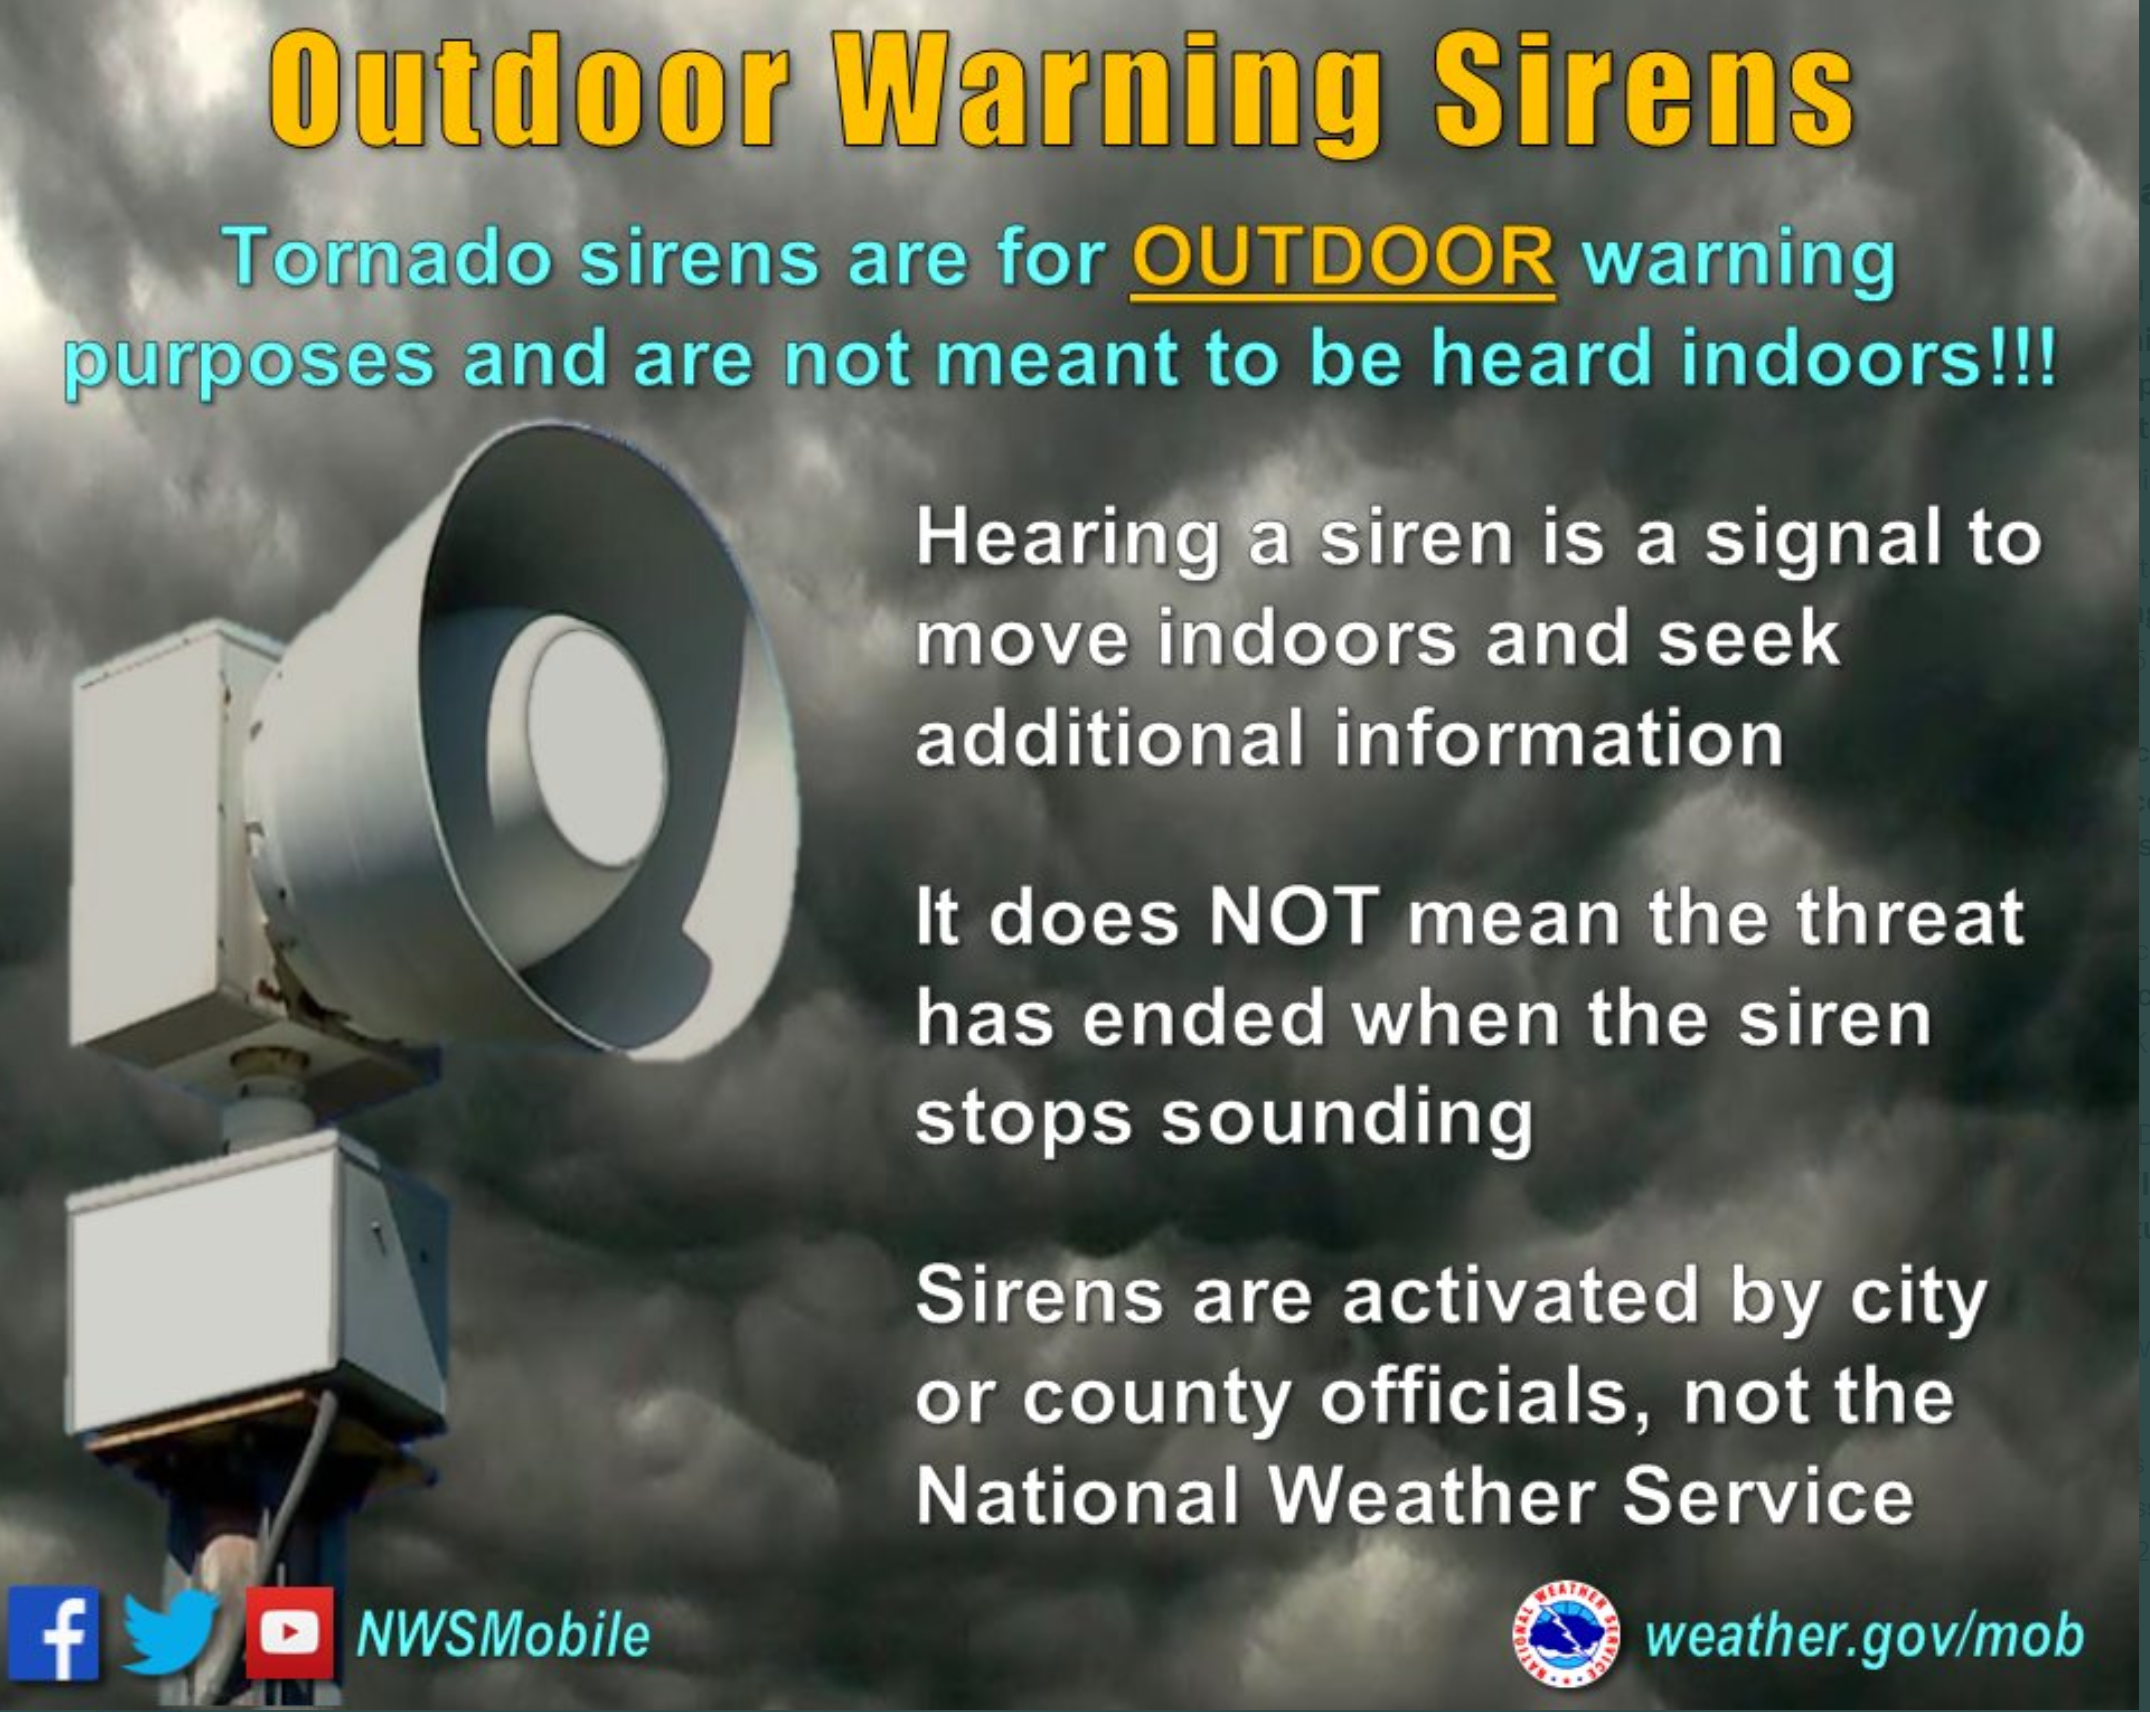
4. Have THREE TO FIVE ways of receiving your severe weather information. All sources can and have failed in the past. The Beau Dodson Weather app is one of those ways, NOAA weather radio, WEA on your phones (google it), local television and radar media, additional weather apps, and outdoor sirens. Do not rely on just the outdoor warning sirens.
5. Leave your shoes and wallet/keys by the bed. If a warning is issued overnight then you will be prepared.
6. We recommend people wear helmets during tornado warnings. In the event of an actual tornado then you will be thankful to have a helmet.
7. Have a thick blanket in your tornado safe-space.
8. Prescription medicine.
Create an emergency supply kit. If the storm is likely to cause a lot of damage, it’s important to be prepared for a variety of problems. Things that you should put in a basic supply kit include:
- Flashlights and extra batteries.
- Emergency radio.
- First aid kit
- Whistle, to alert people to your location.
- Personal sanitation products, such as garbage bags, toilet paper, paper towels, wet wipes, and tampons/pads.
- Plastic tarps
- Extra warm clothes.
- Dusk masks.
- Utility shut off tools.
Know your safety plan. Make sure your kids know the severe weather safety plan.
Have helmets in your safe space. Any kind of helmet is better than no helmet.
Noah Stewart shelters in the closet just 15 minutes before an April 2011 tornado demolished his house. Wearing the helmet may have saved his life, one doctor says.
Now is the time to prepare for severe weather.
Have three to five ways of receiving your severe weather information.
Know your families safety plan in the event severe weather develops.
Have multiple ways of receiving severe weather information. Not just my weather app. Have other ways, as well. All technology can fail. Thus, having more than one source will help keep you safe.
Remember, a WATCH means to monitor updates. You don’t have to change your behavior for a watch. Be prepared.
A WARNING is more serious. A WARNING means severe weather is imminent in or near your location. A WARNING means to seek shelter.
.
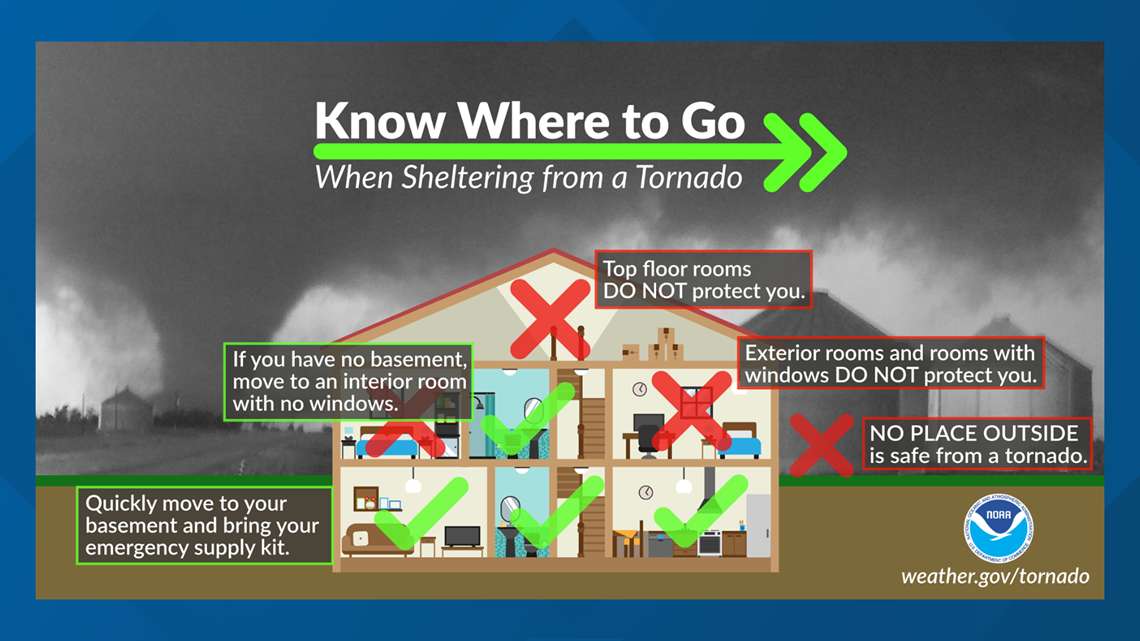
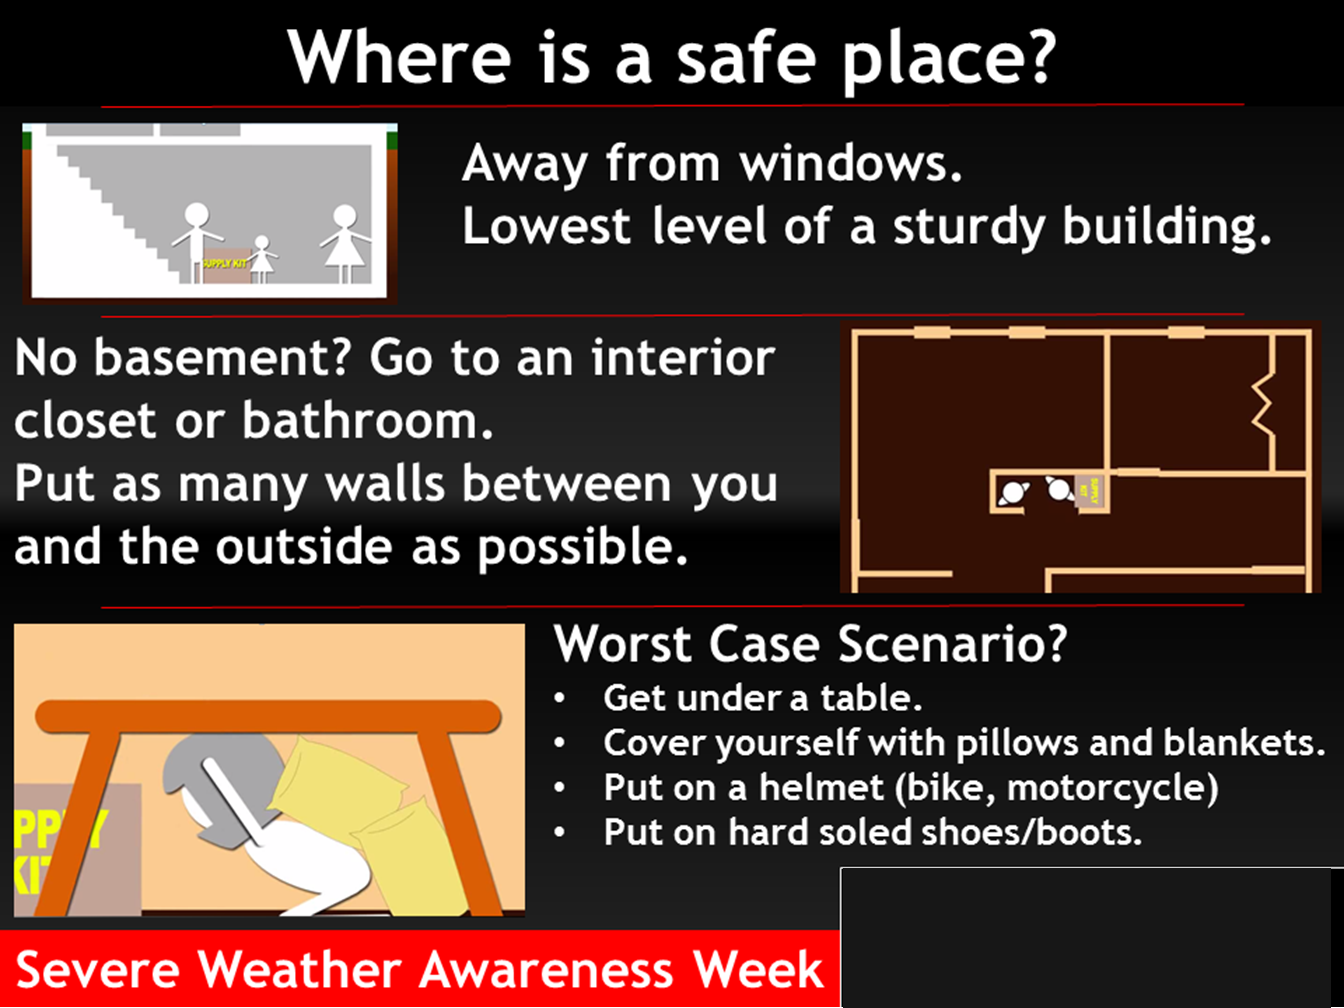
Where is a safe place to hide when tornadoes threaten your location.
![]()
Today’s severe weather outlook from the Storm Prediction Center (below).
Light green is where thunderstorms may occur but should be below severe levels.
Dark green is a level one risk. Yellow is a level two risk. Orange is a level three (enhanced) risk. Red is a level four (moderate) risk. Pink is a level five (high) risk.
One is the lowest risk. Five is the highest risk.
A severe storm is one that produces 58 mph wind or higher, quarter size hail, and/or a tornado.
The tan states are simply a region that SPC outlined on this particular map. Just ignore that.

The black outline is our local area.

.
Tomorrow’s severe weather outlook.

.
SUBSCRIBERS: Download the WeatherTalk app to keep abreast of my latest information.
The app is for subscribers. Subscribe at www.weathertalk.com/welcome then go to your app store and search for WeatherTalk
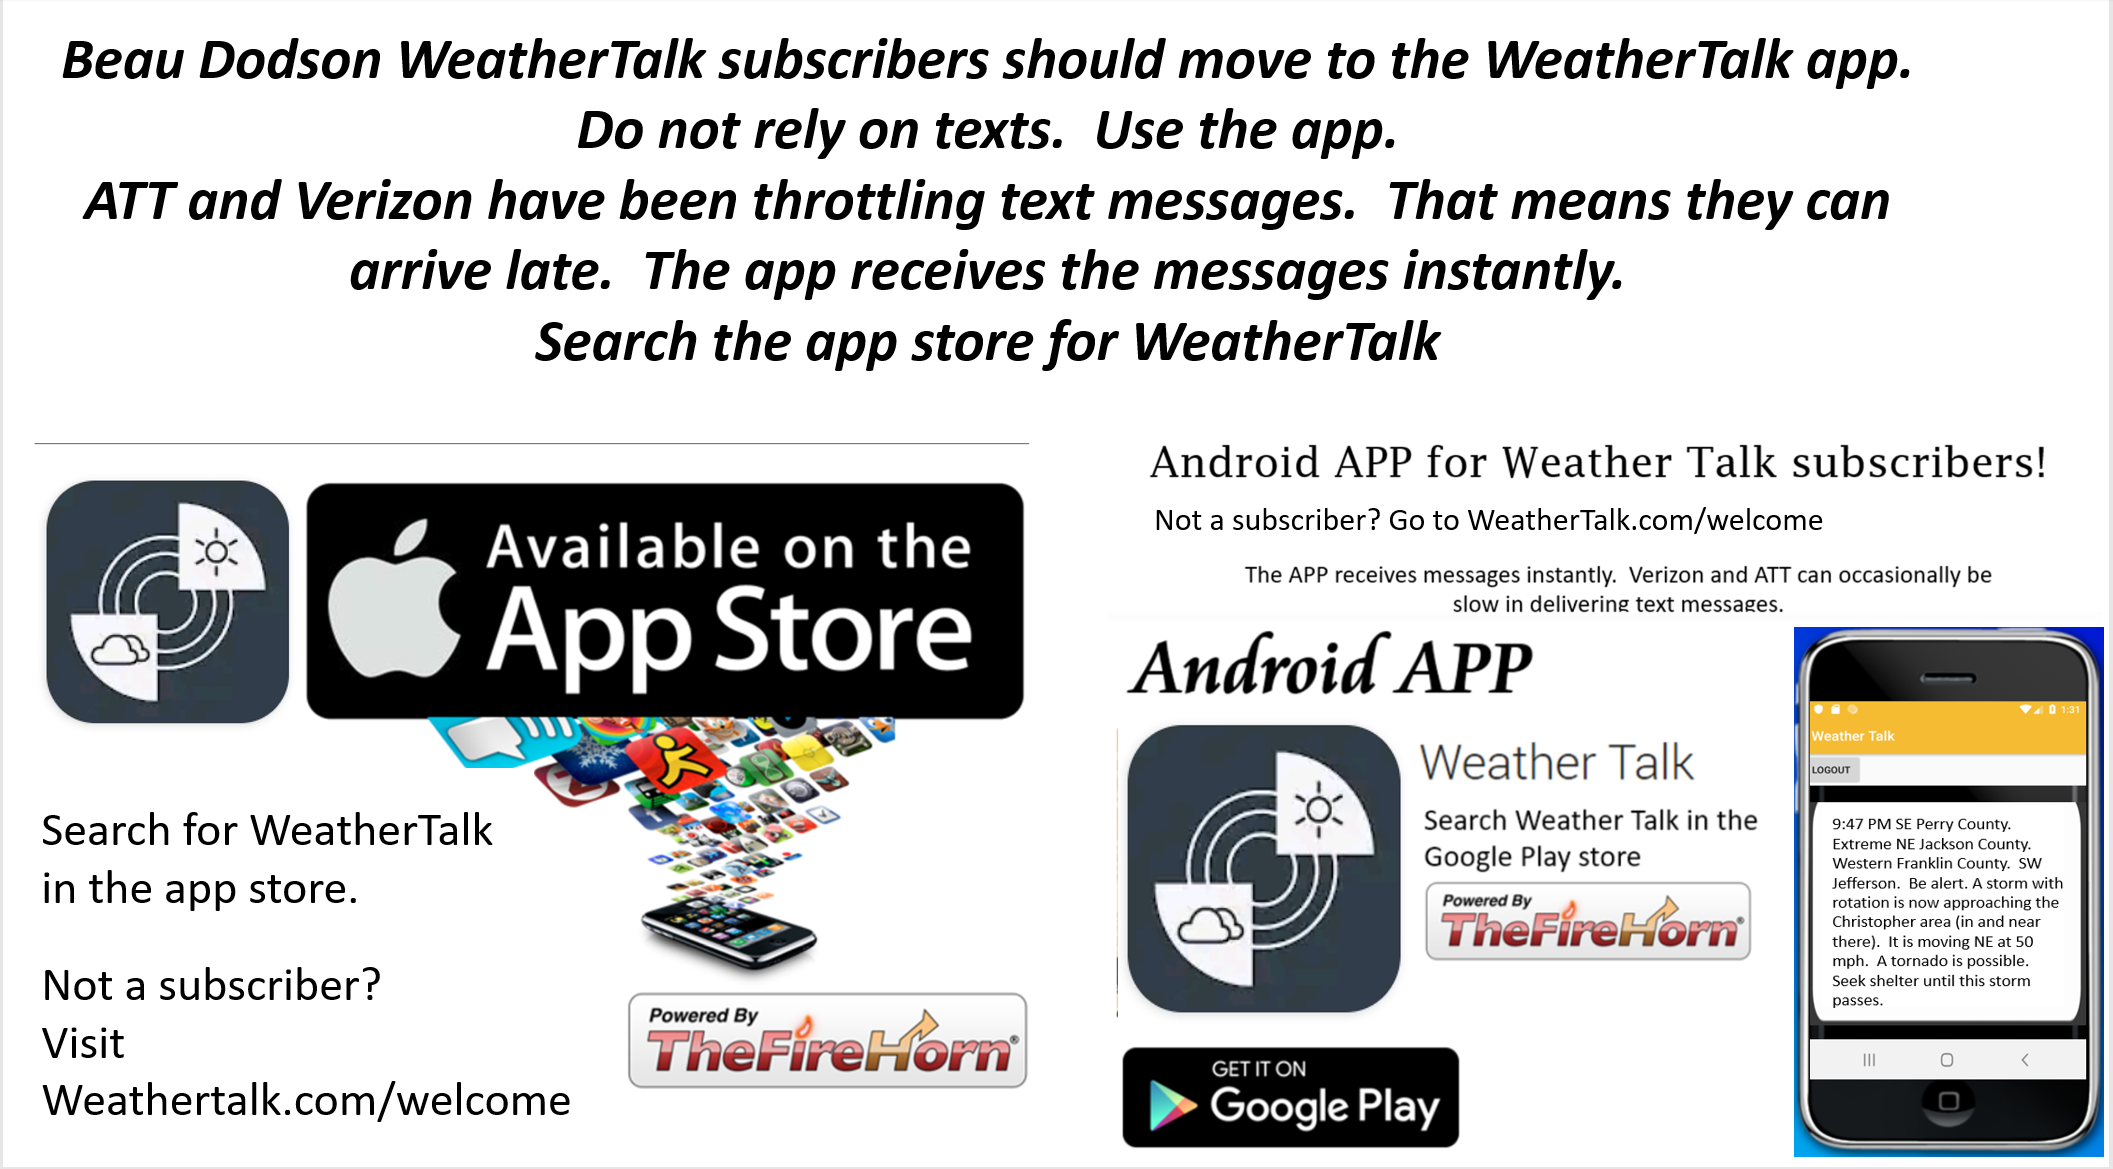
Subscribers, PLEASE USE THE APP. ATT and Verizon are not reliable during severe weather. They are delaying text messages.
The app is under WeatherTalk in the app store.
Apple users click here
Android users click here
![]()
![]()
.

Radar Link: Interactive local city-view radars & regional radars.
You will find clickable warning and advisory buttons on the local city-view radars.
If the radar is not updating then try another one. If a radar does not appear to be refreshing then hit Ctrl F5. You may also try restarting your browser.
Not working? Email me at beaudodson@usawx.com
Backup radar site in case the above one is not working.
https://weathertalk.com/morani
New ZOOM radar (with storm chasers)
https://wtalk.co/AVWG7GM7
Regional Radar
https://imagery.weathertalk.com/prx/RadarLoop.mp4
Lightning Data (zoom in and out of your local area)
https://wtalk.co/WJ3SN5UZ
Satellite Data
Computers and tablets. These two satellite links may not work well on cell phones.
Visible Satellite. This one is to be used during daylight only. Be sure and hit refresh once you are on the satellite page. Otherwise, the data will be old.
https://col.st/a5A0e
IR Satellite. This one shows cloud temperatures. Bright colors represent cold cloud tops. That could mean thunderstorms. Be sure and hit refresh once you are on the satellite page. Otherwise, the data will be old.
https://col.st/R2fw1
Water Vapor Satellite. This one shows mid-level moisture in the atmosphere. Be sure and hit refresh once you are on the satellite page. Otherwise, the data will be old.
https://col.st/xFVwx
.

Live lightning data: Click here.
Not receiving app/text messages?
Log in and out of your app.
USE THE APP. ATT and Verizon are slowing or stopping the text messages. Move to the app (not texts).
Make sure you have the correct app/text options turned on. Find those under the personal notification settings tab at www.weathertalk.com. Red is off. Green is on.
Subscribers, PLEASE USE THE APP. ATT and Verizon are not reliable during severe weather. They are delaying text messages.
The app is under WeatherTalk in the app store.
Apple users click here
Android users click here
.


