Januar 31, 2026
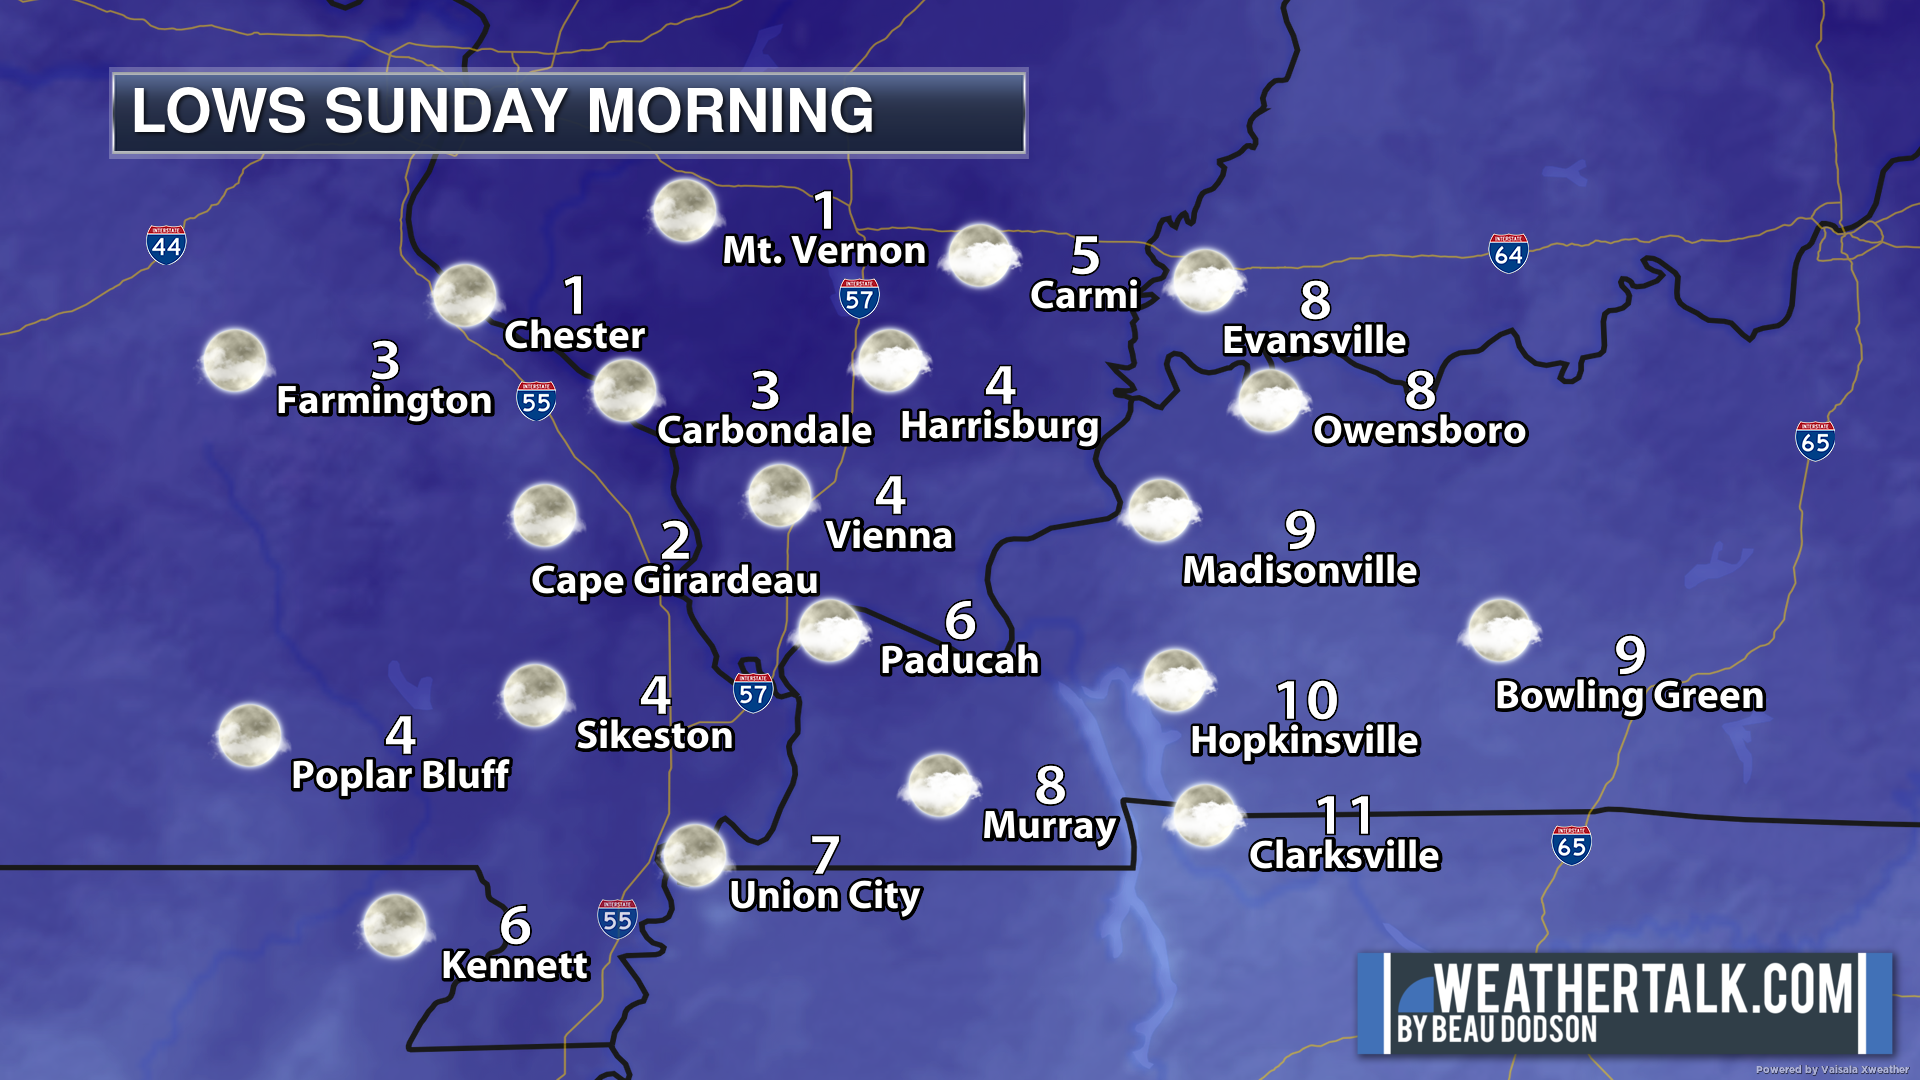
Bitterly cold temperatures tonight/Sunday morning.
Here are the forecast temperatures.
An educational thread to answer some of your questions about weather models.
I know some of you want to learn more about our forecasting process. This thread is for you!
Some precipitation is likely on Tuesday into Wednedsay morning.
This has been in the charts for over a week.
People have been asking me which model scores the highest.
The fact is, is that all models are wrong. Some are more wrong than others.
We do have short range models like the NAM, Hrrr, FFV3, and others.
Short-range models are called CAMs. Convective allowing models.
CAMs do well during severe weather outbreaks. They are also useful during winter storms.
CAMs have higher resolutions than global models.
The highest scores are EC and ECAI. EC is a European model. It does very well in the short and long range.
It is considered a global model.
Additional examples of ensembles include the GFS American model and the Canadian model.
ECAI is relatively new and is an AI model. Surprisingly, it is beating more of our old models. This is good news for the future of guidance!
The GFS is an American model. It scores poorly. It is also a global model.
Last week, for days on end, the GFS showed no snow or ice in our region. It could not have been more wrong.
Ultimately, we experienced a major winter storm. That included some counties recording historic snow totals.
There are days when I think we should take the GFS behind the woodshed and Old Yeller it.
Sorry, I digress.
If you are a snow lover, then the GFS model is for you. It typically delivers 200-300 inches of snow per year to our region.
How much actually falls? Usually between 5 and 10 inches.
That is how bad the model is.
This is why people should not post long-range models, like the GFS. They are not accurate past a few days. All they do is feed people’s storm anxiety during the winter.
Some local pages post just about every long-range winter storm. Yes, from time to time, they are correct. Which is luck more than forecasting skill.
They aren’t actually forecasting anything. They are simply showing you one model run. One frame in time.
The global models run every six hours. The very next model run may show no snow at all. They never show you those model runs.
Those pages miss about 8 out of 10 of the forecasts. In other words, their accuracy is about twenty percent. That is a poor score.
When they get one right, they boast and say they were first. All the while, ignoring all of the missed forecasts.
Oops, I am digressing again.
Okay,
As a meteorologist, I aim to achieve 80%-90% accuracy in my forecasts Same with all the other local meteorologists.
Accuracy is the goal.
I call the GFS my guilty pleasure for watching long-range snow events. I love snow (sorry, don’t bring pitchforks), thus the GFS always gives me hope.
I like the four seasons in our region. I want spring to be spring and winter to be winter.
For the forecast, however, I usually move over to the other models and then compare them with the GFS.
As mentioned above, I tell people that all models are wrong. Some are just more wrong than others.
What meteorologists must piece together is the best forecast using all available data. That includes current maps, radar, satellite imagery, and model data.
That sometimes means looking over more than 300 model points.
We then review the guidance and identify the solution we believe will verify.
We watch for trends in the long range. Are models trending warmer or colder? Are models trending towards a higher precipitation event or a lower precipitation event?
In the weather world, we say “the trend is your friend” when forecasting in the long term.
In other words, an accurate meteorologist will closely monitor trends. And adjust their forecast to reflect that trend.
Also, part of forecasting comes from experience in living around here for decades.
During the last event, even with all the available data, we weren’t 100% sure where to place the freezing-rain/sleet line. And, the sleet vs snow line.
That is not unusual for a winter storm in our region.
Keep in mind that I forecast from Mt Vernon, Illinois, down to northwest Tennessee. From Poplar Bluff, Missouri, to Hopkinsville and Owensbore Kentucky.
That is a huge area for an accurate winter storm forecast.
It is not unusual for northern portions of southern Illinois to receive heavy snow.
The central portions of our region to receive freezing rain and sleet.
And for the southern portions of our region, to receive plain old rain!
During last week’s winter storm, we were within about 20-25 miles of being correct.
That is pretty good for “as the bird flies” placement of the final precipitation totals.
,
We were literally trying to thread a needle with the storm’s track
As I mentioned before the last winter storm, a shift of 25 air miles in the storm’s track would completely change your backyard forecast.
This is one reason I tell everyone to FOCUS on impacts, not exact totals. There is always a range of totals.
The impacts were bitterly cold temperatures and icy roads. In the end, that did verify across the region.
It shifted slightly northward while the winter storm was underway.
Winter storm forecasting has come a long way! When I was a kid, it was not unusual for a winter storm to be forecast, and nothing happened. Not one flake!
Pretty disappointing to an eight-year-old holding a flashlight out his window into the night sky to see if I could find a snowflake!
Thankfully, those days are extremely rare today.
Looking ahead.
February looks fairly active with multiple precipitation events.
We do have a light event this coming week.
I told everyone yesterday that it would likely be Sunday before the final forecast came into better focus.
One data point I have been tracking is the ensemble data.
What are ensembles? Great question!
Weather model ensembles (e.g., EC and GFS) are sets of forecasts initialized from slightly different initial conditions.
In other words, they run the model dozens of times. Each time with a slightly different starting point.
The general idea is that the more squares that agree (or sort of agree), the higher the probability of that outcome.
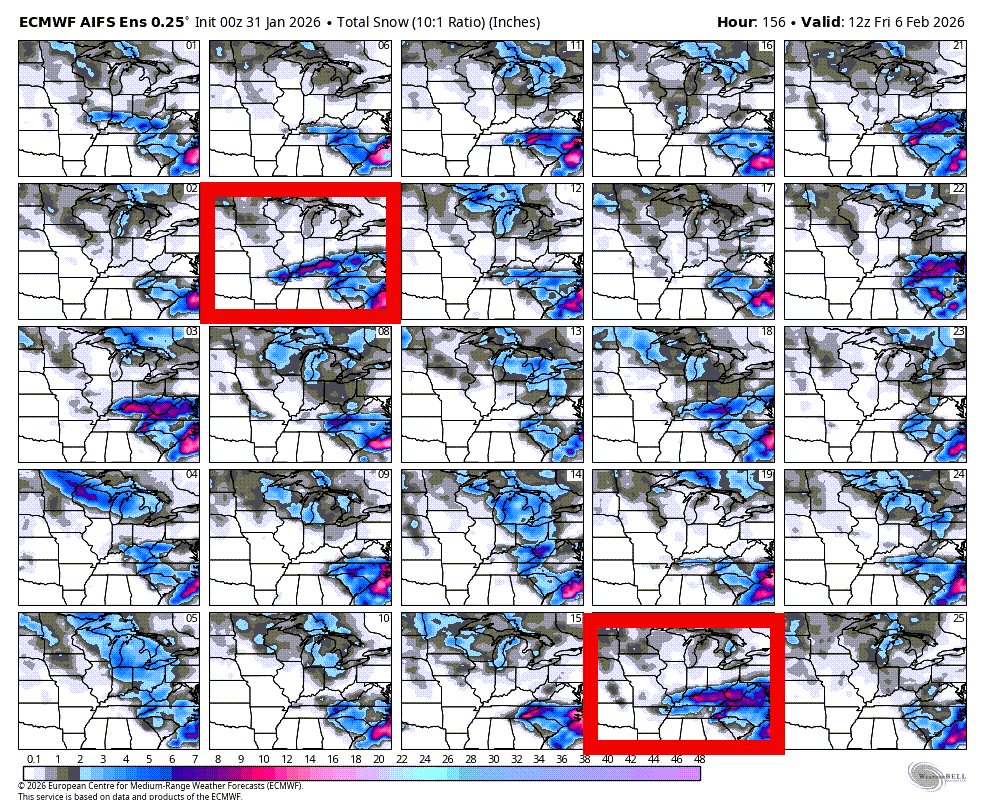
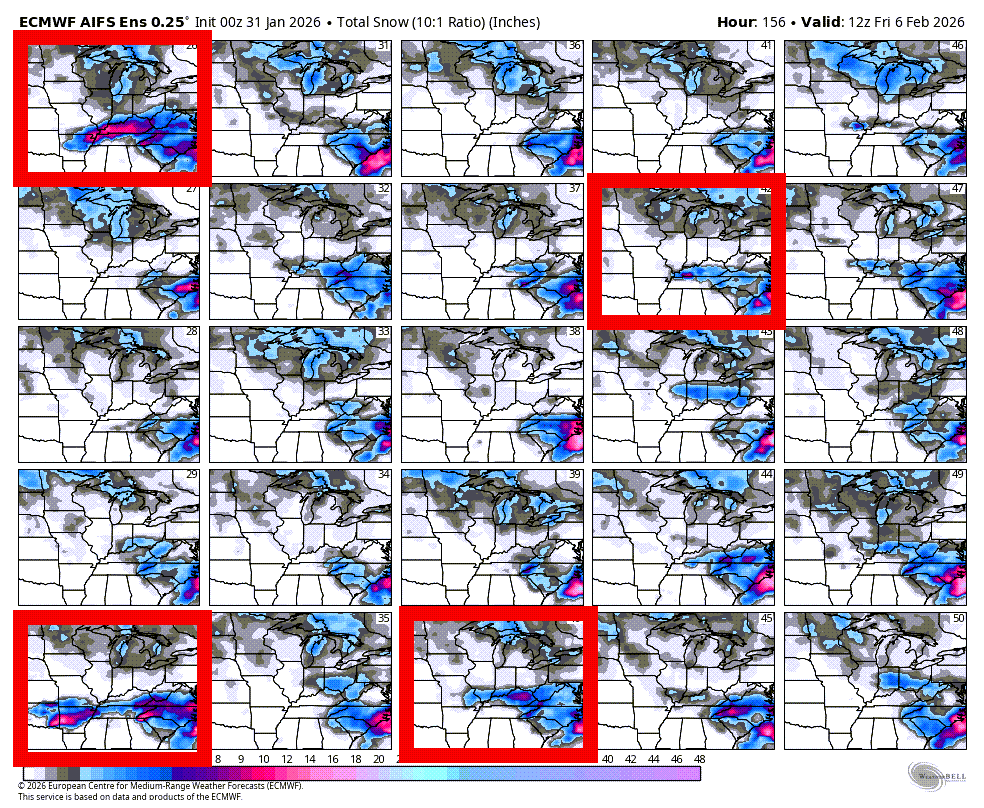
For example, the EC model runs over 50 times.
I have included the EC model ensembles in this post. Each square represents one model run.
I placed a red square around the runs that look similar.
A few days ago, over 50% of the squares showed a decent winter storm in our region this coming week.
Now, only a handful of squares show more than a few inches of snow or ice.
In other words, the trend is toward a less significant winter storm. It is moving away from a heavy precipitation event.
Is it correct? Perhaps, but it also isn’t a slam-dunk forecast.
Sufficient data indicate the potential for a wintry mix, warranting caution when making a final forecast.
Keep in mind that only a little sleet or freezing rain can cause travel headaches. Thus, we need to monitor this system for the potential of a wintry mix.
For now, the forecast includes rain and a wintry mix.
I want to review tomorrow’s data before finalizing the forecast solution. Or, at least sliding towards the final outcome.
I have also attached the ensemble mean. A mean is the average of all the data points.
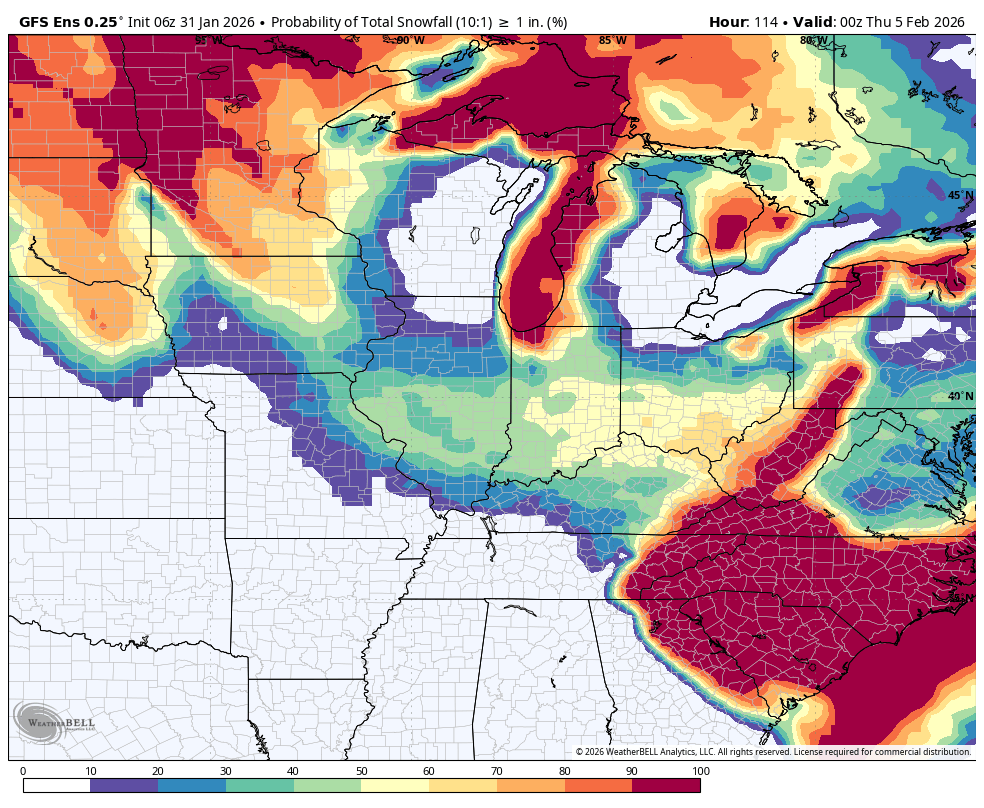
I included the EC and GFS ensemble means for snowfall of 1 inch or more through next Thursday.
A broad view of the forecast is typically made several days out from an event. No details, but the general idea of where we are headed with the forecast.
An accurate winter storm forecast is typically made 24 to 48 hours in advance.
Even then, there could be small adjustments.
Everyone should pop above freezing on Monday and Tuesday. That is good news for our ice-covered roads.
The long-range shows multiple rain and snow events in our region through the third week of February.
The good news is that spring is only 48 days away! Winter is not quite over yet.
Whether the groundhog sees its shadow is the real question. By the way, never trust a groundhog for your forecast!
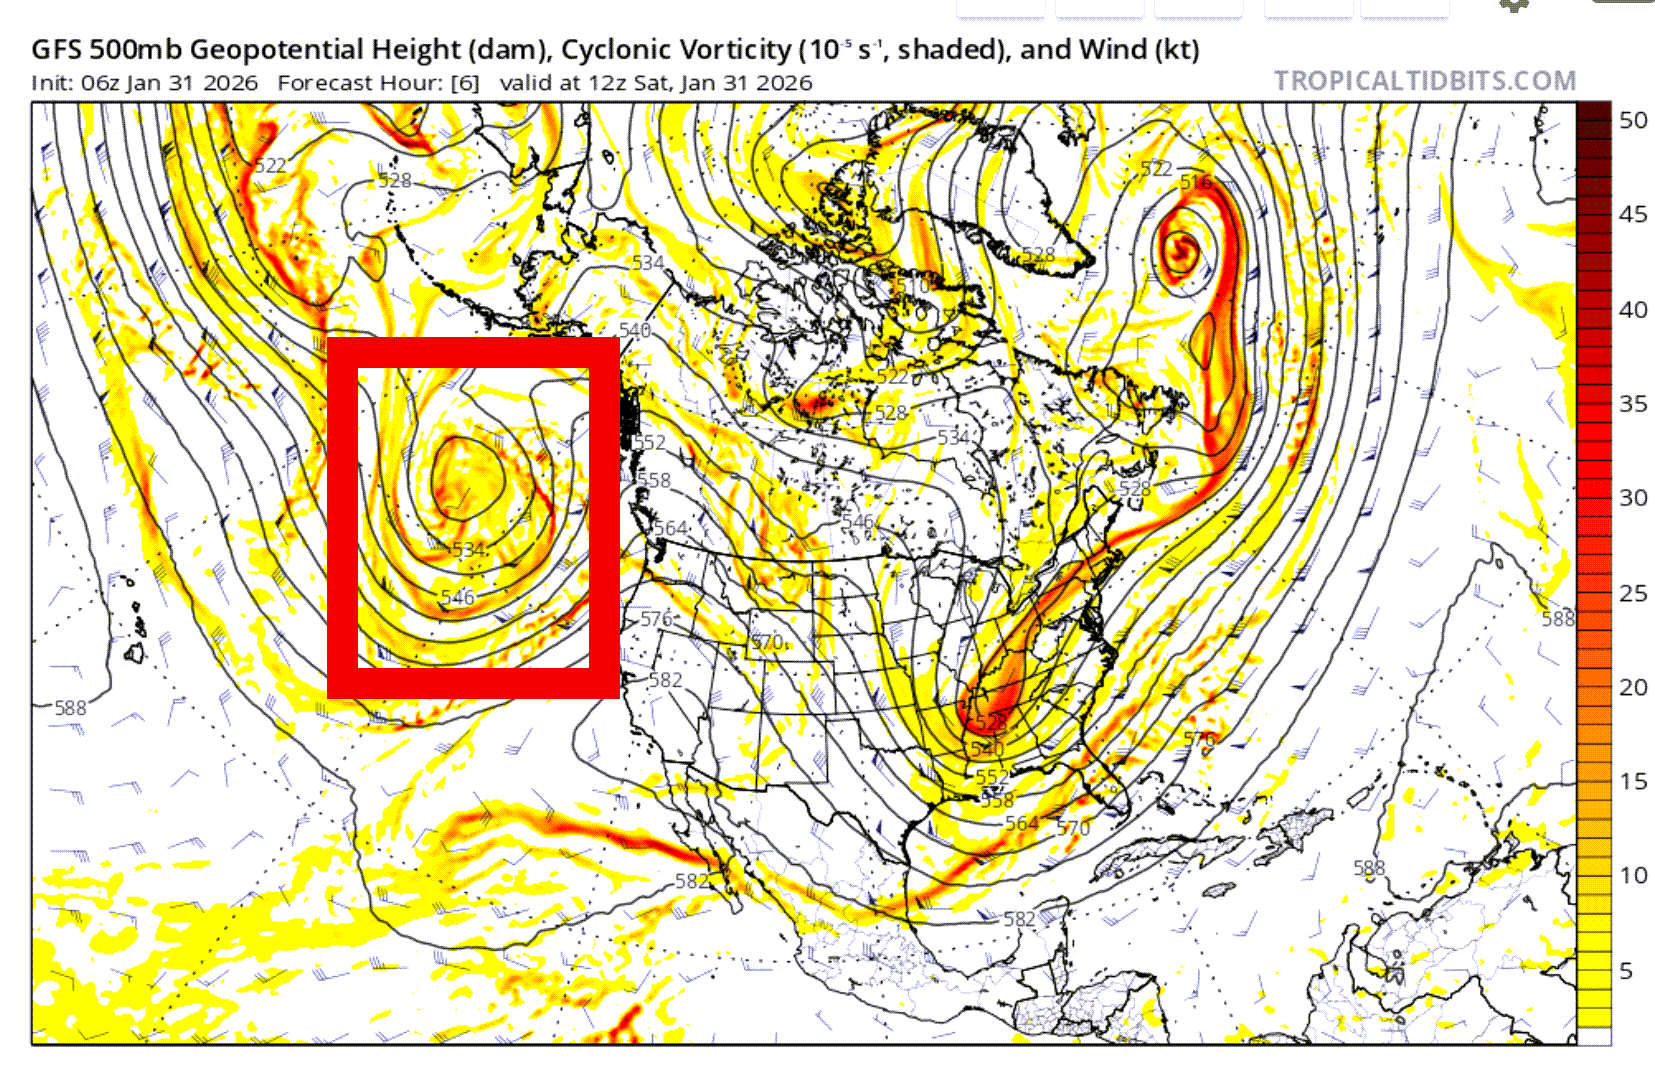
The Tuesday/Wednesday system is still out over the Pacific Ocean. The red square is part of the system in question.
EC ensembles showing you snow and wintry mix totals.
The GFS mean for one inch or more or snow.
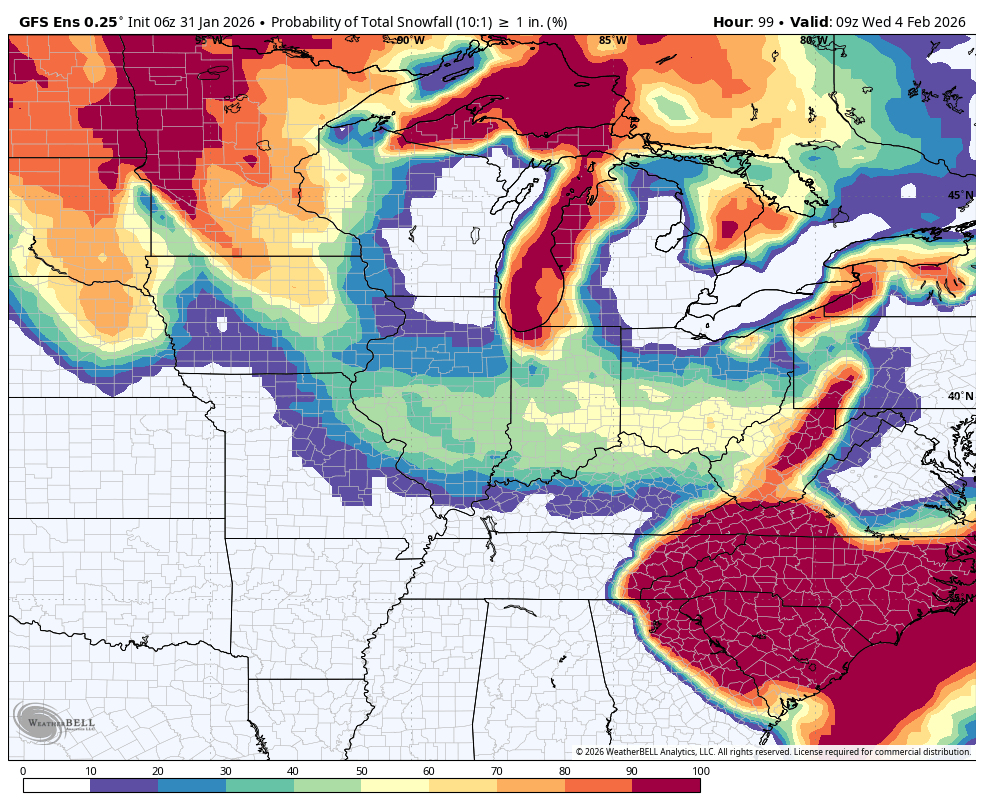
The EC mean for one inch of snow or more