
First off, here are your Beau Dodson Weather Radars

Radars and Lightning Data
Interactive-city-view radars. Clickable watches and warnings.
https://wtalk.co/B3XHASFZ
Old legacy radar site (some of you like it better)
https://weatherobservatory.com/weather-radar.htm
.
Good afternoon,
I am tracking multiple precipitation events from today through next Thursday! Perhaps another one next weekend.
Spotty showers and drizzle are possible today. Possibly mixed with some sleet pellets. No impacts from the sleet. Rain chances ramp up tonight into Saturday evening. Here are the expected rainfall totals.
Nothing extreme in these numbers. Mostly in the 0.10″ to 0.40″ range. A rumble of thunder is possible Saturday, but no severe weather concerns.
A cold front moves through the region Saturday night into Sunday.
This sets the stage for an active weather pattern next week.
Several rounds of precipitation are likely.
If you have travel plans in the region (or northward) then monitor updates over the coming days. Some wintry precipitation is likely!
There are low end chances of rain or a rain/snow mix over our far southern counties Sunday night into Monday. Nothing to write home about. Light totals.
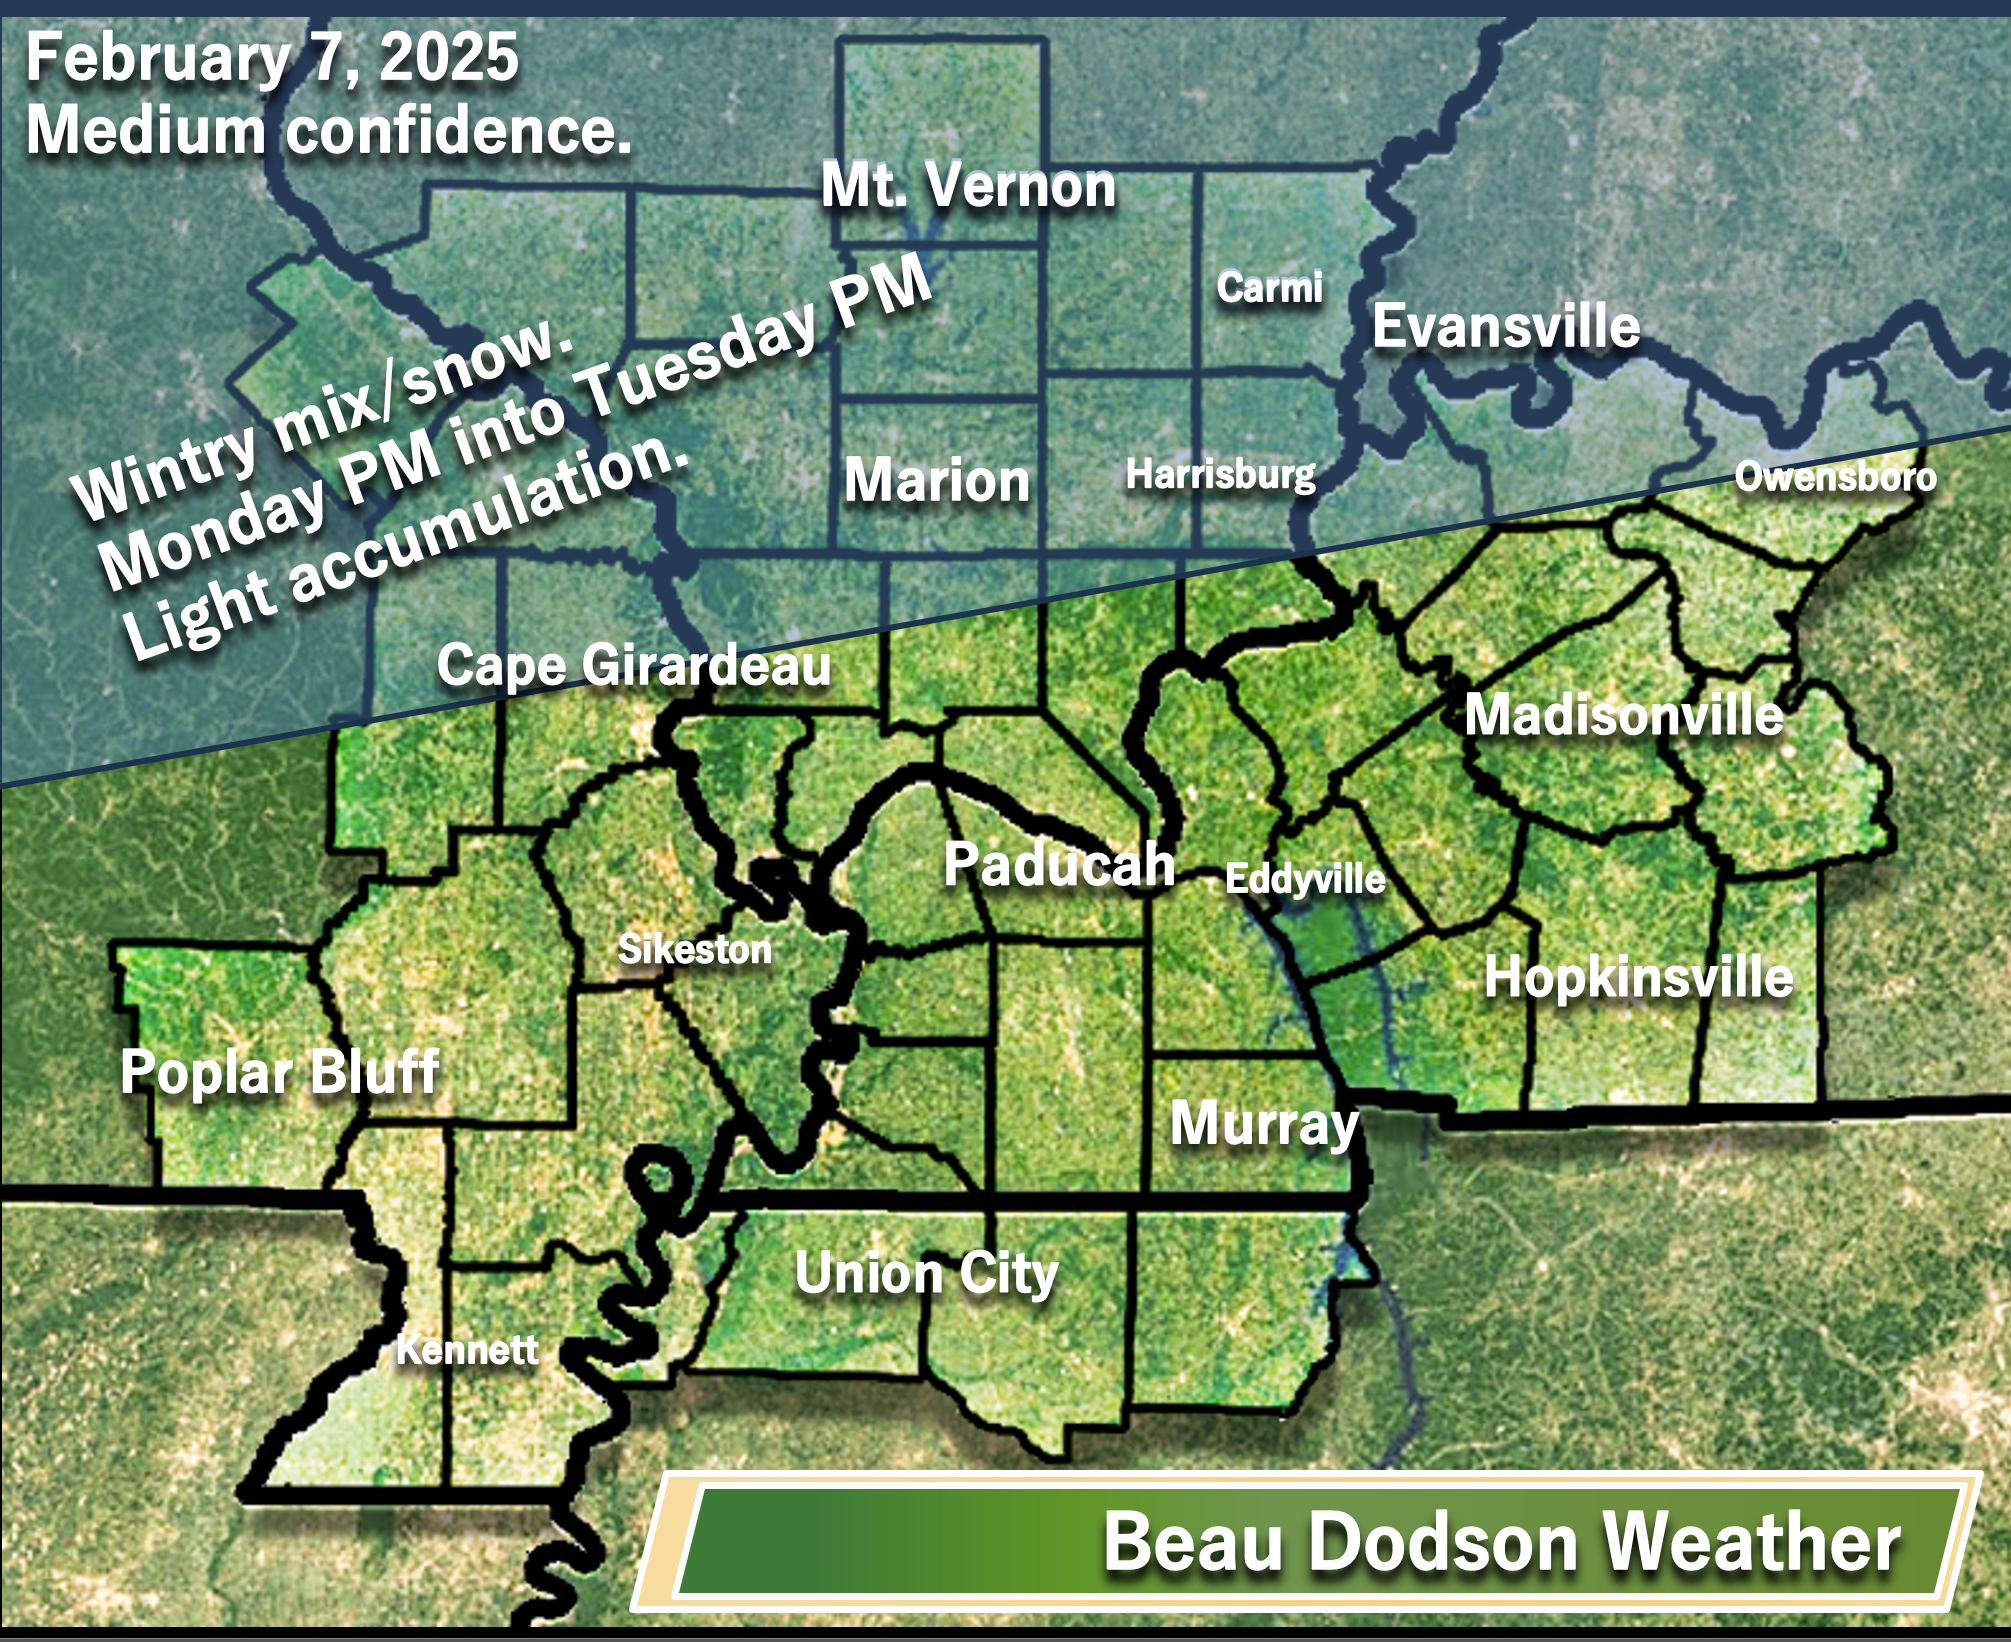
Then, we have increasing chances of precipitation area-wide Monday afternoon into Tuesday night. The biggest question is who ends up with freezing rain, sleet, snow, or just plain old rain! I have a feeling it will be all of the above from north to south. Remember, I forecast from Mt Vernon, Illinois south to northwest Tennessee.
The first system is still four days away! That is a long time when it comes to forecasting the placement of the wintry mix vs plain old rain line.
For now, this is my thinking.
Our northern and northwestern counties have the highest probability of receiving freezing rain, sleet, and snow Monday PM into Tuesday PM. Some light accumulation possible.
Areas to the south will just need to monitor future forecasts.
Could this change? Absolutely. Adjustments are almost certain. Don’t walk away with one forecast and think that will be it.
Then, we have a brief lull late Tuesday night into Wednesday morning.
Another system quickly moves in Wednesday afternoon into Thursday.
A lot of questions surround the strength of the second system.
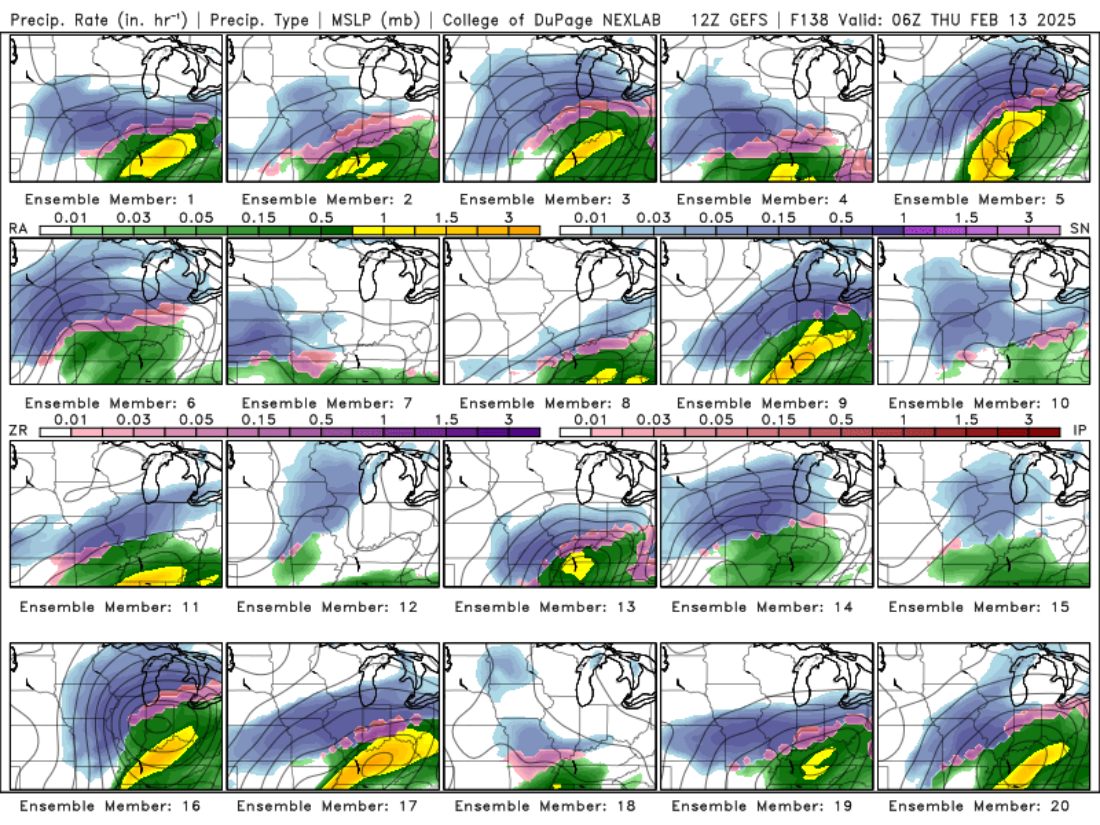
Here is the latest GEFS ensemble models. One more of many.
Each square represents one run of the model. The general idea is that we look for agreement in the data/squares.
The more squares that agree, the higher the probability that will be the outcome.
Guess what? Our region is in the battle zone between snow and rain. Shocker. Seems like 90% of the time that is the case.
Some of you could receive moderate rain and some could receive a few inches of frozen precipitation.
Blue is snow. Pink is ice. Green and yellow/orange represent rain.
A nail biter for some counties. Again, this is just one model. We don’t make our final forecast based on one model.
It is just too soon to know the track of this system. The second event is still in the day six to seven range. Typically, an accurate snow forecast isn’t made until the last 48 hours. We have a long way to go!
 \
\Let me show you a few more graphics. Not to overwhelm you, but just wanting to show you the data.
This is why meteorologists pull their hair out when it comes to winter storm forecasting.
It is difficult 24 to 48 hours in advance to forecast snow and ice, let alone days in advance!
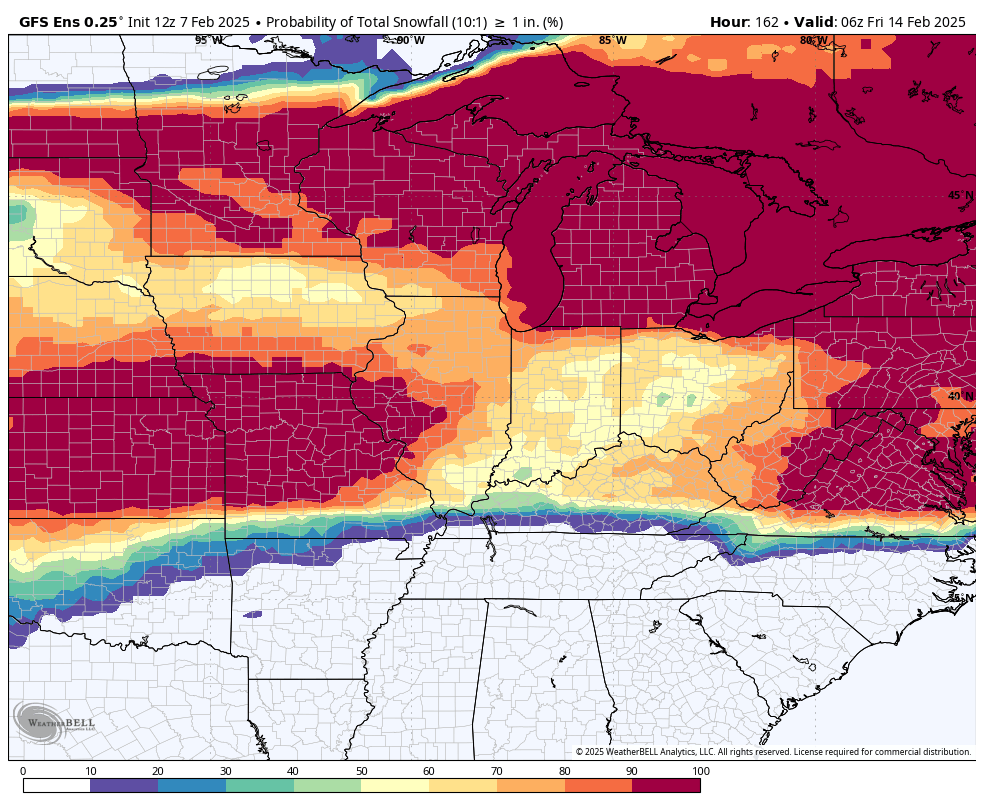
What is the chance of 1″ or more of snow from Monday to Friday of next week.
This is the GEFS ensembles. Obviously, this favors our central and northern counties.
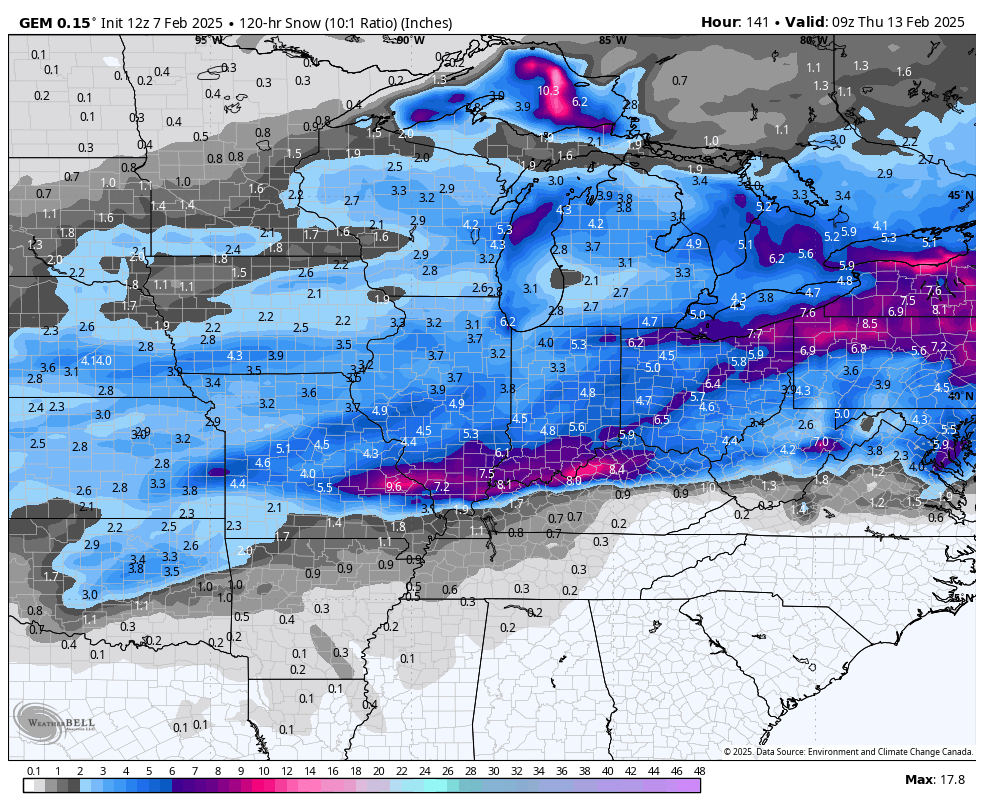
The Canadian model (shown below) is a bit colder.
Here is what it is showing for snow totals Monday and Tuesday.
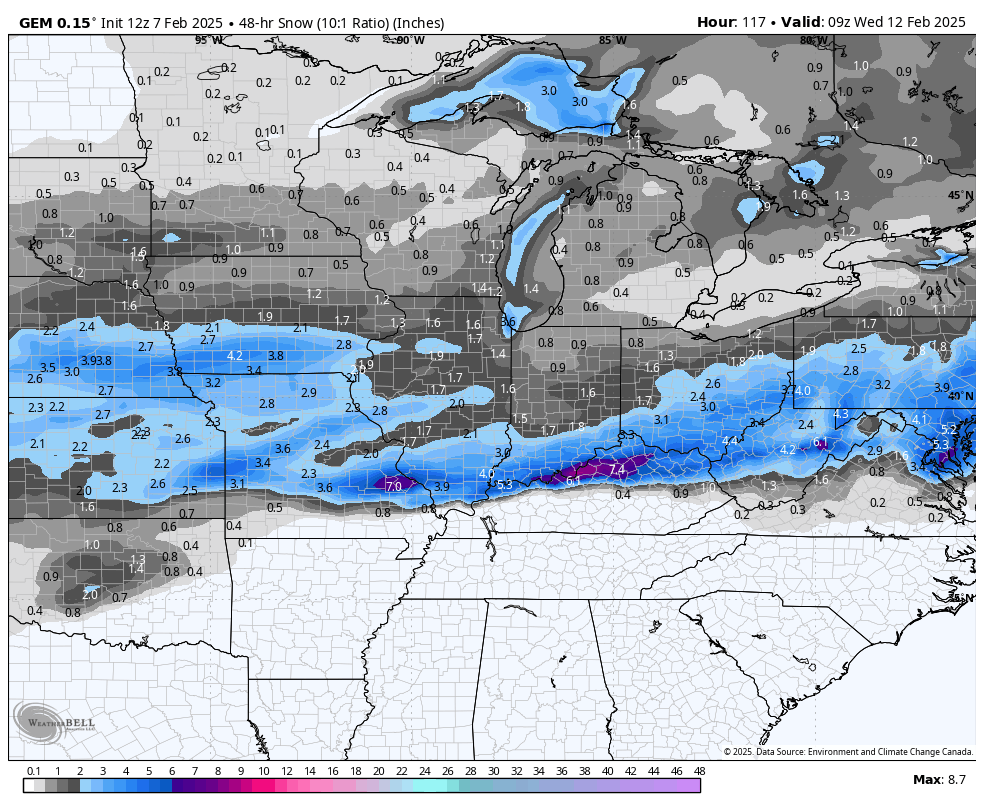
Here is what it shows for both systems (Monday through Thursday). The Canadian model is a bit colder. Thus, higher snow totals.
We shall see. The battle of the models is underway.
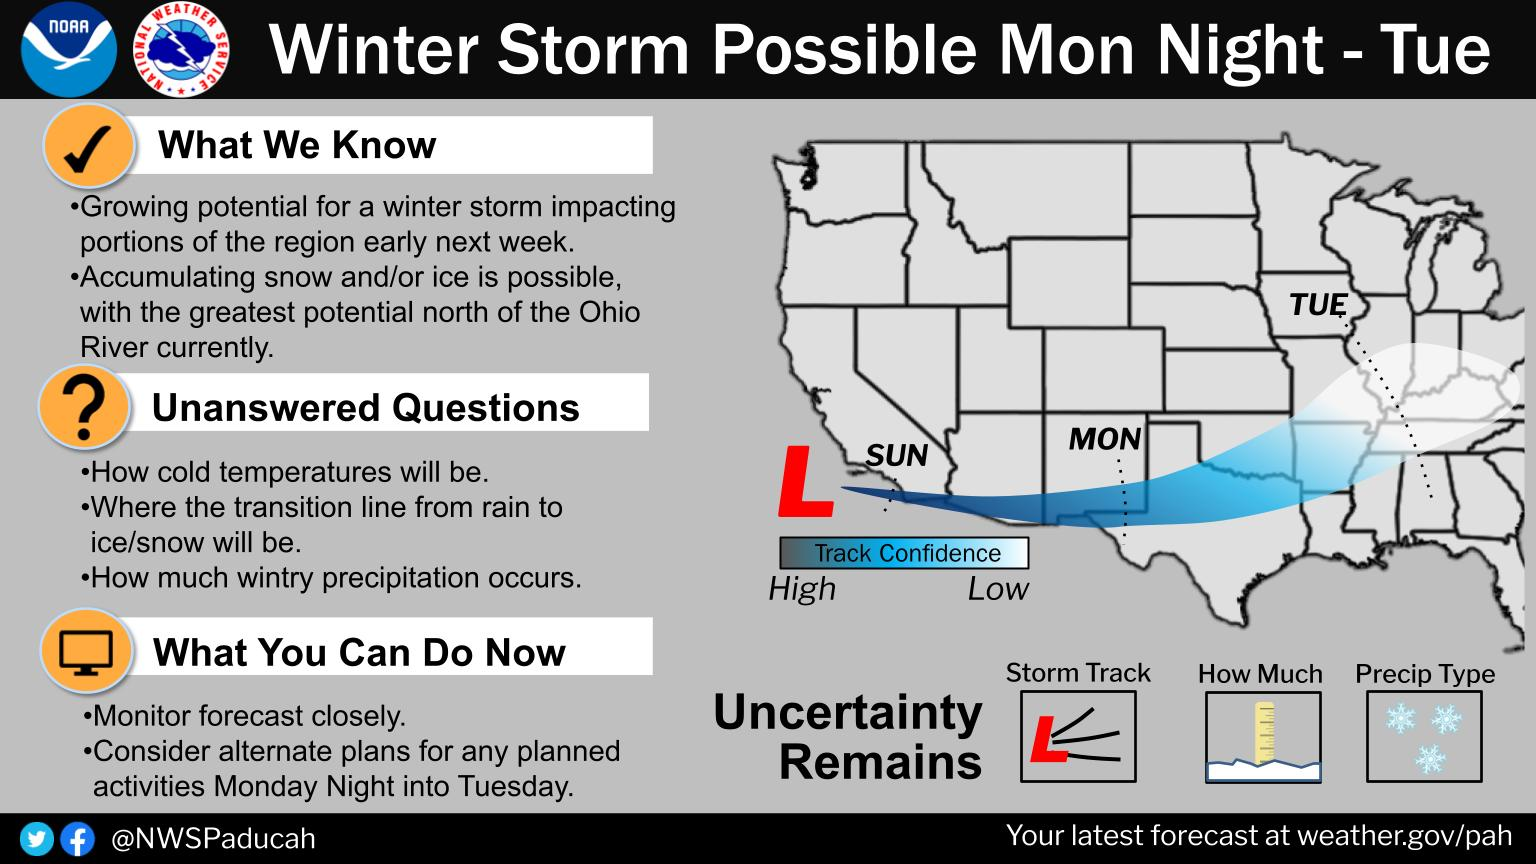
Here are two graphics that the NWS posted on social media.
This first one is from the Paducah, Kentucky, National Weather Service/NOAA
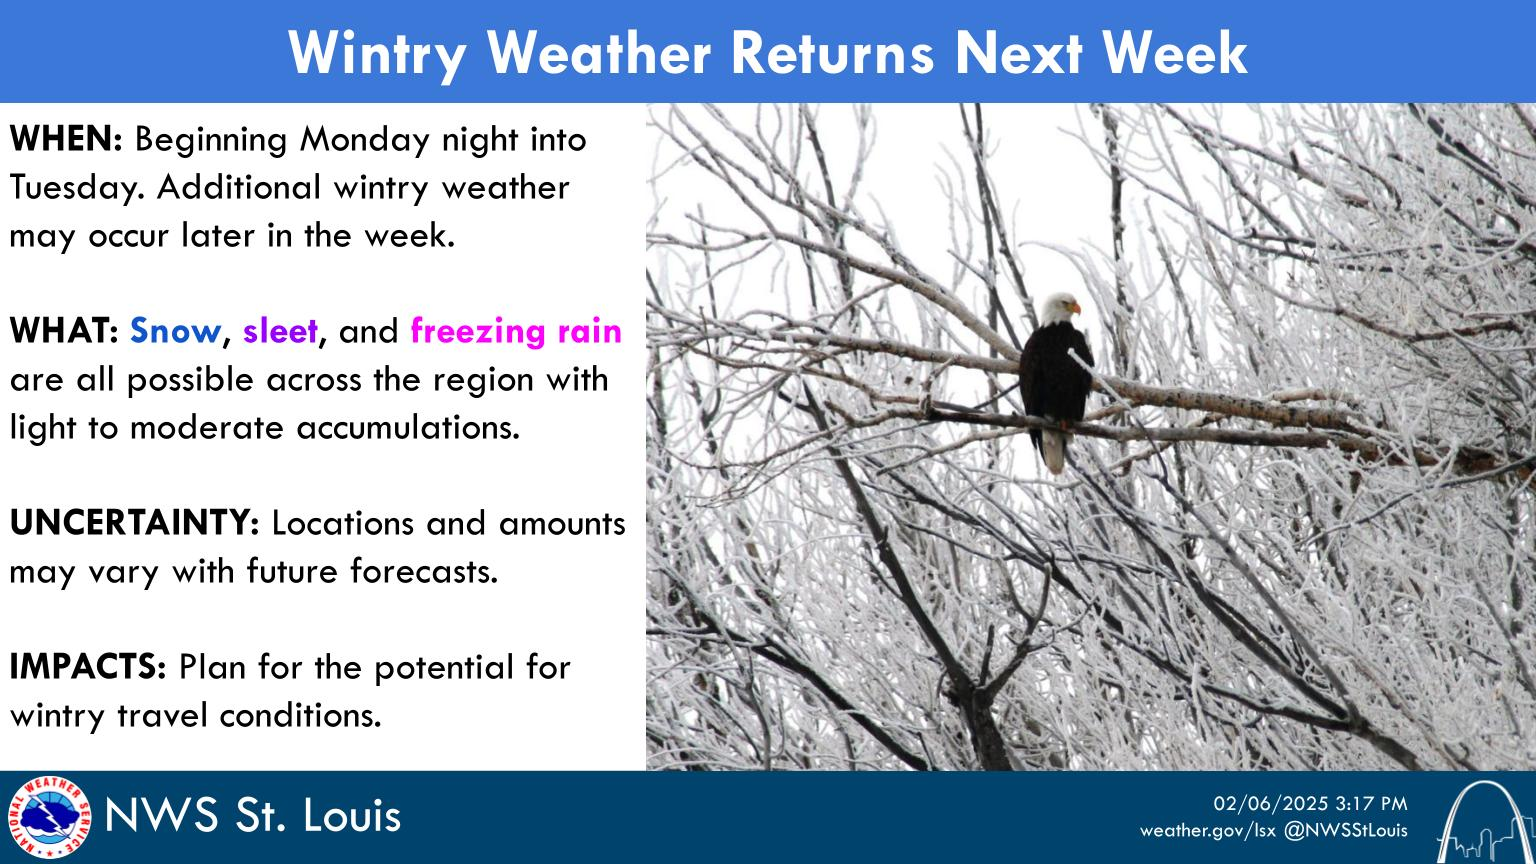
Here is what the St Louis, Missouri, National Weather Service/NOAA posted
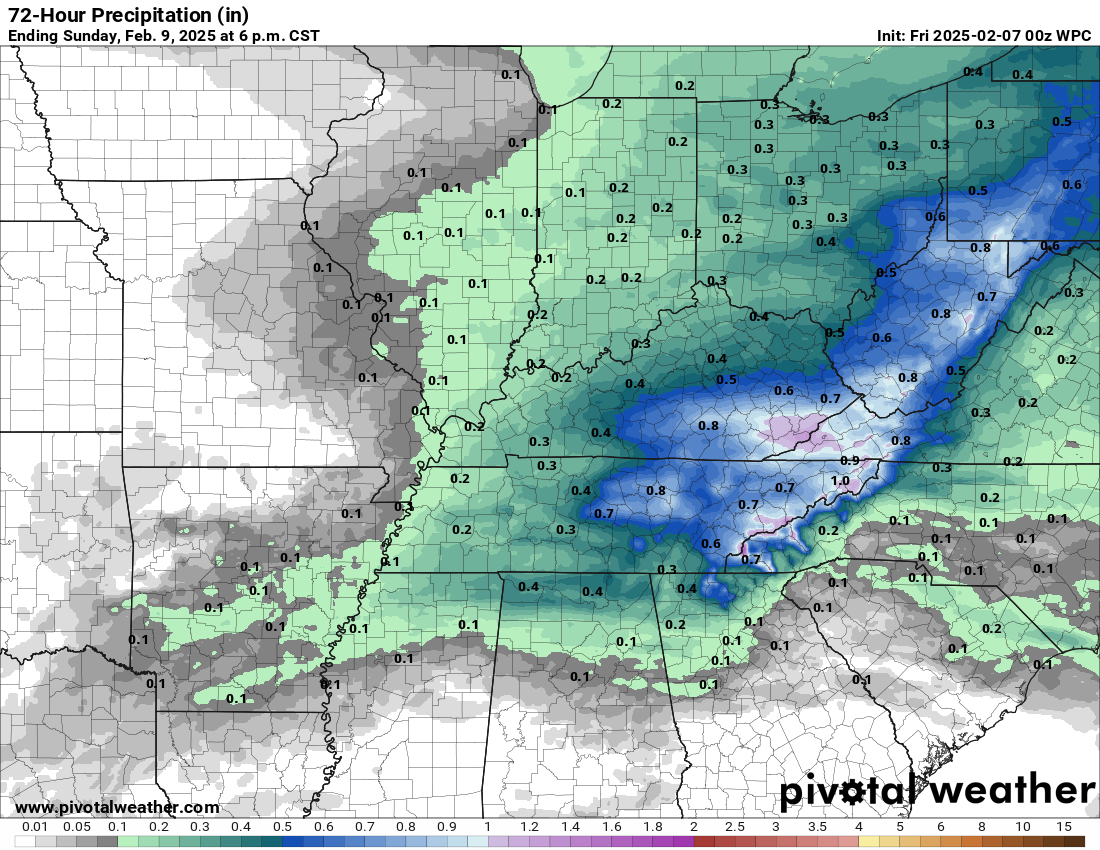
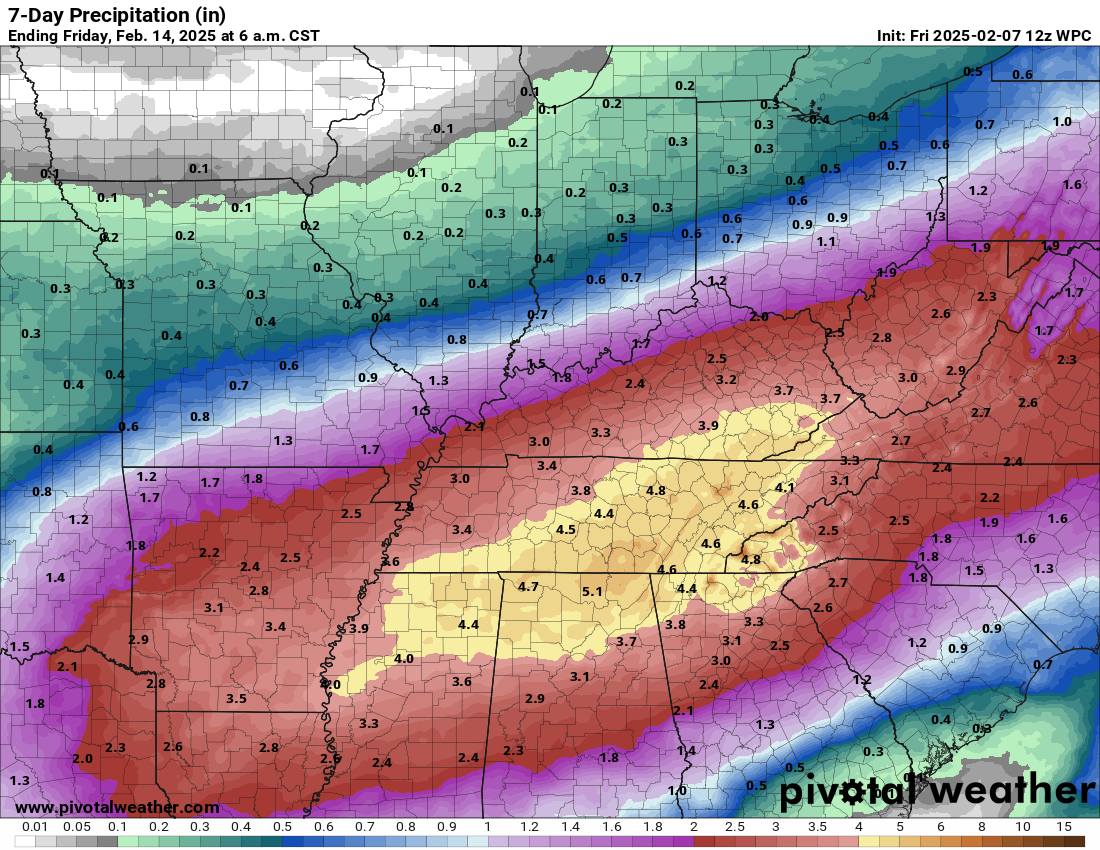
Let’s look at the seven day precipitation totals. This is liquid (including melted snow and ice).
Wet pattern! Double click on images to enlarge them.
I will know more with each passing day. Monitor updates.
We have a few sponsors that are helping cover new technology costs! Check them out.
Heating problems?
One Hour Heating and Air – Click Here

Connected and Protected.
They Specialize in Audio, Video, Networking, Security, Cameras, Electrical, New Construction, Remodels, and retrofitting Jobs. Experience the future of smart living and unmatched security with Connected & Protected Solutions today.
Link – Click here

Roof damage from recent storms? Link – Click here

![]()
![]()

.
Click here if you would like to return to the top of the page.
.Average high temperatures for this time of the year are around 46 degrees.
Average low temperatures for this time of the year are around 29 degrees.
Average precipitation during this time period ranges from 0.90″ to 1.20″
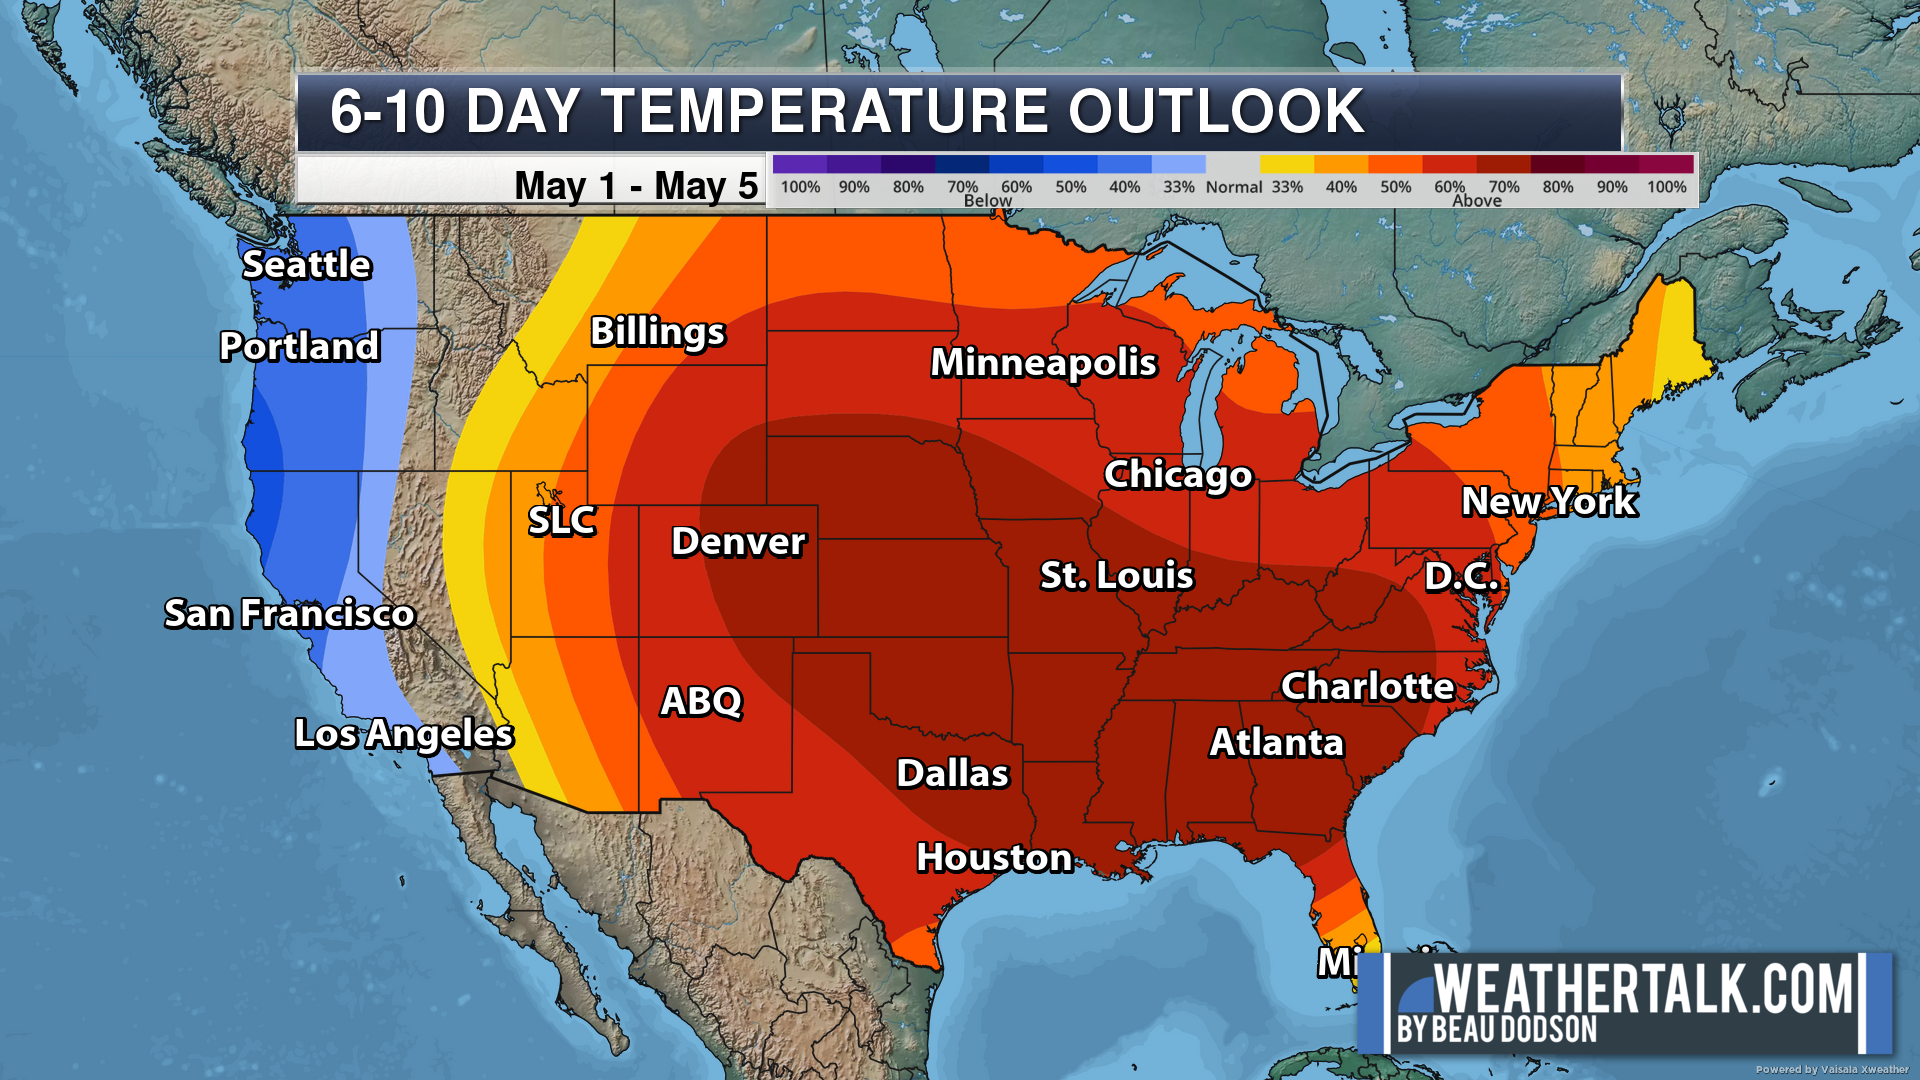
Six to Ten Day Outlook.
Blue is below average. Red is above average. The no color zone represents equal chances.
Average highs for this time of the year are in the lower 60s. Average lows for this time of the year are in the lower 40s.
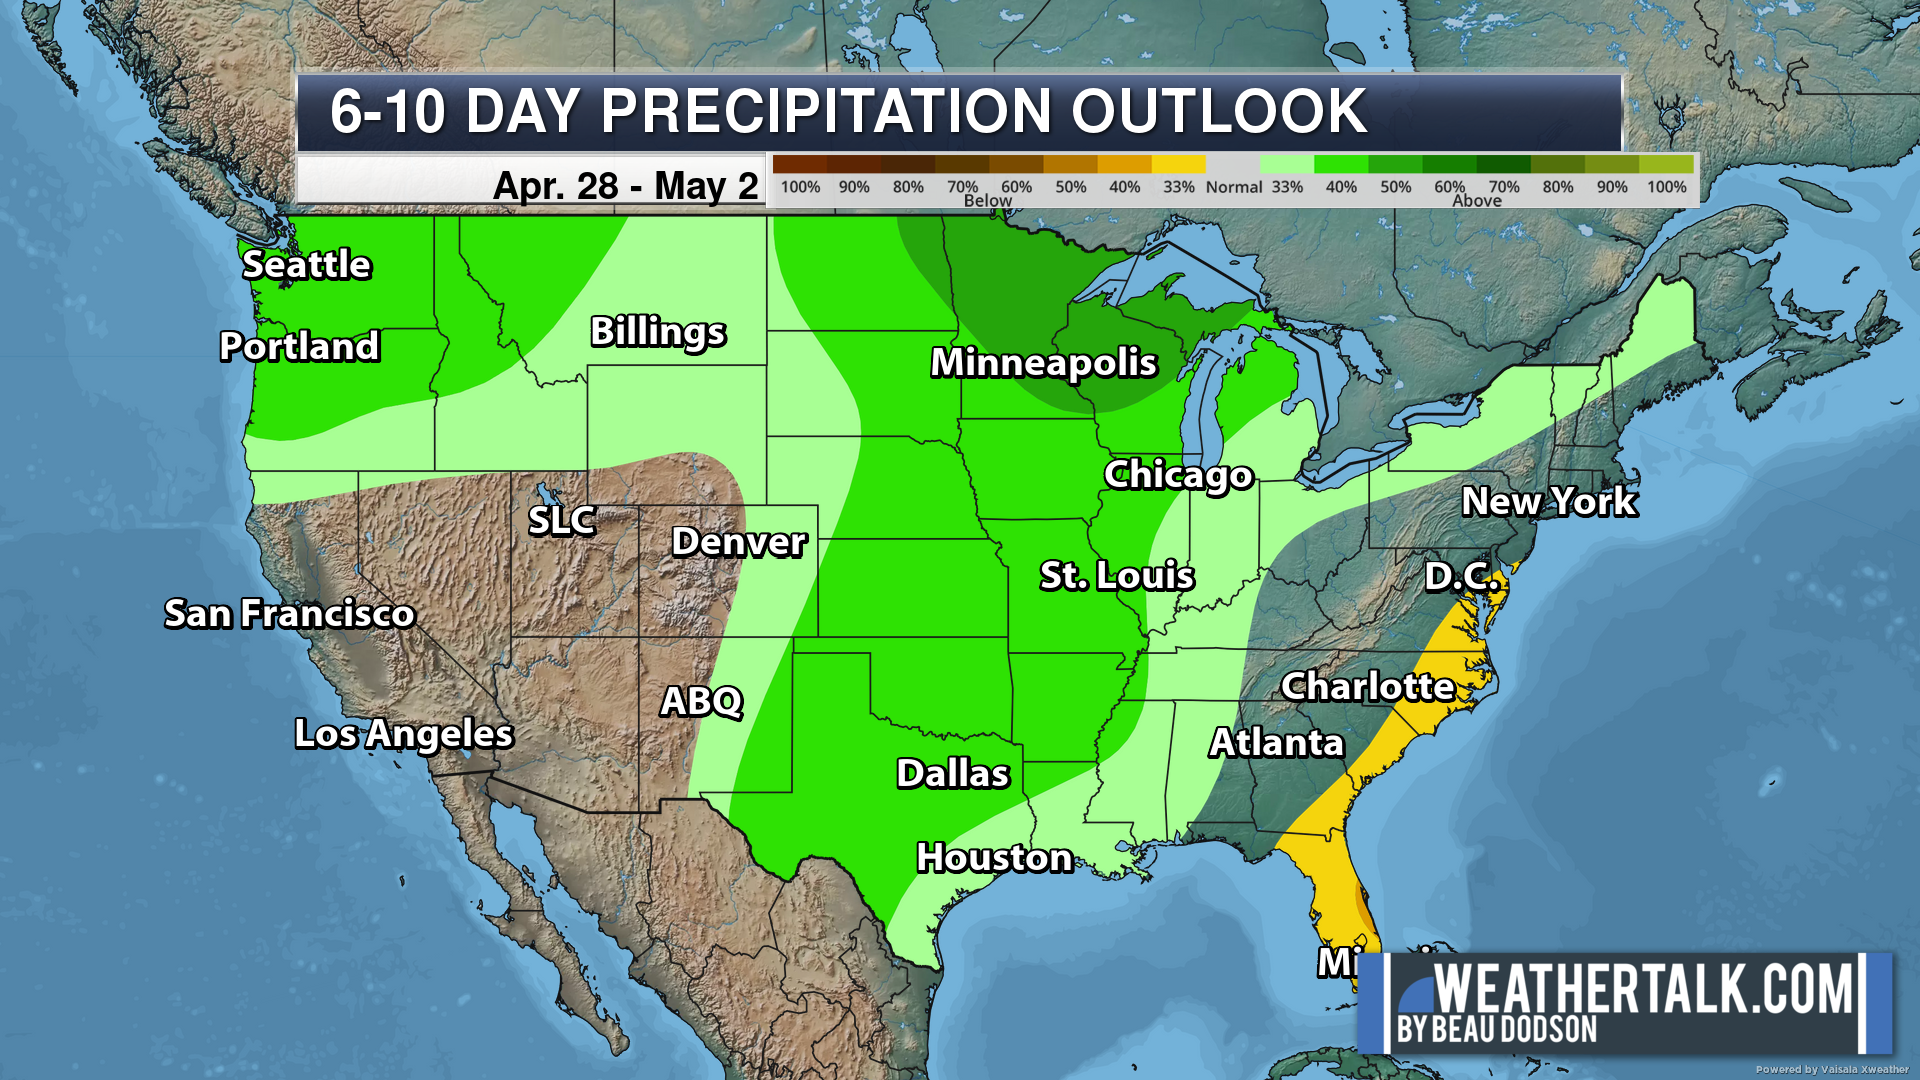
Green is above average precipitation. Yellow and brown favors below average precipitation. Average precipitation for this time of the year is around one inch per week.
.

Average low temperatures for this time of the year are around 29 degrees.
Average precipitation during this time period ranges from 0.90″ to 1.20″
.
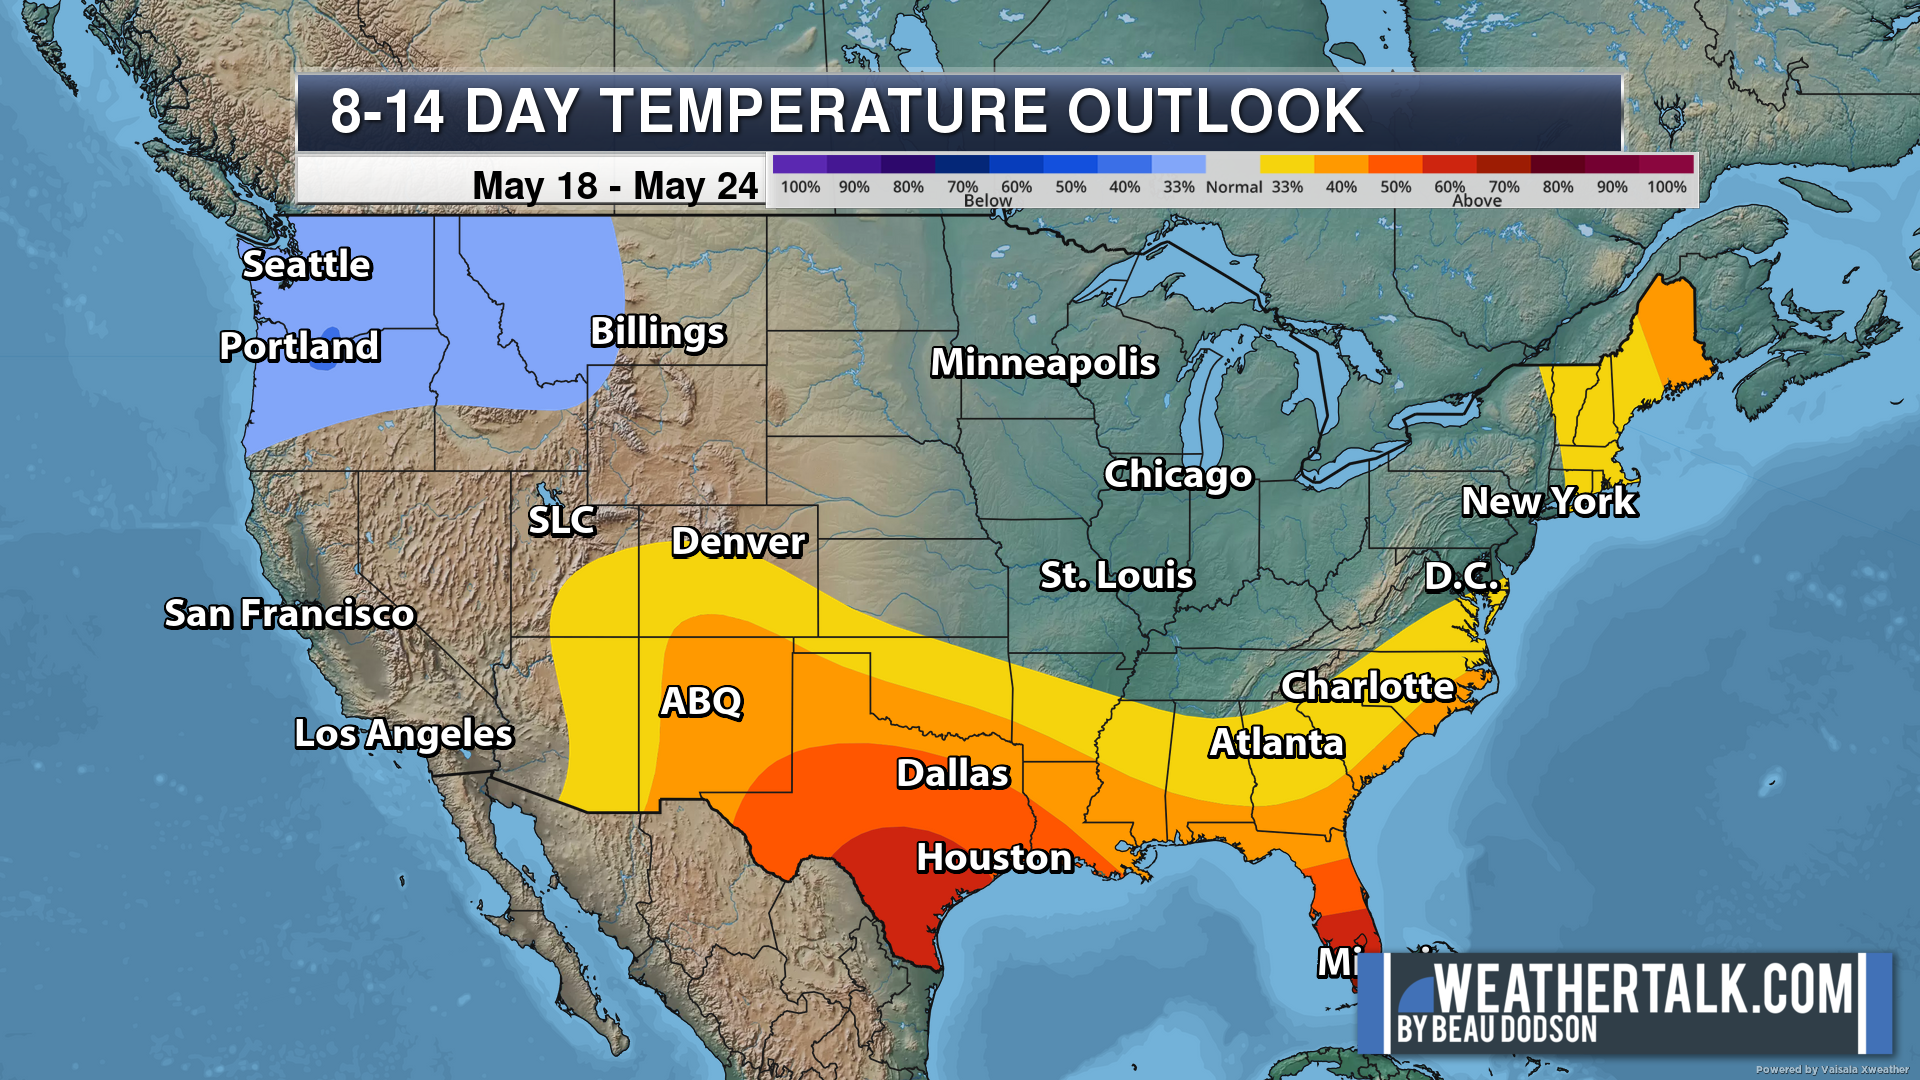
Eight to Fourteen Day Outlook.
Blue is below average. Red is above average. The no color zone represents equal chances.
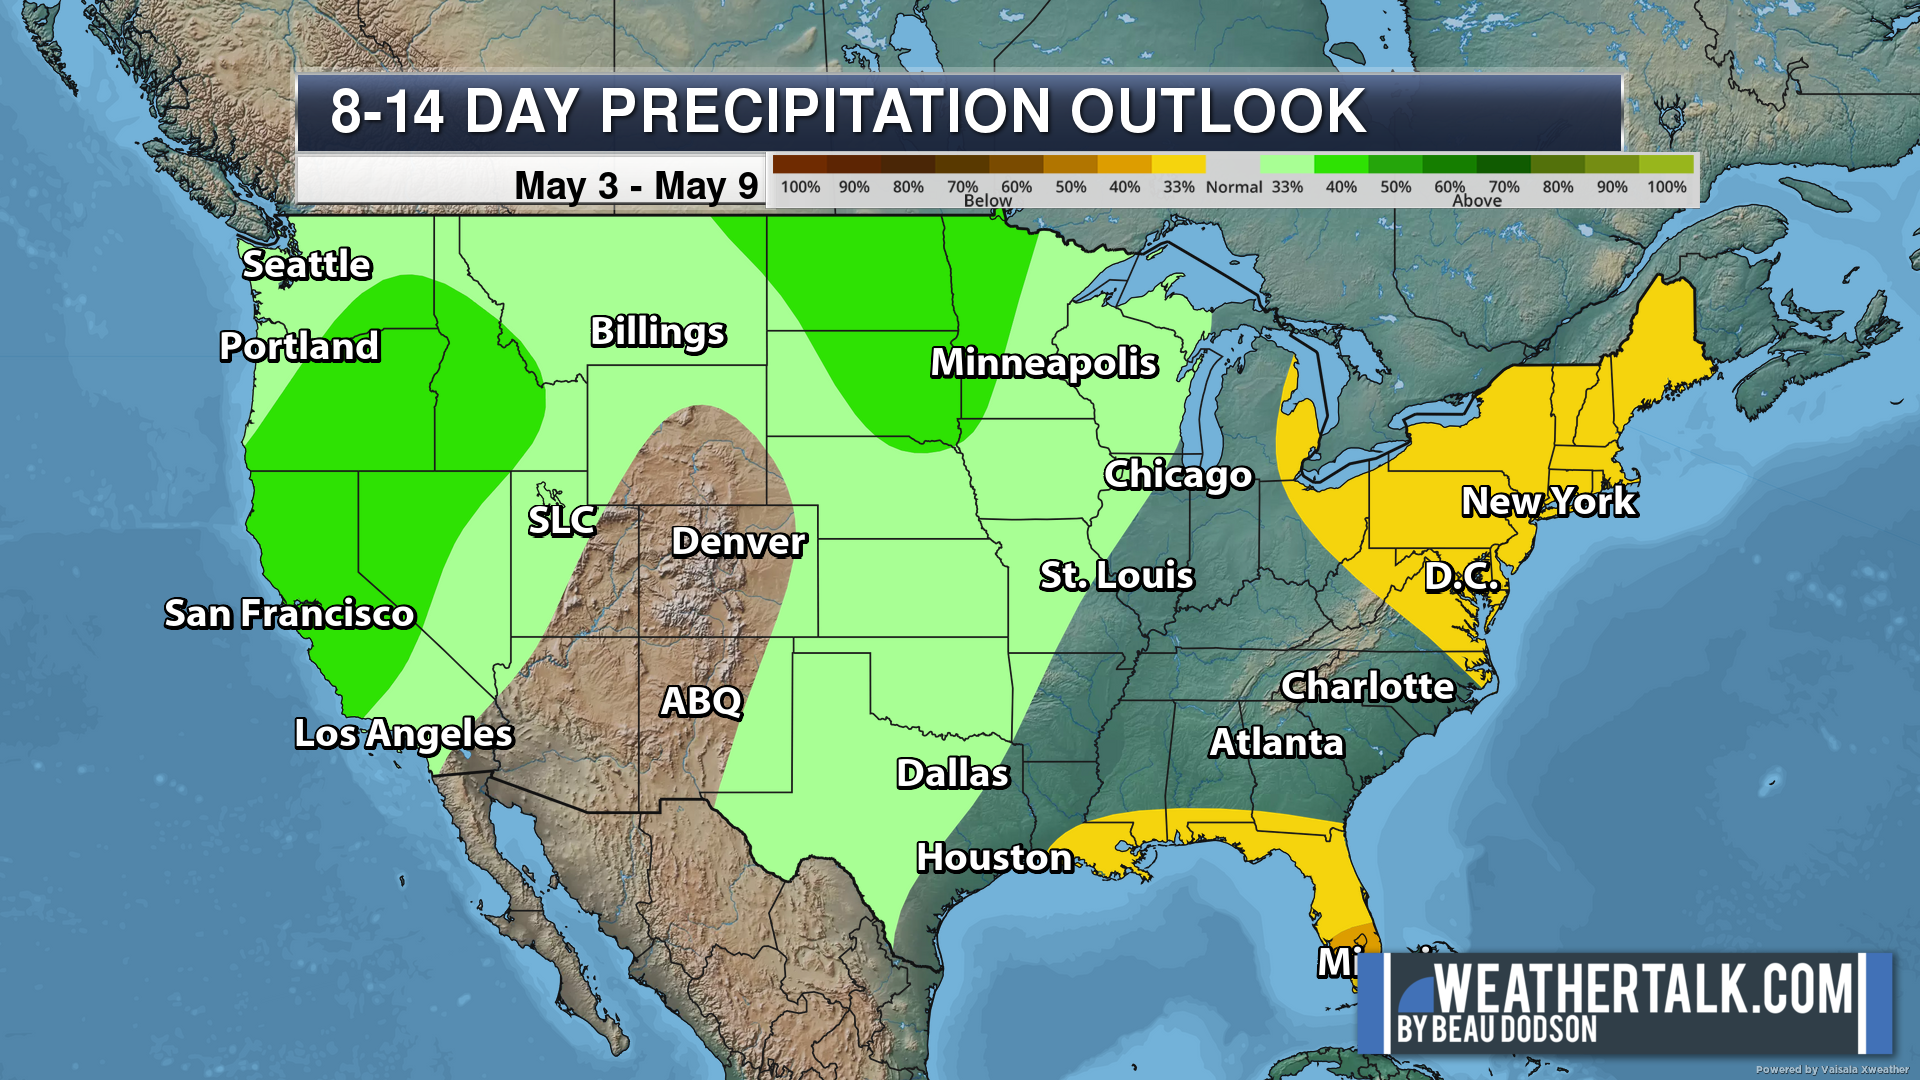
Green is above average precipitation. Yellow and brown favors below average precipitation. Average precipitation for this time of the year is around one inch per week.
.
![]()
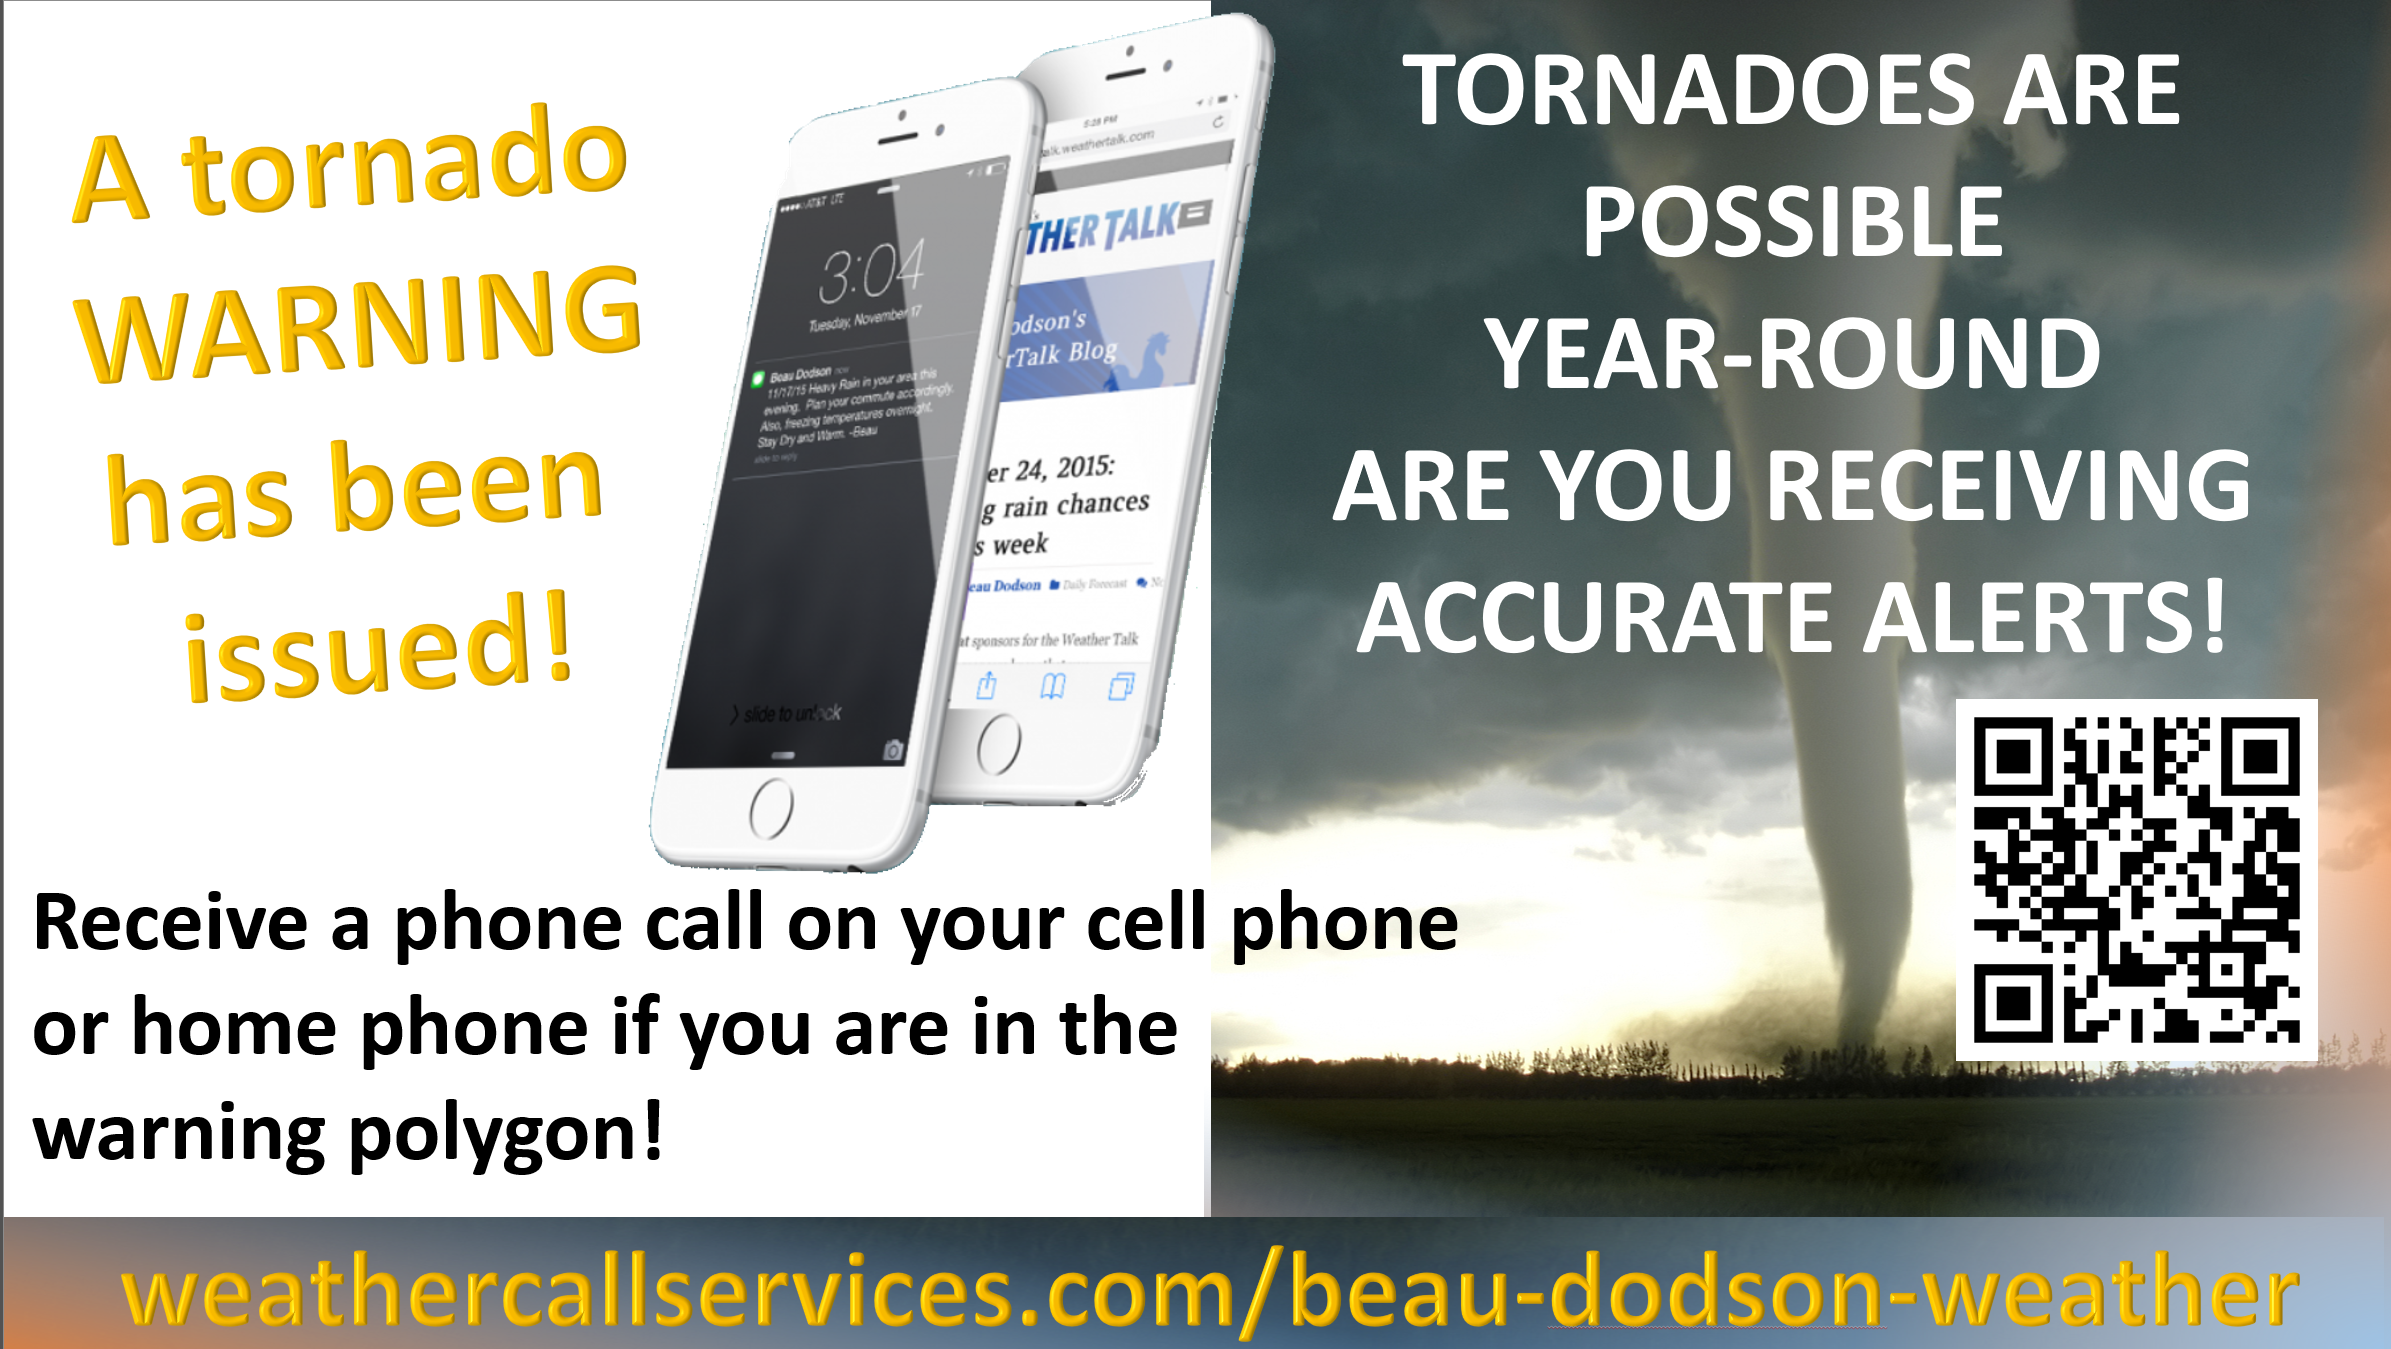
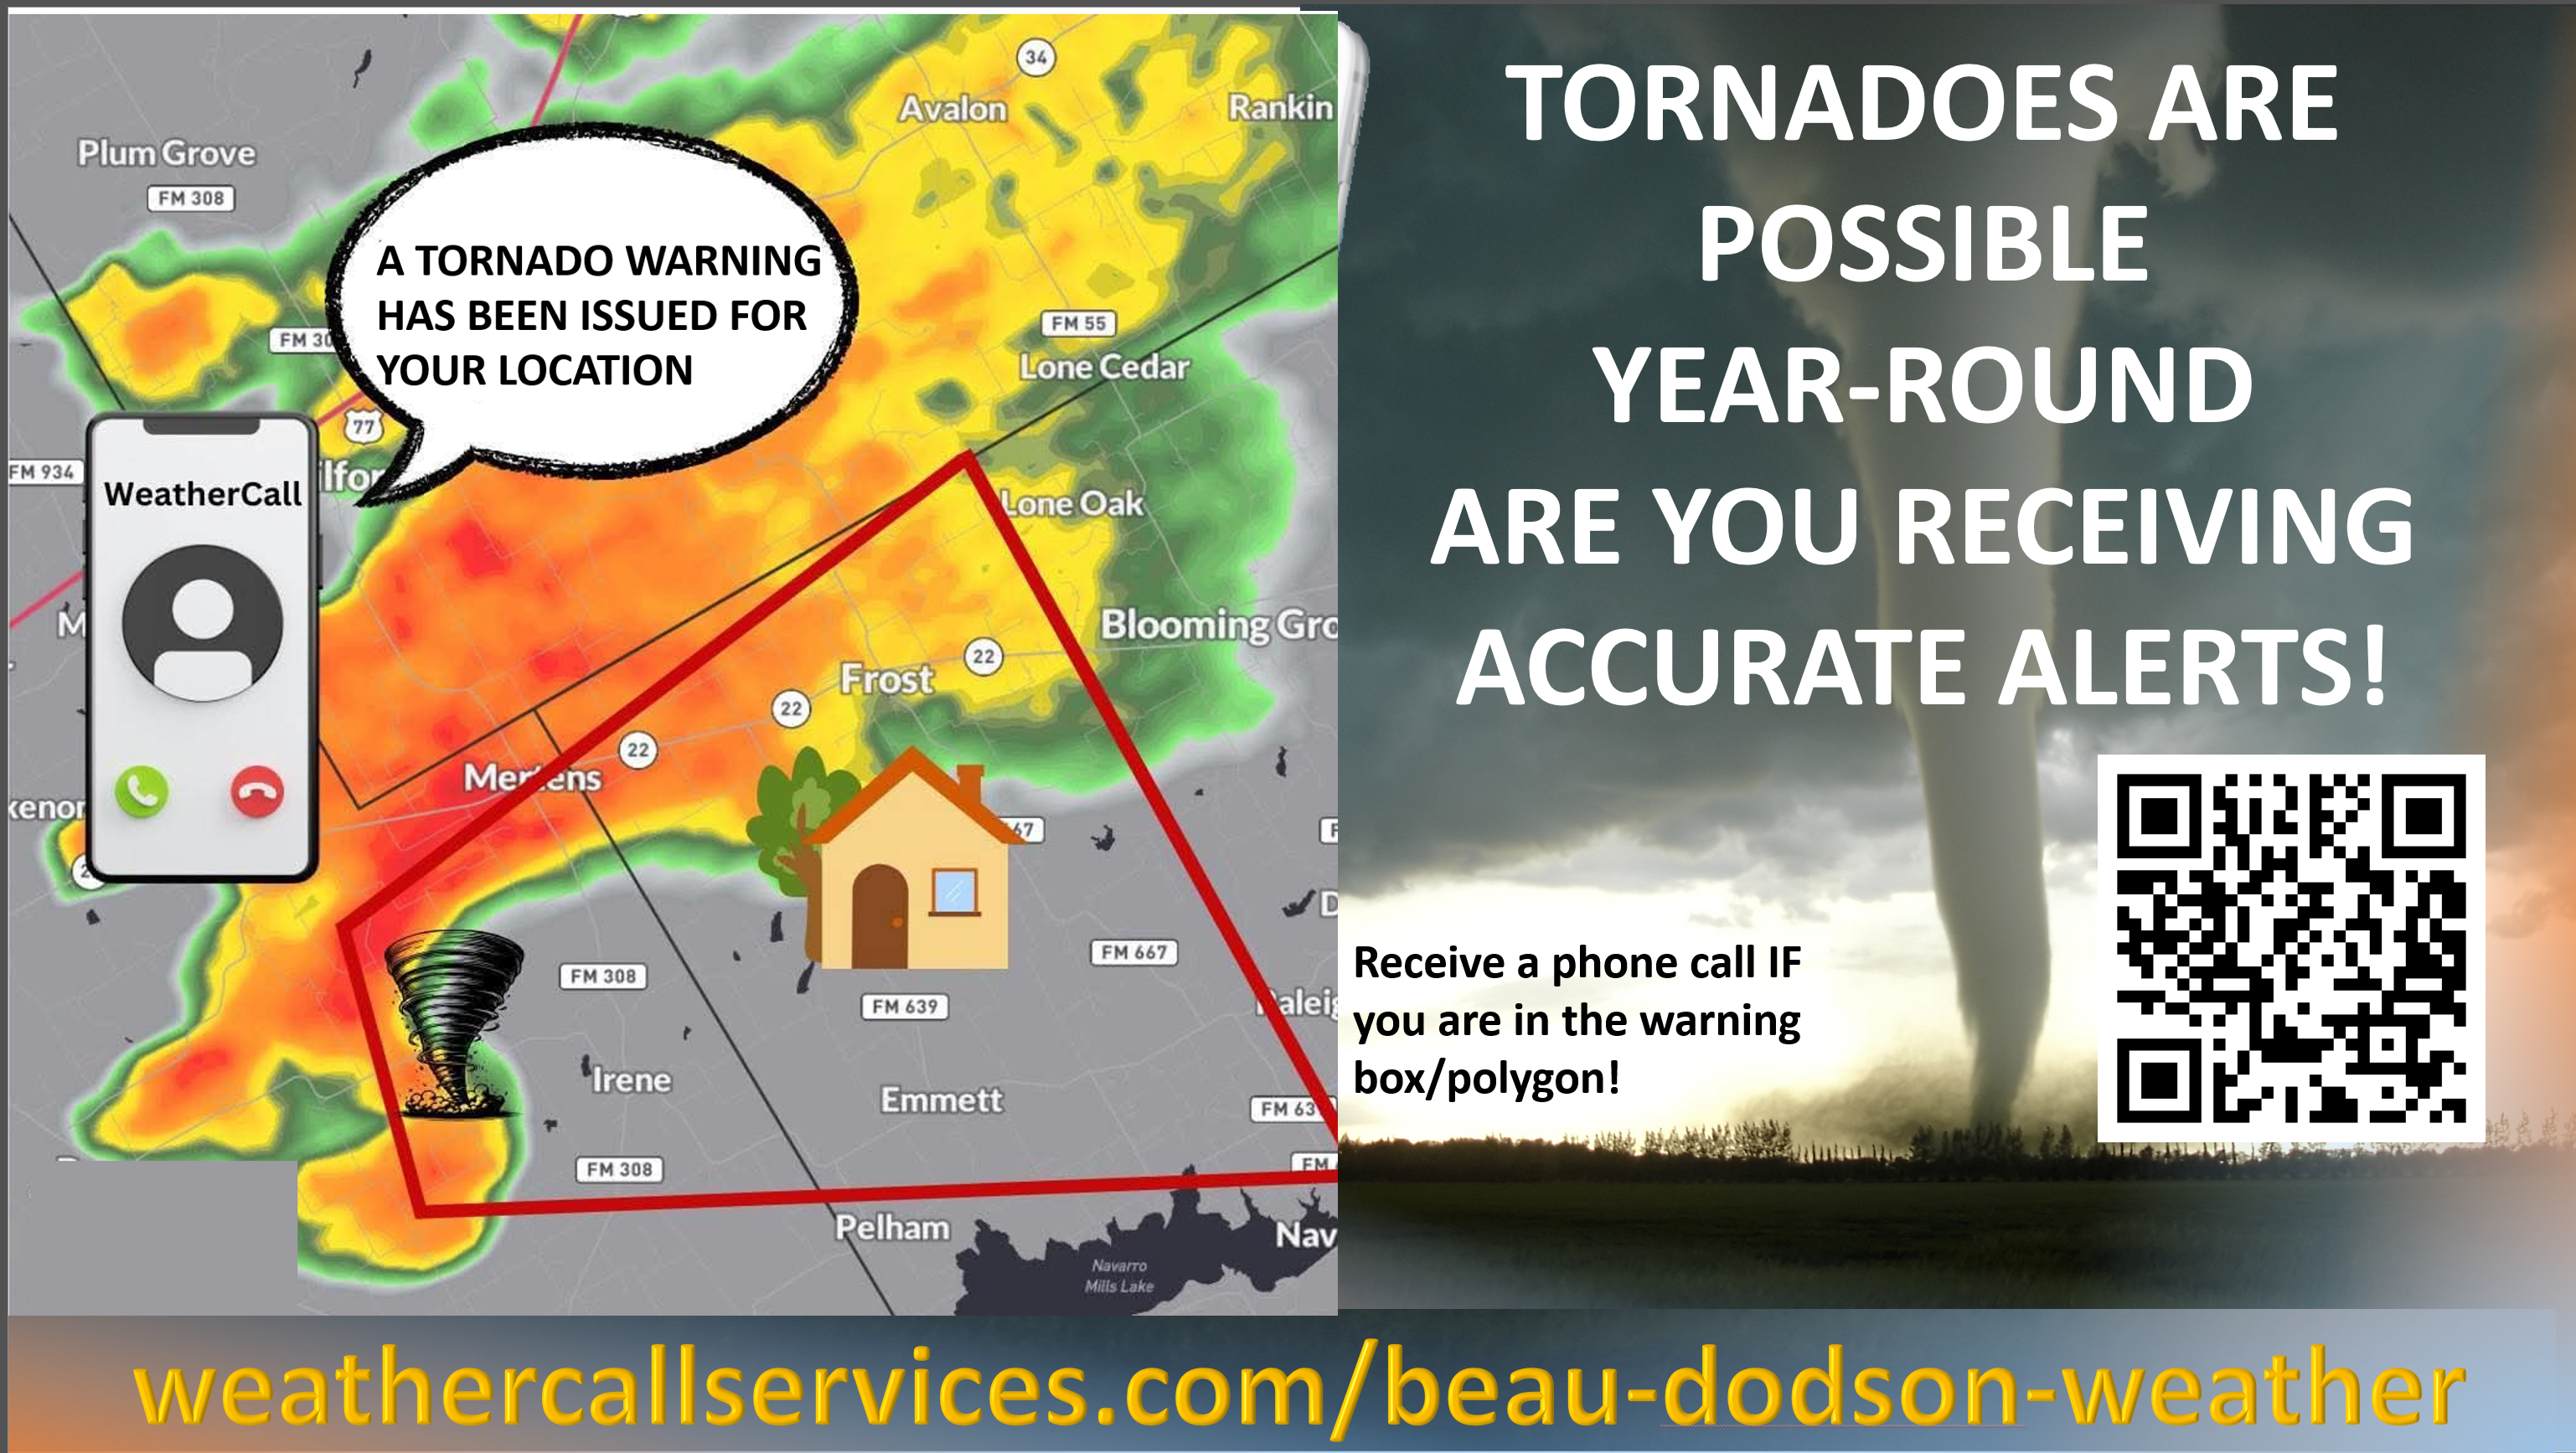
Make sure you have three to five ways of receiving your severe weather information.
Weather Talk is one of those ways! Now, I have another product for you and your family.

.
.
https://weathercallservices.com/beau-dodson-weather
Want to add more products to your Beau Dodson Weather App?
Receive daily videos, weather blog updates on normal weather days and severe weather and winter storm days, your county by county weather forecast, and more!
Here is how to do add those additional products to your app notification settings!
Here is a video on how to update your Beau Dodson Weather payment.
The app is for subscribers. Subscribe at www.weathertalk.com/welcome then go to your app store and search for WeatherTalk
Subscribers, PLEASE USE THE APP. ATT and Verizon are not reliable during severe weather. They are delaying text messages.
The app is under WeatherTalk in the app store.

Apple users click here

Android users click here
.
Radars and Lightning Data
Interactive-city-view radars. Clickable watches and warnings.
https://wtalk.co/B3XHASFZ
Old legacy radar site (some of you like it better)
https://weatherobservatory.com/weather-radar.htm
If the radar is not updating then try another one. If a radar does not appear to be refreshing then hit Ctrl F5. You may also try restarting your browser.
Backup radar site in case the above one is not working.
https://weathertalk.com/morani
Regional Radar
https://imagery.weathertalk.com/prx/RadarLoop.mp4
** NEW ** Zoom radar with chaser tracking abilities!
ZoomRadar
Lightning Data (zoom in and out of your local area)
https://wtalk.co/WJ3SN5UZ
Not working? Email me at beaudodson@usawx.com
National map of weather watches and warnings. Click here.
Storm Prediction Center. Click here.
Weather Prediction Center. Click here.
.

Live lightning data: Click here.
Real time lightning data (another one) https://map.blitzortung.org/#5.02/37.95/-86.99
Our new Zoom radar with storm chases
.
.
Interactive GOES R satellite. Track clouds. Click here.
GOES 16 slider tool. Click here.
College of DuPage satellites. Click here
.

Here are the latest local river stage forecast numbers Click Here.
Here are the latest lake stage forecast numbers for Kentucky Lake and Lake Barkley Click Here.
.
.
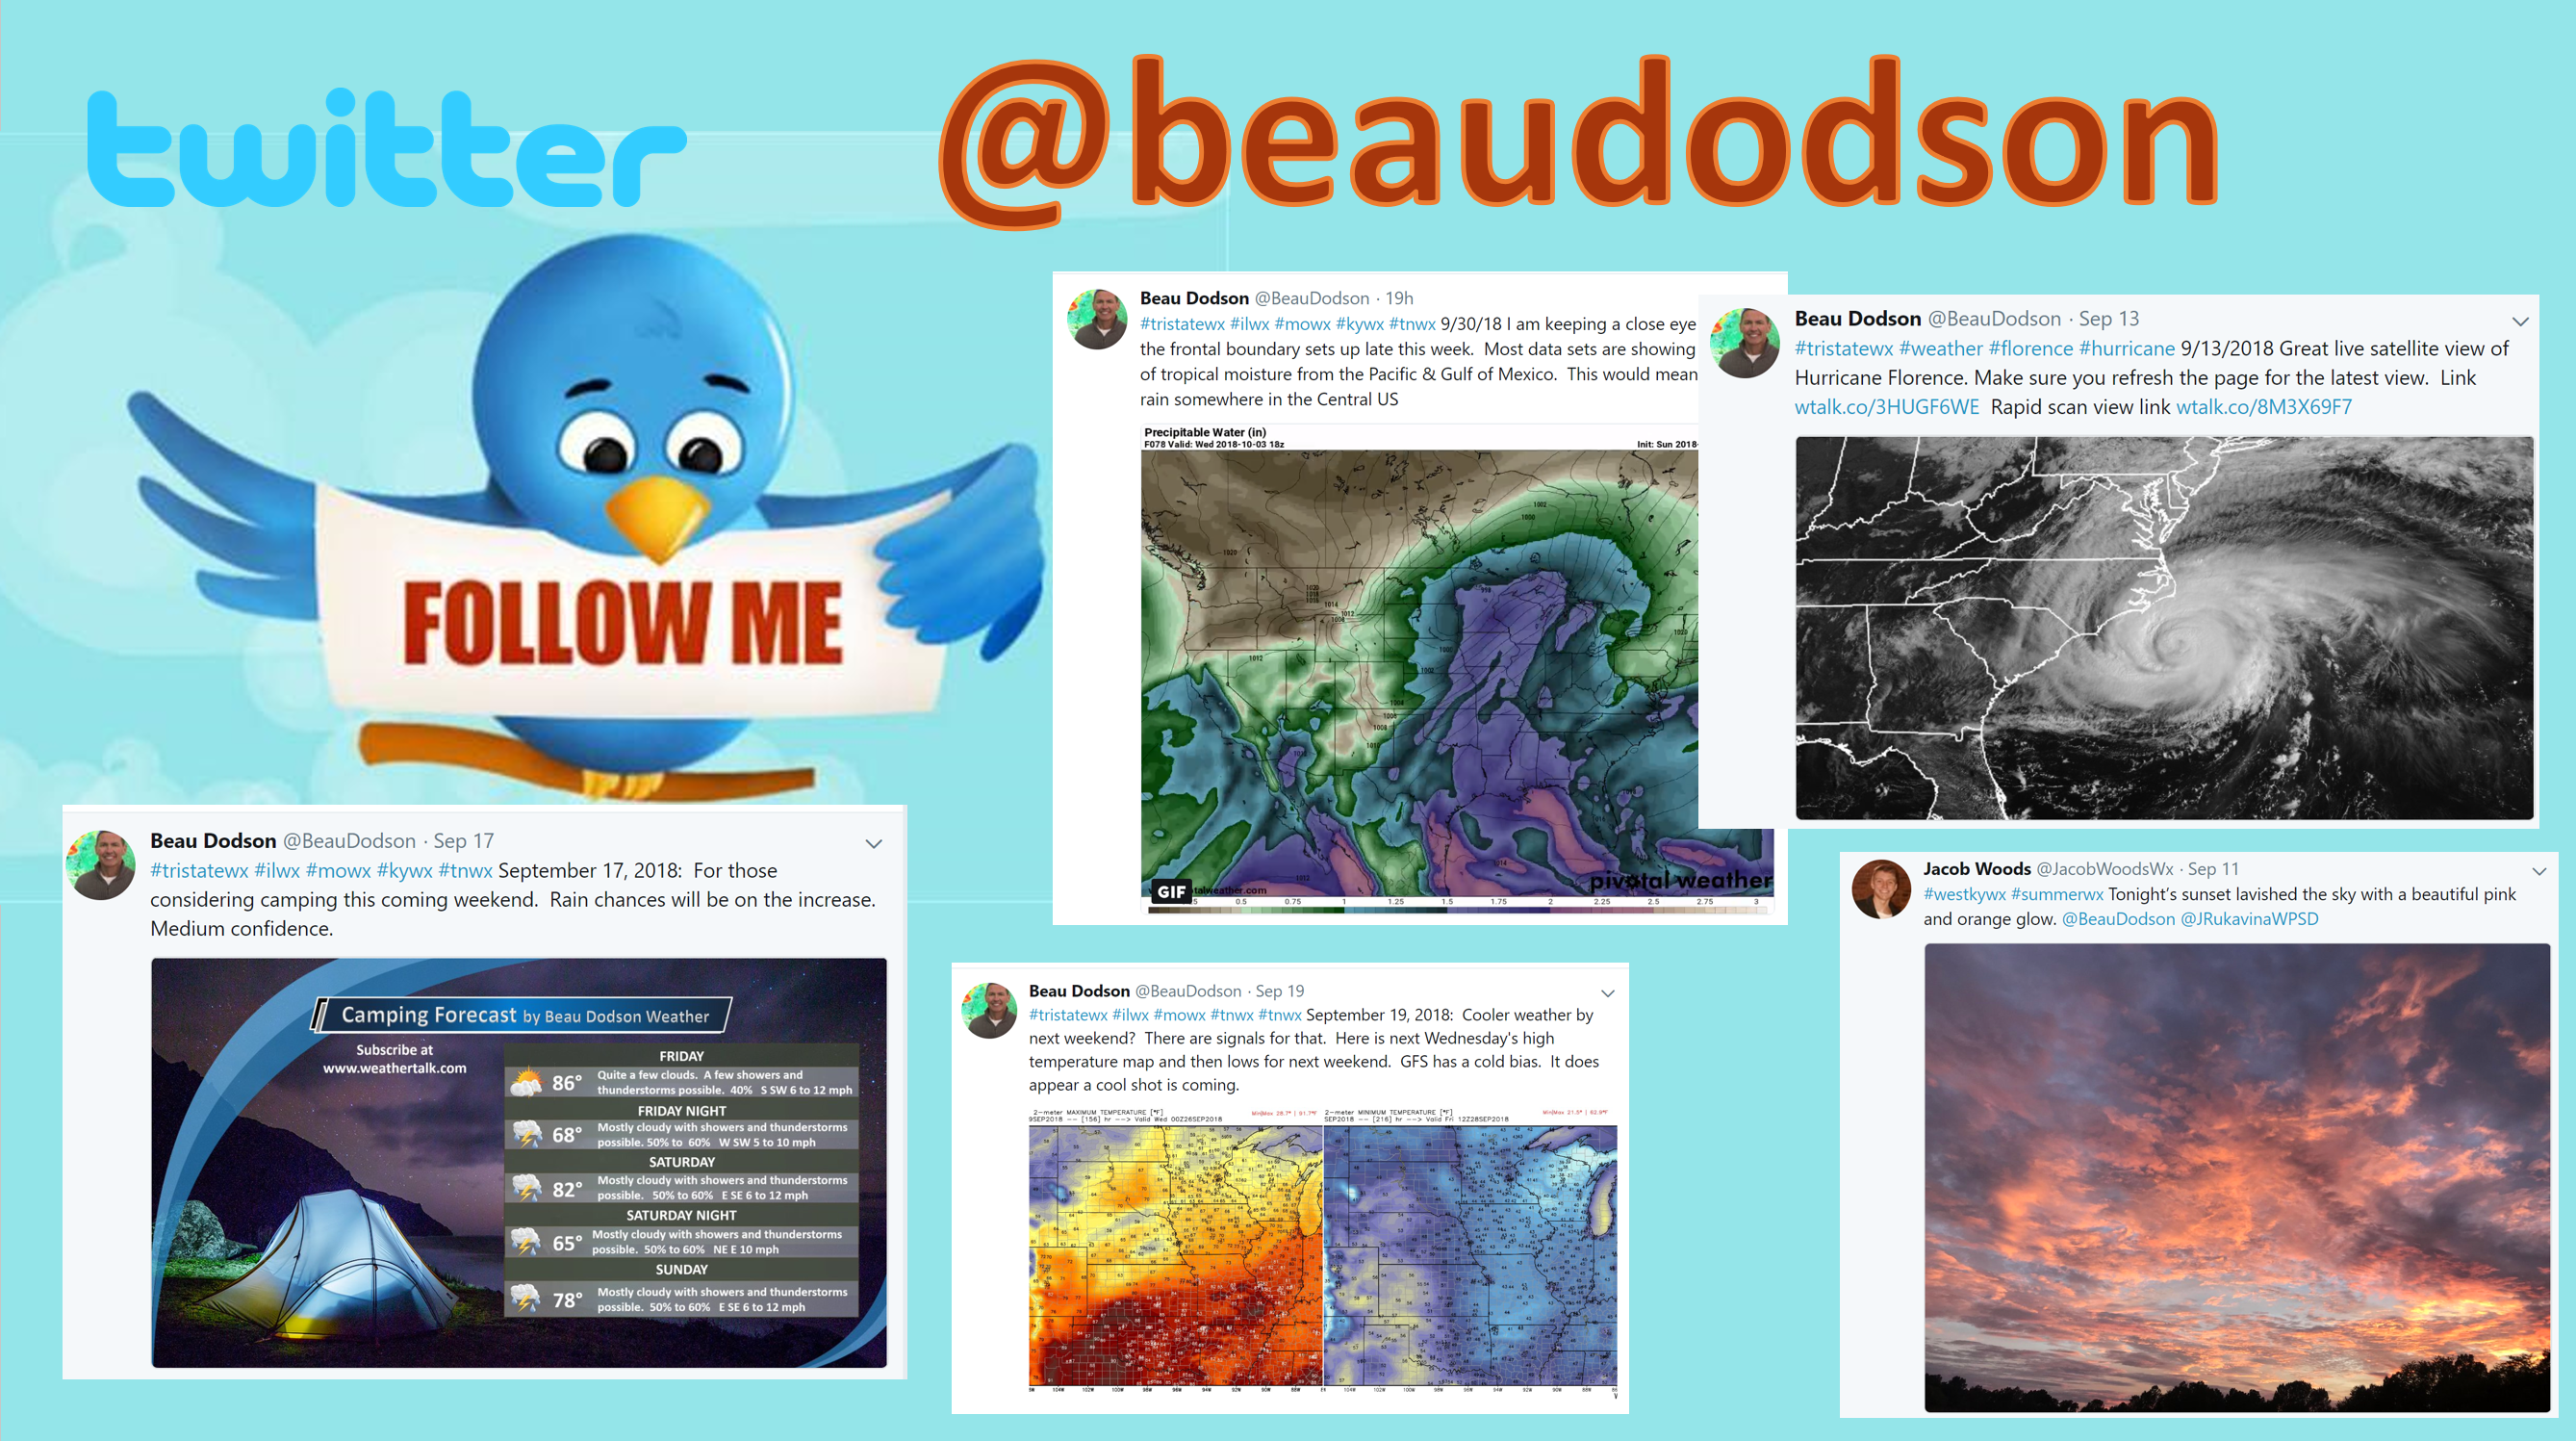
Find Beau on Facebook! Click the banner.


 .
.